Nasdaq 100 (NDX) Sits Just 4.1% Off Highs With a 100% Profitable Midterm Window About to Start
Nasdaq 100 is trading just below record territory as it approaches an Aug 20–Jun 13 midterm-year seasonal window that has never posted a loss in this dataset.
Price as of Aug 18, 2026: $29,490.96 (last close).

What is the seasonal pattern for Nasdaq 100 (NDX)?
Nasdaq 100 has risen in 9 of 9 midterm election years during the Aug 20–Jun 13 window, with an average gain of 22.8% in winning years.
- 9 for 9 in this window, with Nasdaq 100 averaging 22.8% gains across all winning years.
- Seasonal window runs from Aug 20 through Jun 13, spanning 298 calendar days in midterm election years.
- Percent Profitable is 100%, with 9 winners and 0 losers across the last nine midterm election-year samples.
- Annualized return for the pattern is 22.14%, with a Sharpe ratio of 1.45 based on end-of-window outcomes.
- TradeWave Ratio is 1.45, indicating price has typically traveled meaningfully in the long direction within the window.
- Cumulative return from stacking this midterm-year window across the sample is 504%, underscoring how powerful this slice of the calendar has been for long exposure.
According to historical data from TradeWave.ai, this midterm-year stretch has behaved very differently from an average year for the Nasdaq 100. The next section walks through how that pattern has played out in prior cycles and where the upcoming window fits in the broader election calendar.
How has Nasdaq 100 (NDX) traded in the Aug 20–Jun 13 midterm-year window?
Nasdaq 100 has closed higher in every single Aug 20–Jun 13 midterm election-year window in this dataset, with gains in 9 of 9 cycles and average profits of 22.8%. The index heads into this year’s iteration from 29,490.96 at the prior session’s close, about 4.1% below its 52-week high of 30,762.20 and well above the 52-week low of 22,841.42. That combination of a strong historical seasonal trend and a market sitting near the top of its recent range makes this window hard for index traders to ignore.
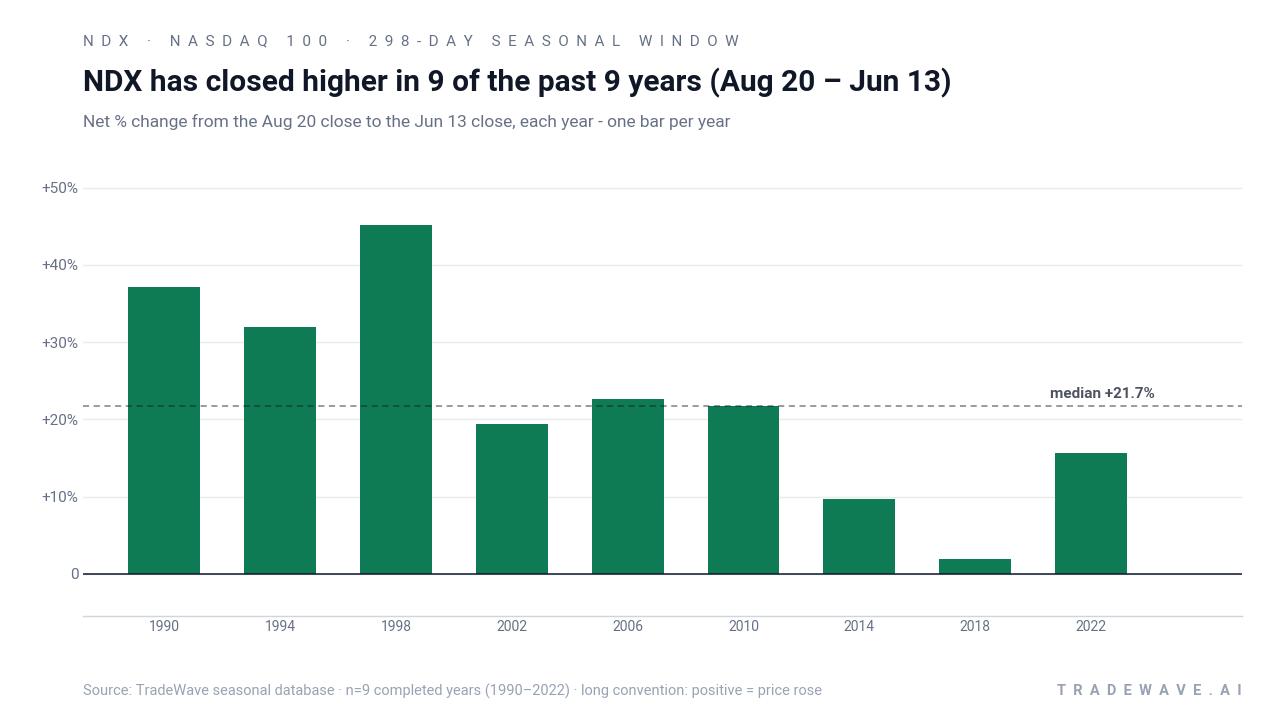
Grouping the data by the presidential election cycle matters here because this window bridges the back half of the midterm election year into the year before the presidential election, a phase that has often coincided with clearer policy visibility and a more supportive liquidity backdrop for growth stocks. In other words, this is the part of the four-year cycle when Washington uncertainty tends to fade and risk appetite in tech-heavy benchmarks like the Nasdaq 100 has historically picked up.
Across the nine midterm election-year samples, the pattern direction is firmly long. Percent Profitable sits at 100%, with 9 winners and 0 losers, and the median profit of 21.72% is close to the 22.8% average, which suggests the gains have not been driven by a single outlier year. The weakest outcome in the sample was still a positive 1.89% in 2018, while the strongest was a 45.11% surge in 1998, underscoring how this Nasdaq 100 seasonal trend has skewed to the upside in very different macro backdrops.
Average winner gains of 22.8% compare with an annualized return of 22.14% for the window, and the Sharpe ratio of 1.45 points to a historically attractive risk-adjusted profile for long exposure over this stretch. The cumulative return chart compounds those windows into a 504% gain across the nine midterm election years, which shows how repeatedly leaning with this pattern would have stacked returns over time rather than relying on a single blockbuster cycle.
Year-by-year ranges show how much NDX has typically swung inside the window before finishing higher.
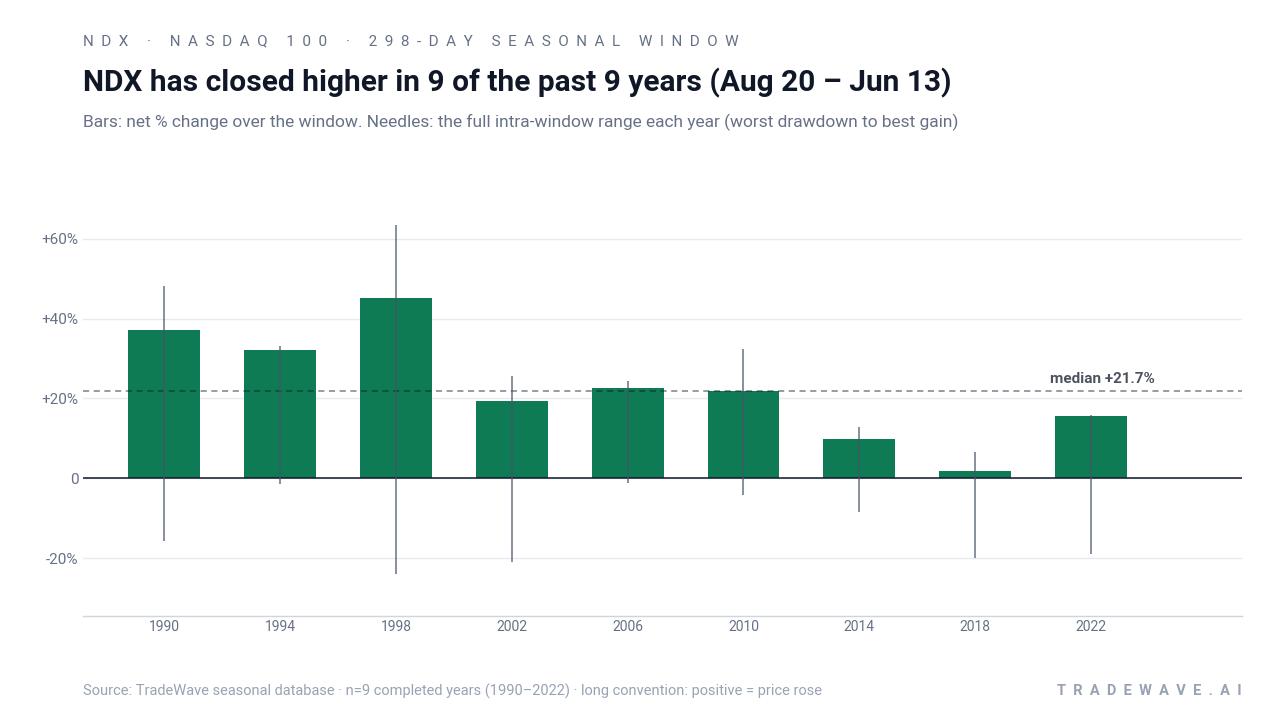
The intraperiod behavior has not been a straight line. Maximum favorable excursions, or the best point-to-peak moves within each window, have reached as high as 63.32% in 1998, while maximum adverse excursions, the worst drawdowns from entry, have been as deep as 23.95% in that same year. Several cycles, such as 1994 and 2006, saw relatively shallow worst drawdowns of less than 2%, while others like 2002, 2018 and 2022 experienced double-digit pullbacks before finishing the window in the green. That mix of large MFE and sometimes large MAE fits a profile of a bullish but volatile Nasdaq 100 trading window.
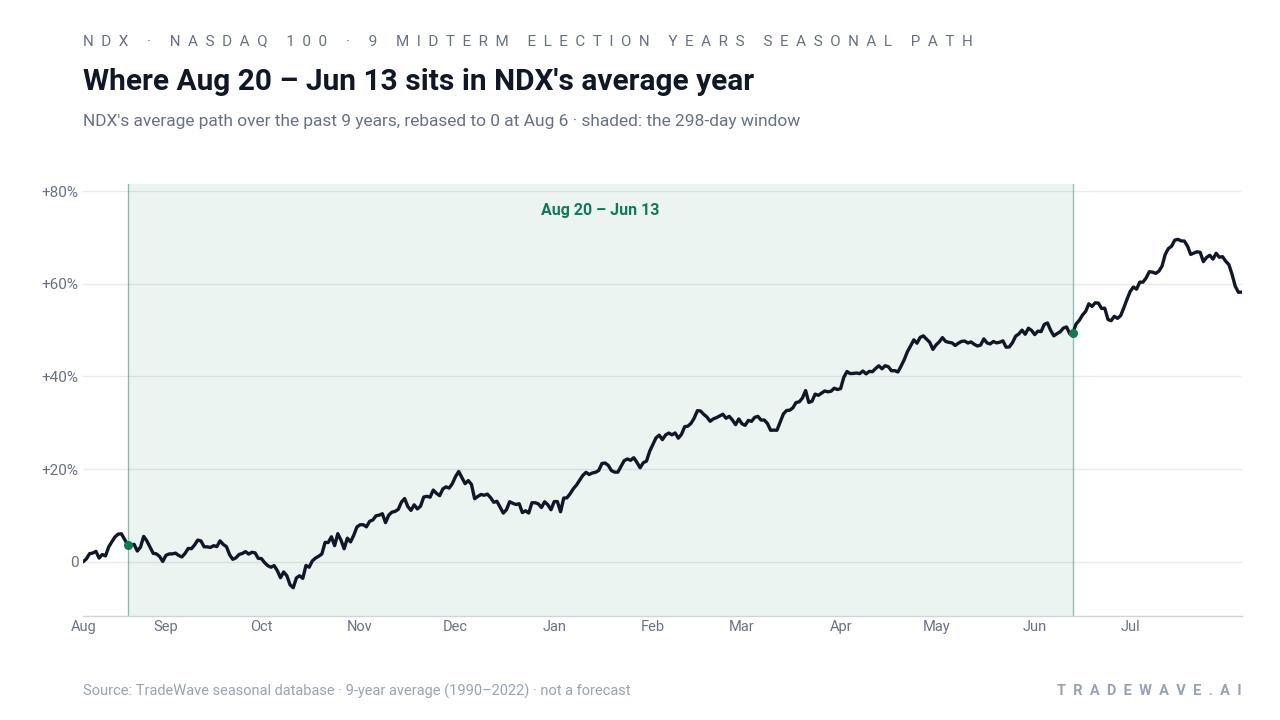
The trend view suggests the return profile tends to build over the course of the window rather than front-load all the gains. In many of the stronger years, NDX has pushed higher through the fall and into the following spring, with some of the sharpest run-ups occurring after mid-cycle policy and earnings uncertainty has cleared. The weaker but still positive years often show a choppier path, with deeper early drawdowns that recover later in the window.
Put it together and the message is simple: nine for nine, with sizable average gains, but plenty of volatility along the way.
History does not guarantee future results; adverse excursions (MAE) can be large even in winning windows.
Why does Nasdaq 100 (NDX) follow this seasonal pattern?
One likely driver is the way the earnings calendar and policy cycle line up between late summer of the midterm election year and the following June. Analysts have pointed to a pattern where political uncertainty peaks earlier in the midterm year, then fades as results and policy paths become clearer, while big tech earnings and guidance updates cluster in the fall and spring. This window may also reflect institutional portfolio repositioning into growth and technology as visibility improves and the market transitions toward the historically stronger year before the presidential election.
What is driving Nasdaq 100 (NDX) today?
Nasdaq 100 slipped 1.68% in the prior session to close at 29,490.96, easing back from its recent record zone but still trading comfortably above its 50-day moving average of 29,306.07. The pullback came as rising crude prices and higher bond yields pressured risk assets, offsetting some of the enthusiasm that had pushed the S&P 500 to an all-time high earlier this week and leaving futures on major indices, including NDX, showing mixed signals around the close.[1]
Under the surface, the same forces that have defined this year’s Nasdaq 100 story remain in play. Surging demand for artificial intelligence infrastructure continues to funnel flows into mega-cap technology names, which dominate the index’s weight and have helped drive its outperformance during risk-on stretches.[2] At the same time, higher yields and firmer energy prices have periodically sparked rotations out of long-duration growth stocks, creating the kind of two-way volatility that has shown up in recent e-mini futures trading around Fed communications and key data releases.[3]
That backdrop matters as the calendar flips into the midterm election year’s late-summer phase. The S&P 500’s record close alongside more hesitant Nasdaq futures trading underscores how leadership has narrowed and how sensitive tech valuations are to any shift in the rates or policy narrative.[3] With the index sitting just below its 52-week high and heading into a historically powerful Nasdaq 100 seasonal window, traders will be watching whether macro headwinds like yields and oil can overpower the pattern or simply inject more noise into an otherwise constructive trend.
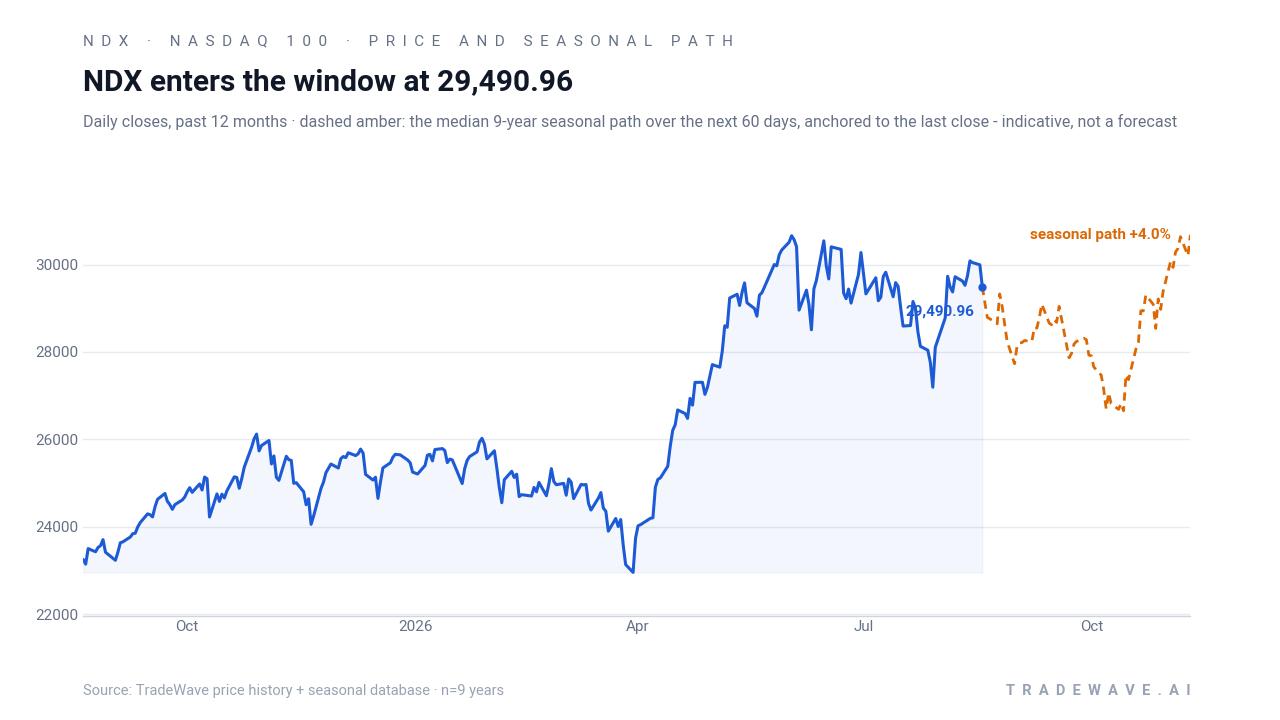
The chart below shows how NDX has traded over the past year, alongside the median seasonal path for the next 60 days.
Sources
- Tech boost lifts Nasdaq futures; investors watch Fed minutes and retail earnings (Aug 17, 2026)
- Rising crude and higher yields weigh and settle markets including Nasdaq (Aug 17, 2026)
- S&P 500 hits all-time high while futures slip; mixed e-mini signals for Nasdaq (Aug 18, 2026)
- AI demand and tech sector flows in major U.S. indices (2026)
- Technology sector strength as a driver of Nasdaq 100 performance (2026)
- Seasonal Market News methodology for TradeWave-based election-cycle patterns (2026)
- Afshin Moshrefi, The 100-Year Pattern, 2026 edition
- TradeWave.ai seasonal database entry for NDX Aug 20–Jun 13 midterm-year window
- NDX price and 60-day seasonal projection chart asset (2026)
- NDX seasonal bars and MAE/MFE chart asset (1990–2022 sample)
- NDX seasonal trend chart asset for Aug 20–Jun 13 window (1990–2022 average)
About this seasonal analysis
Seasonal pattern data is sourced from TradeWave.ai, which analyzes historical price behavior across annual calendar windows going back up to 30 years. Read the full data methodology or the book The 100-Year Pattern by Afshin Moshrefi (2026 edition). Past performance of seasonal patterns does not guarantee future results. This article is for informational purposes only and does not constitute investment advice.