Weak Jobs Data Eases Fed Fears as Nasdaq 100 (NDX) Climbs Toward a 298-Day Midterm Rally Window
Nasdaq 100 is hovering near record levels as it approaches a 298-day midterm-year seasonal window that has never closed lower in the past nine cycles.
Price as of Aug 7, 2026: $29,722.30 (last close).

What is the seasonal pattern for Nasdaq 100 (NDX)?
Nasdaq 100 has risen in 9 of 9 midterm-year Aug 20 to Jun 13 windows, with an average gain of 22.8% in winning years.
- 9 for 9 in this window, with Nasdaq 100 averaging 22.8% gains across winning years.
- Seasonal window runs from Aug 20 through Jun 13, spanning 298 calendar days in midterm election years.
- Percent Profitable is 100%, with 9 winners and 0 losers across the historical sample.
- Annualized return over these windows is 22.14%, with a Sharpe ratio of 1.45 on end-of-window outcomes.
- Trade Direction is long, and the TradeWave Ratio of 1.45 signals strong typical travel in the upside direction within the window.
- Individual years have still seen double-digit drawdowns inside the window before finishing higher, underscoring meaningful volatility risk.
According to historical data from TradeWave.ai, this midterm-year stretch for the Nasdaq 100 has behaved very differently from an average calendar year. TradeWave.ai’s seasonal database flags the upcoming Aug 20 to Jun 13 window as one of the index’s most consistently positive regimes across the last nine midterm election cycles.
How strong is the upcoming Nasdaq 100 (NDX) seasonal window?
Nasdaq 100 has closed higher in every single Aug 20 to Jun 13 window across the last nine midterm election years, averaging a 22.8% gain for long positions. The index ended the prior session at 29,722.30, up 1.2% on the day and about 3.4% below its 52-week high of 30,762.20. That combination of a powerful historical tailwind and a market already near the top of its range gives this year’s window unusual weight for traders watching the tech-led rally.
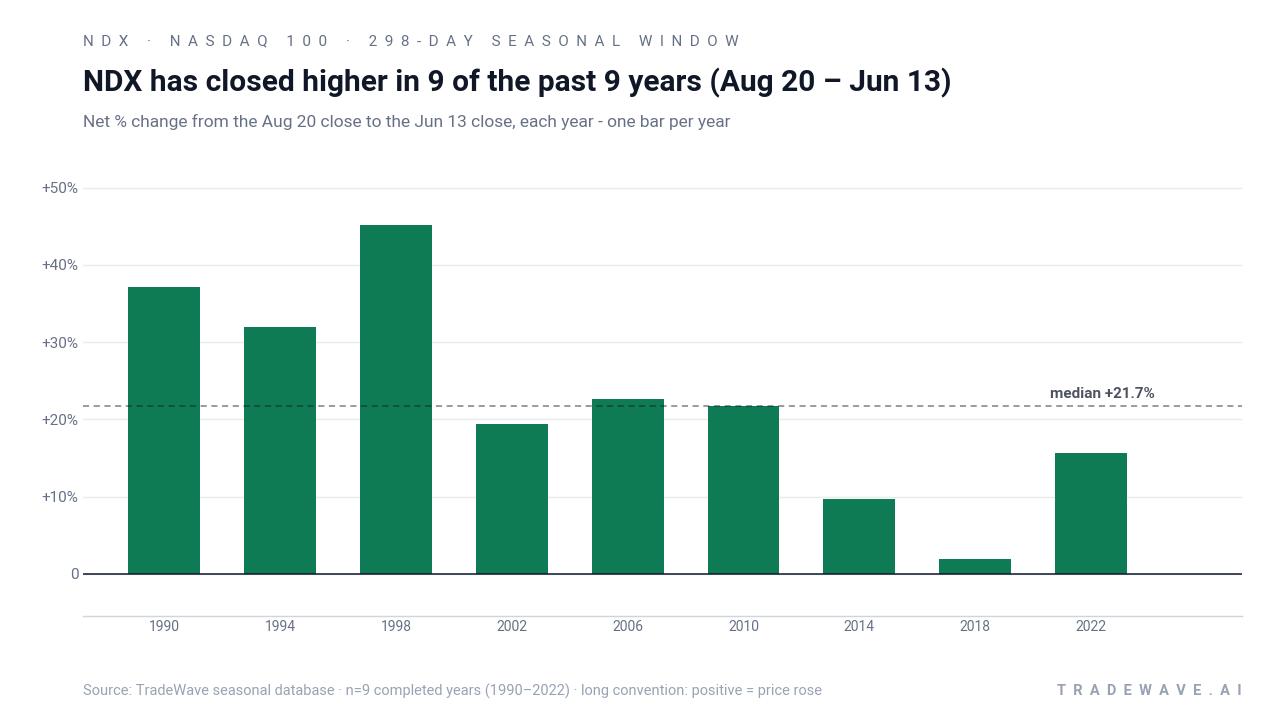
The pattern phase here is the midterm election year, while the calendar is also in a midterm election year, which matters because policy uncertainty and Fed signaling often peak in this part of the cycle. Grouping only midterm years strips out the very different behavior seen in presidential and pre-election years and isolates how tech-heavy benchmarks like the Nasdaq 100 have traded when Washington is focused on fiscal debates rather than campaigns.
Historically, the trade direction for this window is long. Percent Profitable is 100%, with 9 winners and 0 losers, so every midterm-year iteration since 1990 has delivered a positive close-to-close return for the index over this 298-day stretch. Average profit across those winning years is 22.8%, with a median outcome of 21.72%, which means the typical result has been a sizeable double-digit gain rather than a marginal drift higher.
The annualized return of 22.14% and Sharpe ratio of 1.45 point to a strong risk-adjusted profile for end-of-window outcomes. In plain English, the historical seasonality has rewarded long exposure in this Nasdaq 100 trading window more often and more cleanly than many other parts of the calendar. The cumulative return chart compounds those windows to 504%, showing how repeatedly capturing this slice of the year would have stacked gains over the nine midterm cycles.
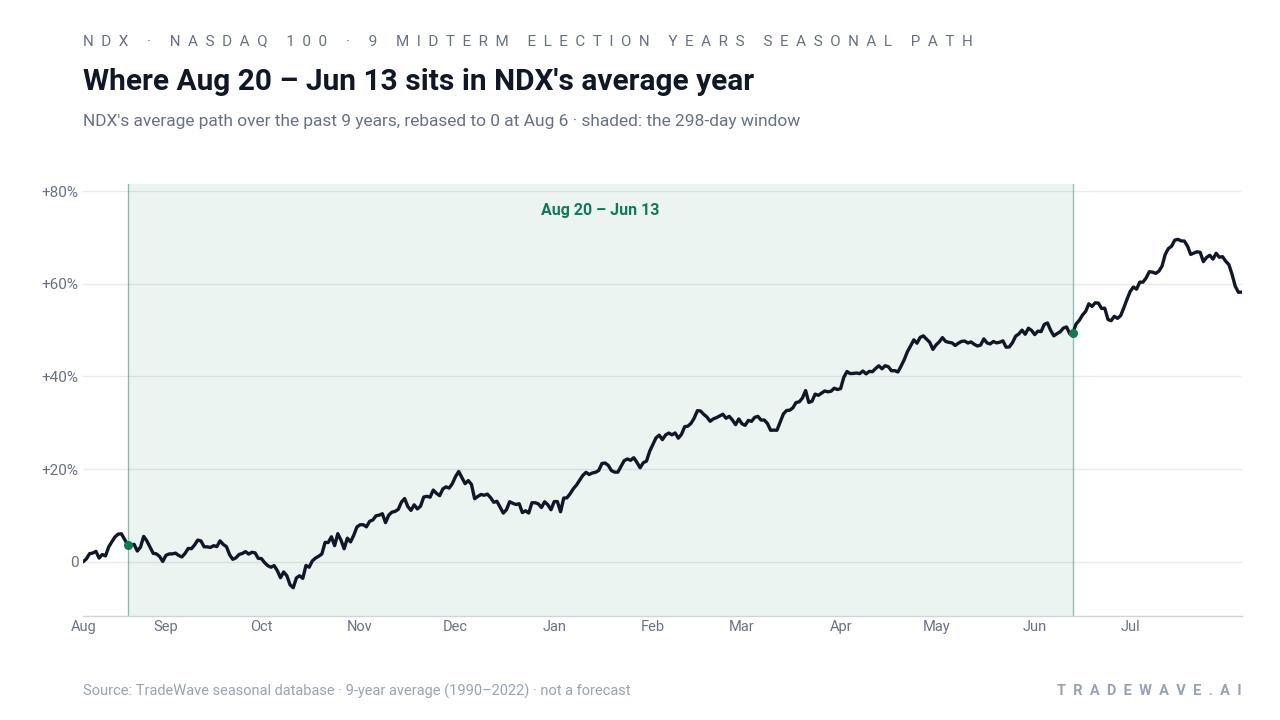
Year-by-year ranges show how much the index has typically swung inside the window before finishing higher.
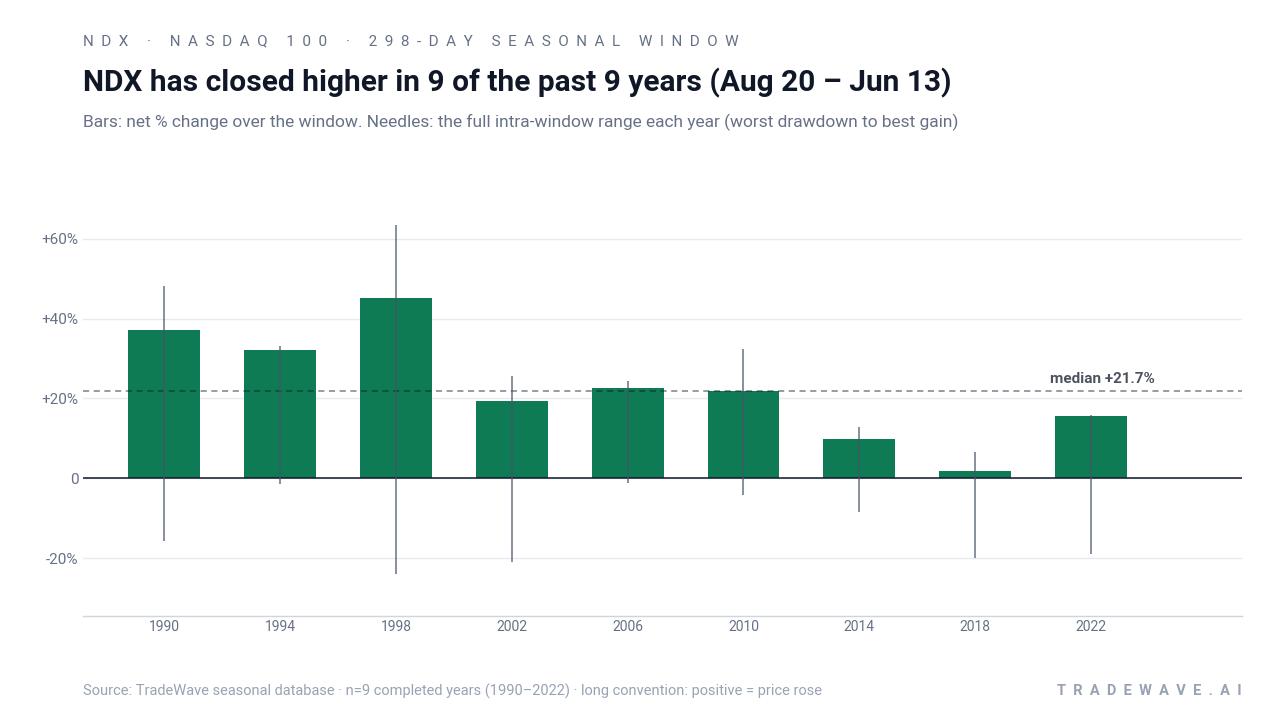
The maximum favorable excursions in strong years have been striking. In 1998, for example, the index’s best point-to-peak move inside the window reached 63.32%, while 1990 and 2010 also saw peak gains north of 30%. At the same time, maximum adverse excursions have often been deep: 1998, 2002, 2018 and 2022 all recorded worst drawdowns of roughly 19% to 24% from the entry level before recovering, underscoring that the path to those positive closes has rarely been smooth.
Trend statistics back up that picture of persistent but sometimes choppy upside. The pattern shows 56 long-trend days versus just 2 short-trend days on one measure, and 44 long-trend days versus 9 short-trend days on a shorter look, suggesting that rallies have tended to dominate the tape even when pullbacks hit. The cumulative return line climbs in a stair-step fashion rather than a straight line, which fits a narrative of tech-led bursts around earnings seasons and policy shifts inside an overall bullish seasonal regime.
Put together, the message from the seasonal data is simple: nine for nine, with big average gains and meaningful swings along the way. History does not guarantee a repeat, but this specific midterm-year window has consistently favored long Nasdaq 100 exposure over the past three decades.
Why does Nasdaq 100 (NDX) follow this seasonal pattern?
One likely driver is the way earnings and product cycles cluster for large technology and communication-services companies between late summer and the following spring. Analysts have also pointed to institutional portfolio rebalancing and fiscal-year-end positioning, which often push investors back into growth and AI themes after midyear volatility. This pattern may also reflect the broader presidential election cycle, where midterm-year policy uncertainty tends to fade into a more risk-on backdrop as markets look ahead to the pre-election year.
History does not guarantee future results; adverse excursions (MAE) can be large even in winning windows.
What is driving Nasdaq 100 (NDX) today?
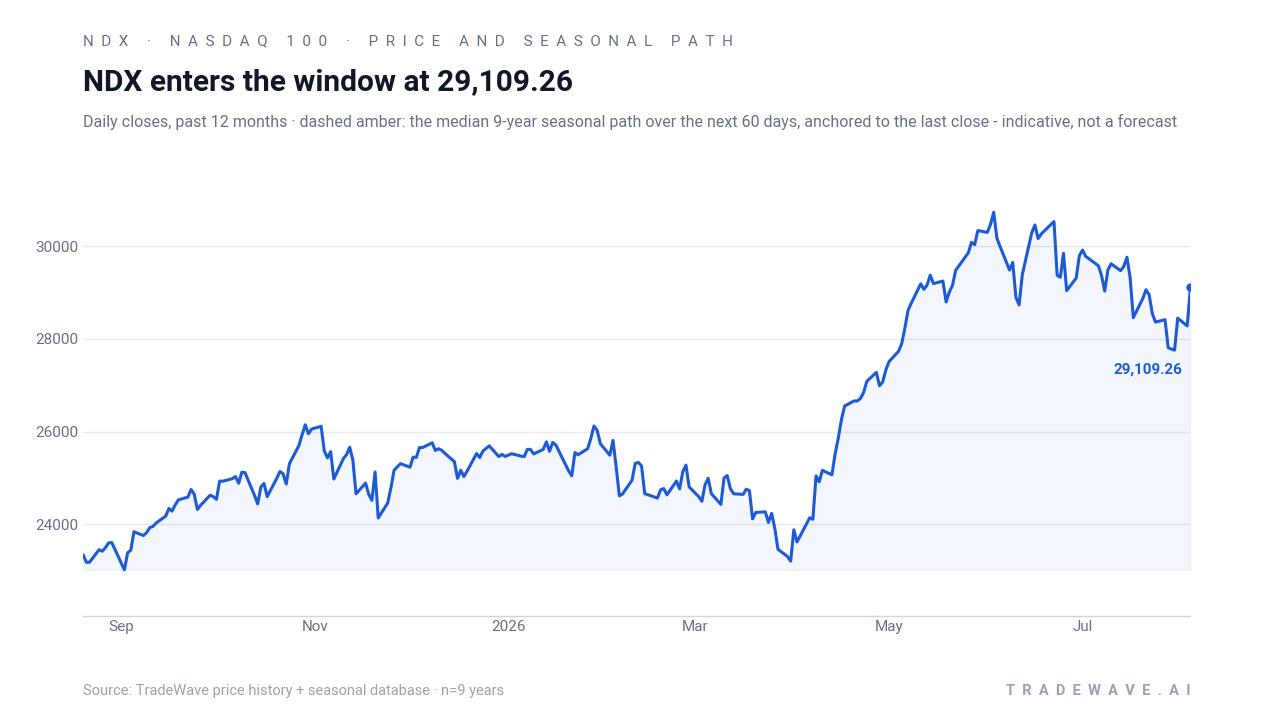
Nasdaq 100 closed the prior session at 29,722.30, up 348.97 points or 1.2%, leaving the index about 3.4% below its 52-week high of 30,762.20 and roughly 30.1% above its 52-week low of 22,841.42. The move capped a powerful stretch for tech and AI names, with a recent four-day “melt-up” adding about $3.5 trillion in market value to the index as investors chased strong earnings and aggressive AI spending plans.[1] Fresh software results from names like Atlassian, Twilio and Cloudflare have reinforced that theme, with double-digit stock jumps spilling over into broader Nasdaq 100 strength.[1]
Macro conditions have been unusually supportive for a late-cycle tech rally. Weak U.S. jobs data in early August eased fears of additional near-term Federal Reserve rate hikes, helping long-duration growth stocks and pushing the Nasdaq 100 higher alongside record levels for the S&P 500.[5] At the same time, geopolitical worries around the Strait of Hormuz briefly knocked risk appetite and produced a down session for the index, a reminder that headline risk can still cut through the AI narrative on any given day.[5] For now, though, the dominant story is a market that has leaned hard into technology and AI exposure just as a historically strong midterm-year seasonal window approaches.
The chart below shows how that surge fits into the past year’s trading range and the typical seasonal path over the next two months.
What should traders watch as this Nasdaq 100 seasonal window approaches?
First, the calendar. The 298-day window begins on Aug 20 and runs through Jun 13, covering two full earnings seasons, the holiday period and the early part of the pre-election year. Historically, behavior inside this stretch has been very different from the choppier first half of midterm years, so traders will be watching whether volatility around macro headlines fades or persists as the window opens.
Second, key levels. With the index only about 3.4% below its 52-week high, how Nasdaq 100 trades around the 30,000 to 30,700 band will matter for sentiment. A sustained break above the prior high early in the window would rhyme with past years where rallies accelerated into year-end, while repeated failures near that zone would mark a departure from the historical seasonal trend.
Third, the macro and policy calendar. Upcoming labor data, Fed communications and any escalation or easing in geopolitical tensions around energy supply will shape how comfortable investors feel keeping heavy exposure to high-multiple tech and AI names.[1][5] In prior midterm cycles, the strongest seasonal years often coincided with periods when rate fears receded and Washington gridlock limited the risk of major policy surprises.
Finally, traders will be monitoring whether the current AI-driven leadership broadens or narrows as the window unfolds. If earnings strength and capital spending plans continue to support a wide swath of Nasdaq 100 components, the historical pattern of persistent upside could find fresh fuel.[1] If instead gains concentrate in a handful of mega-caps while macro data softens, any sharp intraperiod drawdowns would look more like the deeper MAE years in the historical record. Either way, the next 298 days sit inside one of the index’s most distinctive seasonal regimes, and how price behaves relative to that backdrop will be a key tell for tech risk appetite into the pre-election year.
Sources
- 1. Seeking Alpha (via Bloomberg mentioned), “AI-driven tech melt-up fuels $3.5T Nasdaq 100 surge in four days,” Aug 5, 2026.
- 5. Stocktwits on Yahoo Finance, “S&P 500, Dow, Nasdaq End Lower Amid Hormuz Uncertainty As Investors Await Jobs Data To Judge Fed Rate Course — SOUN, GOOGL, SPCX, NVDA In Focus,” Aug 7, 2026.
About this seasonal analysis
Seasonal pattern data is sourced from TradeWave.ai, which analyzes historical price behavior across annual calendar windows going back up to 30 years. Read the full data methodology or the book The 100-Year Pattern by Afshin Moshrefi (2026 edition). Past performance of seasonal patterns does not guarantee future results. This article is for informational purposes only and does not constitute investment advice.