Cardinal Health (CAH) Has Risen in 8 of 9 Midterm Fall Windows, Averaging 11.44% Gains
Cardinal Health is approaching a late‑August seasonal window that has been strikingly strong in past midterm election years, just as the stock trades near record highs after upbeat earnings and guidance.
Price as of Aug 18, 2026: $234.98 (last close).

What is the seasonal pattern for Cardinal Health (CAH)?
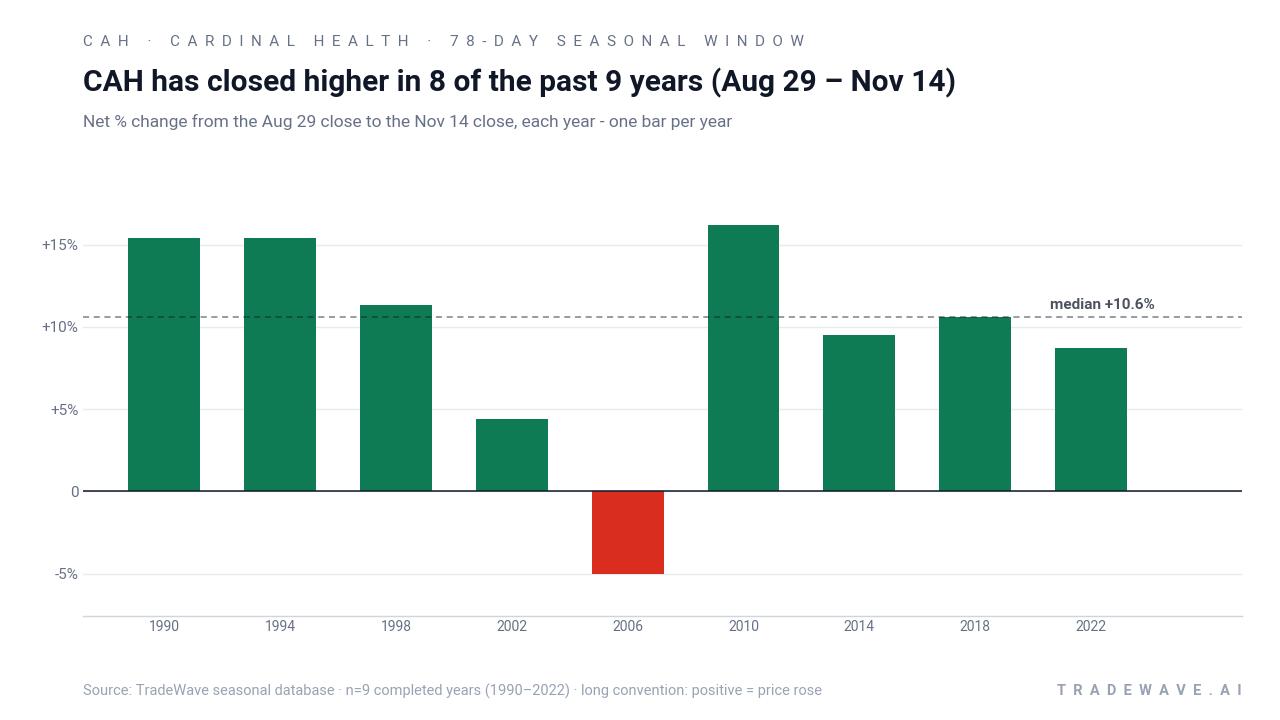
Cardinal Health has risen in 8 of 9 midterm‑year Aug 29–Nov 14 windows, with an average gain of 11.44% in winning years.
- 8 wins and 1 loss in this 78‑day window across the last 9 midterm election years, a 89% win rate for long trades.
- Window runs from Aug 29 to Nov 14, aligning with the late‑year stretch of the midterm election year in the presidential cycle.
- Avg Profit in winning years is 11.44%, while Avg Profit - All, including the lone losing year, is still a solid 10%.
- The worst year in the sample lost 5.01%, showing that even a strong CAH seasonal trend has produced at least one meaningful drawdown.
- Intraperiod swings have been sizable, with several years showing double‑digit rallies and mid‑single‑digit pullbacks before the window closed higher.
- Trade Direction is long, so this historical seasonality has favored upside exposure rather than hedging or short setups.
According to historical data from TradeWave.ai, this upcoming late‑August window for Cardinal Health has behaved very differently from an average autumn stretch in prior midterm election years.
How has Cardinal Health (CAH) traded in past midterm‑year fall windows?
The seasonal window that begins on Aug 29 and runs for 78 days has been one of Cardinal Health’s most reliable stretches, with the stock closing higher in 8 of the last 9 midterm election years and posting an average gain of 11.44% in those winning seasons. Today shares finished at 234.98, down 0.3% on the day, after a powerful run that has left the stock up 66.4% year to date. That combination of a strong CAH seasonal pattern and an already extended price move is what makes this particular window stand out on the healthcare sector seasonal outlook.
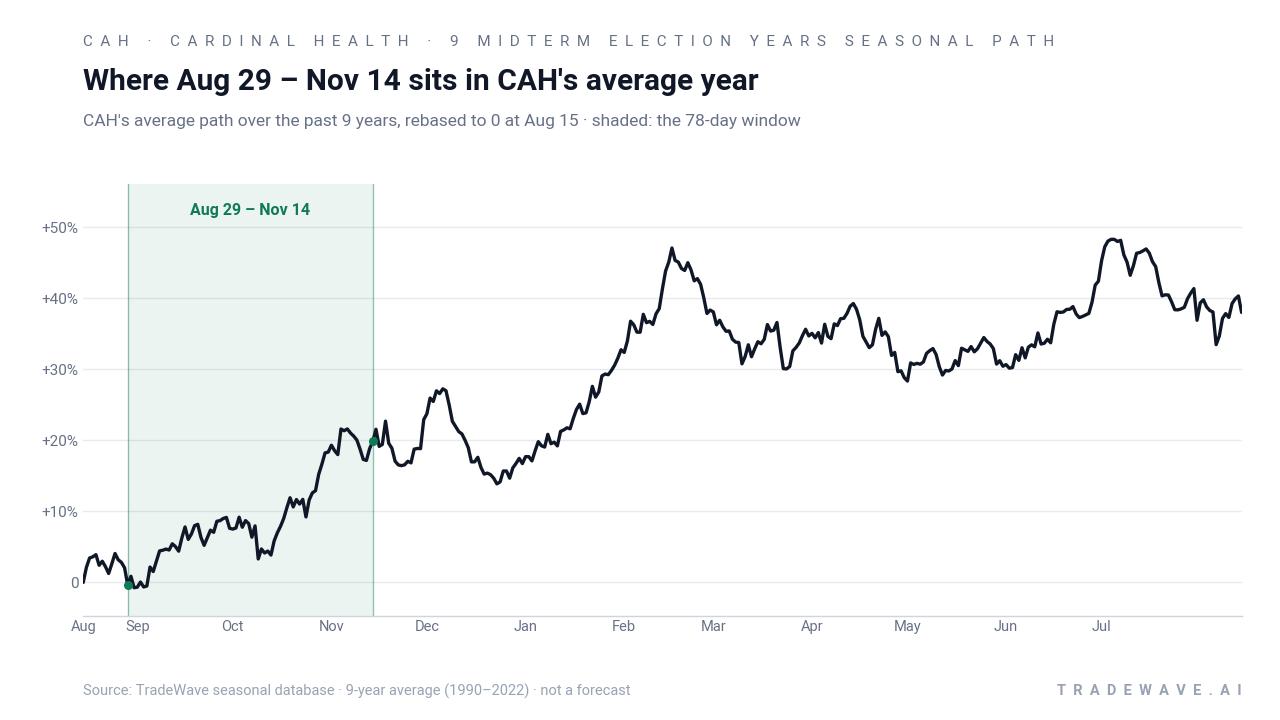
Because this pattern is grouped by the presidential election cycle, it reflects how CAH has behaved specifically in the midterm election year, not just any random autumn. Midterm years often bring policy noise around healthcare reimbursement, drug pricing and fiscal priorities, and this window sits in the back half of that year, when Washington headlines start to intersect with portfolio repositioning ahead of the stronger pre‑election year.
Across the nine midterm‑year samples since 1990, the long trade direction has clearly been favored. Percent Profitable sits at 89%, with 8 winners and just 1 loser, and the all‑years average outcome of 10% suggests that the single down year did not fully offset the stronger rallies. The median gain of 10.59% lines up closely with the average, which points to a fairly consistent CAH seasonal trend rather than one or two outlier years driving the statistics.
Looking at individual years, 2010 stands out as one of the strongest, with a 16.17% net return and only a shallow 1.72% worst drawdown from entry. At the other end of the spectrum, 2006 delivered the lone losing outcome, with a 5.01% decline and a worst intraperiod drop of 6.55%, a reminder that even a strong pattern can misfire. More recent history has also been constructive: in 2022, CAH gained 8.72% in this window, with the best point‑to‑peak move reaching 17.91% before settling back.
The maximum favorable excursions, or best run‑ups within the window, have often been larger than the final closes. Several years, including 1990, 1998 and 2022, saw intra‑window rallies of roughly 18% to 23% before giving back some ground by day 78. On the downside, maximum adverse excursions have typically sat in the mid‑single‑digit range, with the worst years seeing drawdowns of about 7% to 8% from the entry level before recovering.
A second view combines yearly net results with the full intraperiod range, from worst drawdown to best rally.
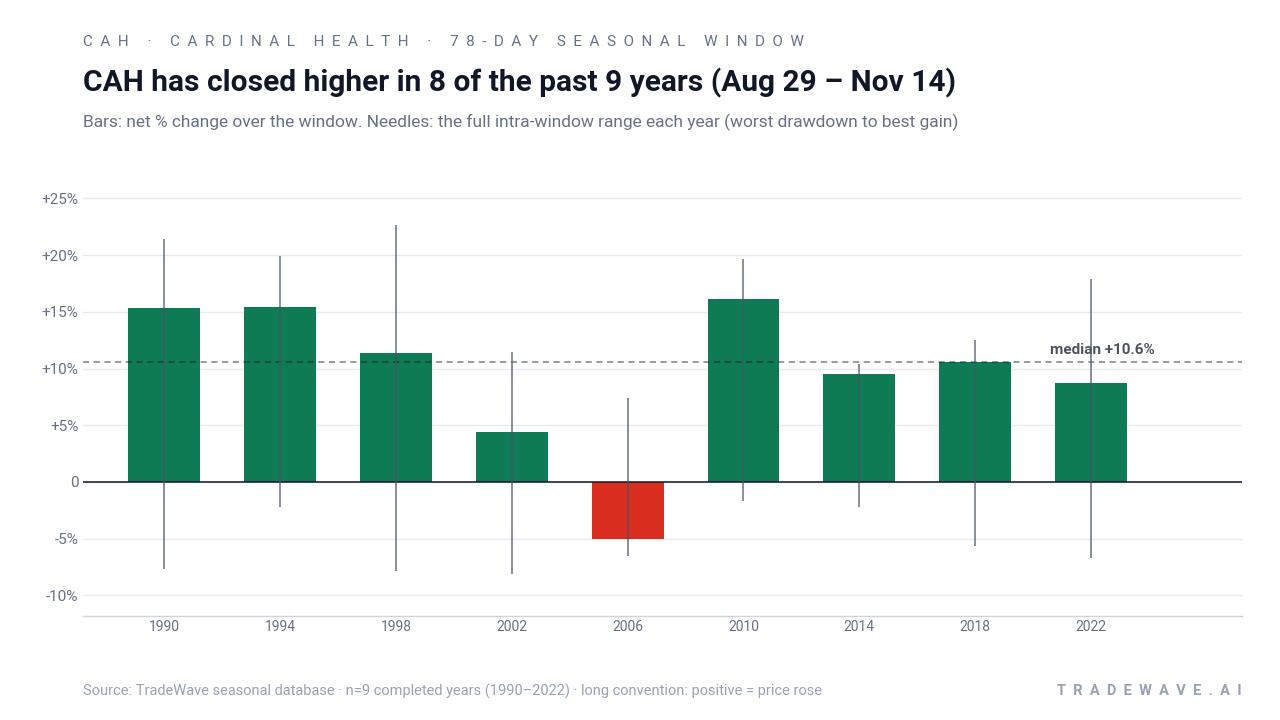
History does not guarantee future results; adverse excursions (MAE) can be large even in winning windows.
Why does Cardinal Health (CAH) follow this seasonal pattern?
One likely driver is the way healthcare distributors sit at the intersection of policy and earnings during the midterm election year. Late summer into mid‑November often captures fiscal‑year budgeting by hospitals and payers, plus updated guidance from drugmakers that flows through to distributors’ volume outlooks. Analysts have also pointed to institutional portfolio repositioning ahead of the historically stronger pre‑election year, which can favor defensive growth names like CAH as investors balance policy risk with steady cash‑flow stories.
What is driving Cardinal Health (CAH) today?
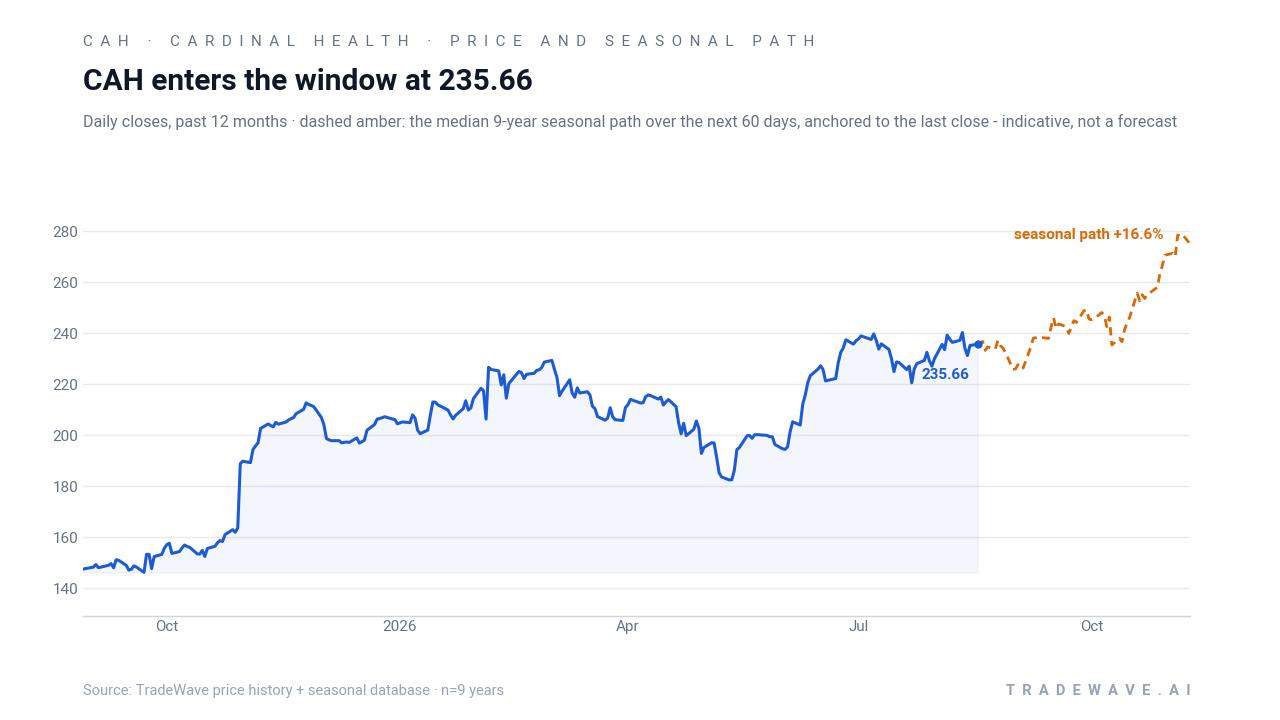
Cardinal Health closed Wednesday at 234.98, off 0.3% on the session, but the bigger story is the 66.4% year‑to‑date surge that has pushed the stock into the upper end of its 52‑week range and kept it in a firm uptrend. The move accelerated after the company reported quarterly revenue of about $63.67 billion and adjusted EPS of $2.60 for the period ended Jun 30, 2026, topping profit expectations even as sales came in a bit light, and paired that with guidance calling for 13% to 15% adjusted earnings growth in fiscal 2027.[5]
That upbeat outlook followed earlier commentary that highlighted a resilient pharmaceutical distribution core and specialty‑led growth in areas such as oncology and GLP‑1 therapies, themes that have helped CAH outpace both the S&P 500 and healthcare sector ETFs over the past year.[2] In the run‑up to the Aug 11 earnings release, pre‑earnings coverage pegged the average analyst price target around 252.40, only modestly above where the stock was trading at the time, suggesting that the subsequent guidance upgrade may have forced some models to catch up with the price.[3]
Fresh institutional interest has added another layer of support. On Aug 18, several filings showed new positions in Cardinal Health from asset managers including Occidental Asset Management, GSA Capital Partners and BlackRock, underscoring how the stock has moved from a contrarian healthcare pick to a core holding in many portfolios.[9][10][11] A separate Aug 6 note flagged that CAH had just printed a new 12‑month high, a milestone that often draws in momentum‑oriented traders alongside long‑only funds.[12]
The chart below situates the latest move in its recent multi‑month context, alongside a historical seasonal projection.
What should traders watch as this CAH seasonal window approaches?
First, the calendar: the 78‑day window opens on Aug 29 and runs through Nov 14, overlapping the heart of the midterm election‑year policy calendar, when drug‑pricing rhetoric and reimbursement debates can flare. Traders watching the CAH seasonal trend will be focused on whether the stock can maintain its current uptrend into that start date or whether a pre‑window pullback resets expectations after the 66.4% year‑to‑date run.
Second, levels and volatility matter. With the 52‑week high at 258.30 and the 52‑week low near 143.51, CAH is trading much closer to the top of its range, and the historical pattern shows that even winning years have seen mid‑single‑digit drawdowns inside the window. If the stock were to slide 5% to 8% from the entry level early in the period, that would still be consistent with prior midterm‑year behavior, provided buyers step back in before the window closes.
Third, the policy and earnings tape will shape how this pattern plays out. Any shifts in Medicare reimbursement, GLP‑1 coverage decisions or hospital spending trends could either reinforce or overwhelm the historical seasonality, especially as investors look ahead to the pre‑election year, which has often been friendlier to risk assets. Follow‑through on the company’s 13% to 15% fiscal 2027 earnings growth guidance, and any updates on specialty distribution momentum, will be key checkpoints as the window progresses.[5]
Finally, watch positioning and flows. The recent wave of institutional buying suggests that CAH is firmly on the radar of large asset managers, and additional filings or ETF allocation shifts could either extend the trend or signal that the easy part of the move is over.[9][10][11] If the stock respects its historical pattern by absorbing pullbacks and grinding higher through mid‑November, that would reinforce the idea that this midterm‑year window remains a constructive part of the CAH trading playbook. A sharp break below typical intraperiod drawdowns, by contrast, would be an early sign that this cycle is diverging from the past.
Sources
- Yahoo Finance (Barchart article republished) - Cardinal Health Stock: Analyst Estimates & Ratings
- Yahoo Finance (Simply Wall St content) - Cardinal Health (CAH) Stock Draws Fresh Price Target Split After Analyst Revisions
- Yahoo Finance - Earnings To Watch: Cardinal Health (CAH) Reports Q2 Results Tomorrow
- Yahoo Finance (Insider Monkey republished) - Cardinal Health (CAH) Price Target Upped by $4 After Beating Q1 Profit Estimates
- CNBC - We're lifting our price target on Cardinal Health after issuing rosy profit guidance
- Zacks.com - Bull of the Day: Cardinal Health (CAH)
- Barchart - Cardinal Health Stock: Is CAH Outperforming the Healthcare Sector?
- MarketBeat - CAH Stock Holds Uptrend After Earnings, Gene Therapy Growth Ahead
- MarketBeat (instant alert) - 28,593 Shares in Cardinal Health, Inc. $CAH Acquired by Occidental Asset Management LLC
- MarketBeat (instant alert) - GSA Capital Partners LLP Acquires New Position in Cardinal Health, Inc. $CAH
- MarketBeat (instant alert) - BlackRock Inc. Acquires New Position in Cardinal Health, Inc. $CAH
- MarketBeat (instant alert) - Cardinal Health (NYSE:CAH) Reaches New 12-Month High - Still a Buy?
About this seasonal analysis
Seasonal pattern data is sourced from TradeWave.ai, which analyzes historical price behavior across annual calendar windows going back up to 30 years. Read the full data methodology or the book The 100-Year Pattern by Afshin Moshrefi (2026 edition). Past performance of seasonal patterns does not guarantee future results. This article is for informational purposes only and does not constitute investment advice.