13-for-13 Midterm Run: Lilly (Eli) (LLY) Averages 15.81% Gains in This 238-Day Window
Lilly (Eli) is heading toward a historically powerful midterm-year seasonal window just as its obesity franchise and fresh UK approval keep the stock pinned near record territory.
Price as of Aug 18, 2026: $1,225.73 (last close).
What is the seasonal pattern for Lilly (Eli) (LLY)?
Lilly (Eli) has risen in 13 of 13 midterm-election-year Aug 31 to Apr 25 windows, with an average gain of 15.81% in winning years.
- 13 for 13 in this window, averaging 15.81% gains in winning years across the last 13 midterm election cycles.
- Percent Profitable is 100%, with 13 winners and 0 losers for a long trade held from Aug 31 through Apr 25.
- The window spans 238 calendar days and aligns with the midterm election year into the following pre-election spring.
- Annualized return for this pattern is 15.59%, with a Sharpe ratio of 1.74 based on end-of-window outcomes.
- The TradeWave Ratio of 2.08 suggests price typically travels meaningfully in the trade direction within the window, beyond just the final close.
- Individual years have seen sizable intraperiod swings, with both strong maximum favorable moves and notable drawdowns before finishing higher.
According to historical data from TradeWave.ai, this midterm-year stretch has behaved very differently from an average calendar window for Lilly (Eli). The next section walks through how that pattern has played out and where the upcoming Aug 31 start date fits into the current setup.
How has Lilly (Eli) (LLY) traded in the Aug–Apr midterm-year window?
Lilly (Eli) has closed higher in every single Aug 31 to Apr 25 midterm-election-year window for the past 13 cycles, averaging gains of 15.81% for a long position. The next 238-day window begins on Aug 31, with shares last changing hands at 1,225.73, up 3.6% on the day and 9.8% year to date. That combination of a clean historical win streak and a stock already near its highs is why this particular LLY seasonal trend is drawing attention ahead of the fall.
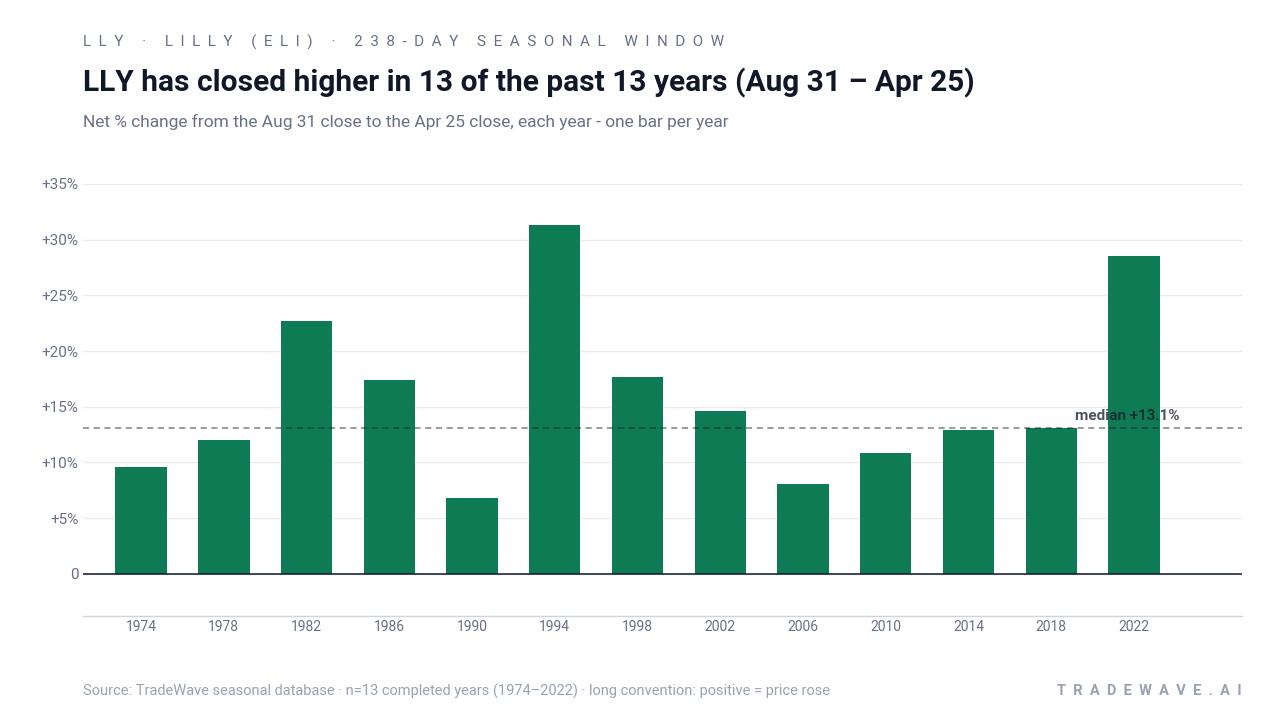
Grouping the data by the presidential election cycle matters here because this window always starts late in the midterm election year and runs into the following pre-election spring, a phase when policy visibility typically improves and risk appetite has often firmed. For a mega-cap healthcare leader tied to obesity and diabetes spending, that backdrop can intersect with fiscal priorities, drug-pricing rhetoric and industrial policy in ways that differ from a generic calendar-year slice.
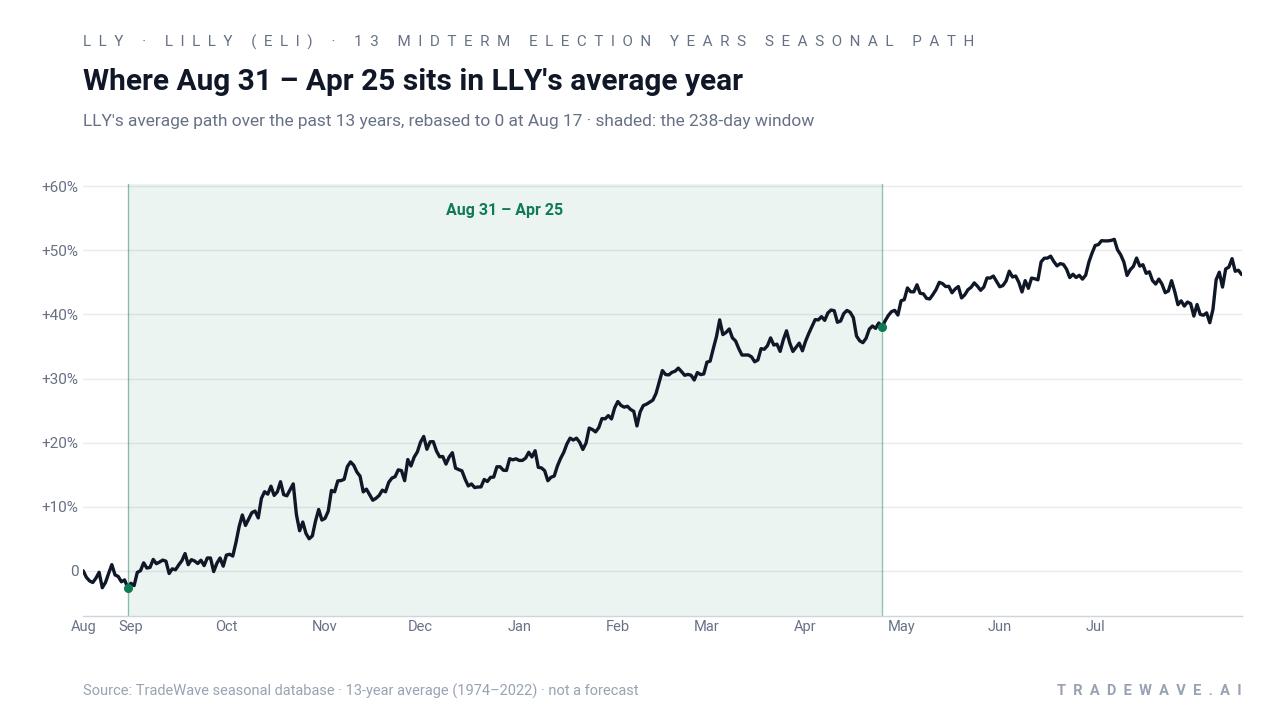
Year-by-year ranges show how much LLY has typically swung inside the window before finishing higher.
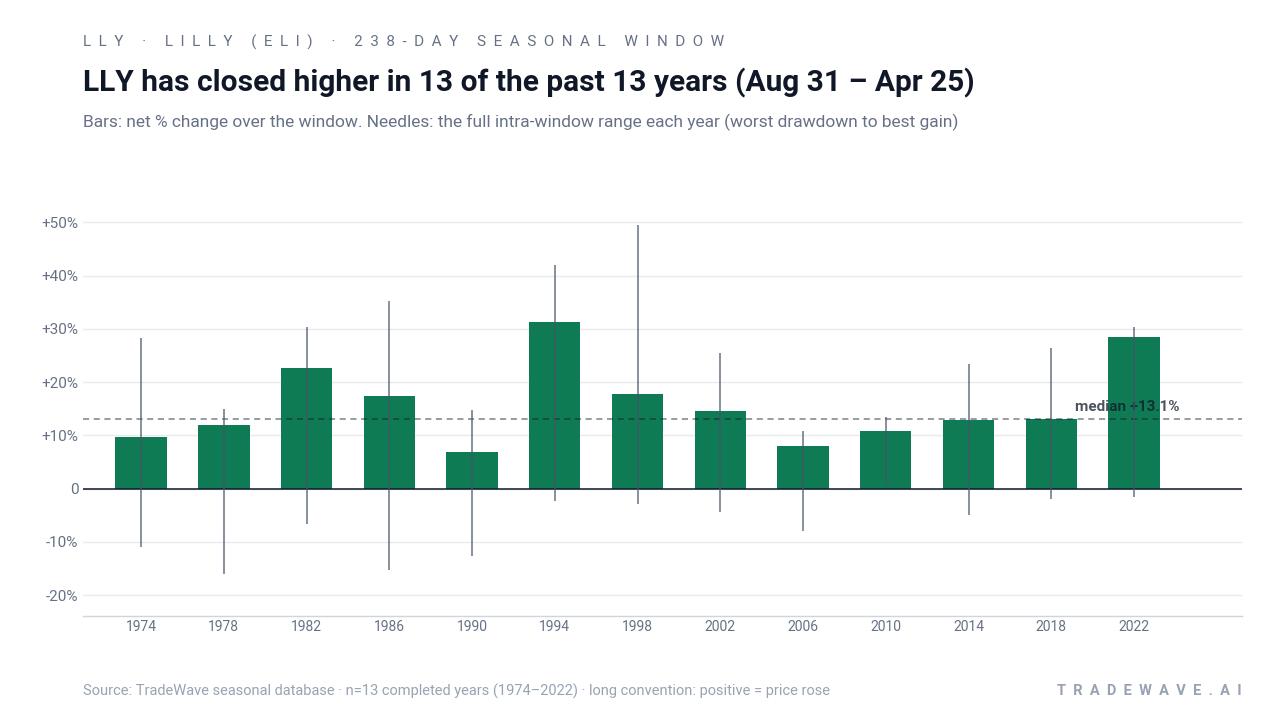
The long-only pattern has been unusually clean. Across the last 13 midterm election years, every Aug 31 entry held through Apr 25 finished in the green, with average gains of 15.81% and a median outcome of 13.08%. Some years, such as 1994 and 2022, delivered net returns above 28%, while softer cycles like 1990 and 2006 still ended positive but in the high single digits.
Intraperiod behavior has not been a straight line. Maximum favorable moves have at times pushed well beyond the final net gain, with several years showing peak run-ups north of 25% before settling back by the close. On the downside, the worst drawdowns from entry have ranged from shallow pullbacks of less than 3% in stronger years to double-digit dips in others, underscoring that even a strong LLY seasonal pattern can involve uncomfortable volatility along the way.
The cumulative chart of this window stacks those 13 cycles into a single line that climbs steadily, compounding to roughly 557% over the full history. That smooth profile contrasts with the choppier behavior LLY has shown in other parts of the election cycle, and it reinforces that this specific midterm-to-pre-election stretch has historically been one of the stock’s most reliable long windows.
History does not guarantee future results; adverse excursions can be large even in winning windows, and investors can still face meaningful drawdowns inside a historically strong pattern.
Why does Lilly (Eli) (LLY) follow this seasonal pattern?
One likely driver is the way Lilly’s earnings calendar and guidance cadence line up with the political cycle, with key obesity and diabetes updates often landing between late summer and early spring when policy visibility improves. Analysts have also pointed to institutional portfolio rebalancing into defensive growth and healthcare ahead of election-year uncertainty, which can favor a GLP-1 leader like Lilly in this midterm-to-pre-election stretch.[3] The pattern may also reflect recurring sector rotation into large-cap pharma as investors look for durable cash flows once early-year macro volatility in midterm years has passed.[7]
What is driving Lilly (Eli) (LLY) today?
Lilly (Eli) shares closed at 1,225.73 on Aug 19, up 3.6% on the session and extending a year-to-date gain of 9.8% as investors digested another round of strong obesity-drug news.[1] The move comes after the company reported Q2 2026 revenues of $22.97 billion, up 48% year over year, with adjusted EPS of $8.38, both comfortably ahead of Wall Street estimates, and raised its full-year sales outlook to a range of $85 billion to $87 billion.[1][3] In the GLP-1 race, prescription data for the week ending Aug 7 showed Foundayo scripts rising 14% to about 38,900 while rival Wegovy prescriptions slipped 5% to roughly 163,000, signaling that Lilly’s oral pill is starting to chip away at Novo Nordisk’s lead in the weight-loss market.[4]
Regulatory momentum has added another leg to the story. On Aug 10, Britain’s Medicines and Healthcare products Regulatory Agency approved Foundayo for both weight management and type 2 diabetes, the first European clearance for the pill across those indications, with a private-prescription launch planned later in August at a price below Mounjaro’s roughly £330 monthly list price.[3][5] At the same time, Lilly has been moving aggressively to protect its pipeline, filing lawsuits on Aug 12 against businesses allegedly selling unauthorized versions of its experimental obesity drug retatrutide, a reminder that legal and safety risks still sit alongside the growth narrative.[2]
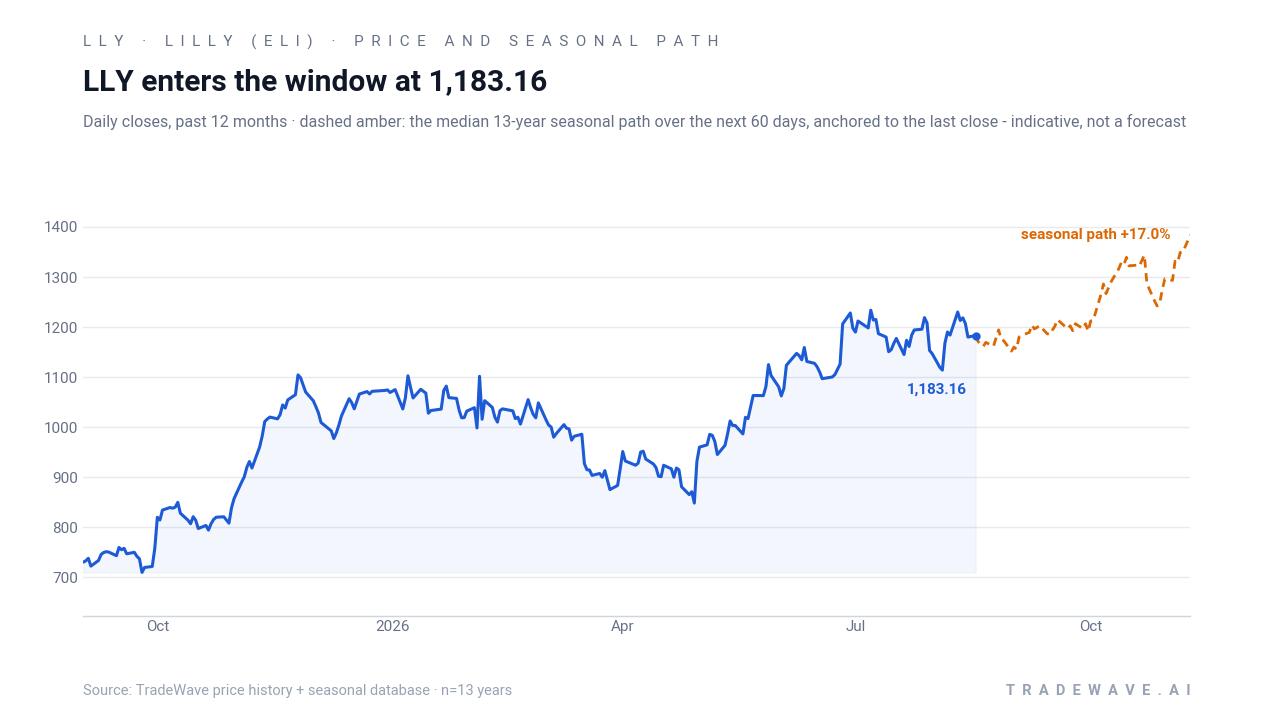
The chart below shows how that mix of earnings beats, obesity-drug traction and legal noise fits into LLY’s recent trading range and the next 60 days of its historical seasonal path.
What should traders watch as this seasonal window approaches?
First, the calendar. The new midterm-year window opens on Aug 31 and runs through Apr 25, so the next two weeks are about positioning rather than pattern execution. How LLY behaves into that start date, especially around any follow-up commentary on Foundayo uptake or additional regulatory decisions, will shape how closely this cycle might rhyme with the prior 13.
Second, levels and volatility. With the stock trading close to its 52-week high and already up high single digits year to date, any pullback into the window would echo prior years where the worst drawdowns arrived early before the longer grind higher. Conversely, a straight-line rally into September would leave less room for error if macro or policy headlines hit a stretched valuation.
Third, the policy and legal backdrop. Lilly’s plan to expand U.S. manufacturing capacity, including six domestic plants highlighted by the White House, ties the company more tightly to industrial and healthcare policy debates that tend to heat up as the election cycle advances.[7] At the same time, the retatrutide lawsuits and ongoing scrutiny of GLP-1 safety and access could inject headline risk into what has historically been a favorable trading window.[2]
Finally, watch whether the fundamental story keeps justifying the seasonal tailwind. If Foundayo’s prescription share continues to climb against Wegovy and management sustains its raised revenue guidance, that would align a powerful LLY seasonal trend with a still-accelerating obesity franchise.[1][3][4] If, instead, prescription growth stalls or legal and pricing pressures intensify, any deviation from the 13-for-13 record in this window would likely show up first in how the stock trades around earnings and major drug updates between late summer and early spring.
Sources
- Zacks / Yahoo Finance - LLY Up Around 6% Post Robust Q2 Results: Buy, Sell or Hold the Stock?
- GuruFocus via Yahoo Finance - Eli Lilly Stock Falls While Retatrutide Lawsuits Expand
- Insider Monkey via Yahoo Finance - Eli Lilly and Company (LLY)’s Weight-Loss Pill Just Won Its First Race in Europe. Novo Nordisk A/S (NVO) Still Has a Head Start
- CNBC - Eli Lilly and J&J bounce on new data, as software gives up gains
- Reuters - Eli Lilly's weight-loss pill secures first European nod in Britain
- ChartMill - LLY Stock Price, Quote & Chart
- Zacks - Eli Lilly Stock Hits Record Highs, Becomes First Pharmaceutical Firm Worth $1 Trillion
About this seasonal analysis
Seasonal pattern data is sourced from TradeWave.ai, which analyzes historical price behavior across annual calendar windows going back up to 30 years. Read the full data methodology or the book The 100-Year Pattern by Afshin Moshrefi (2026 edition). Past performance of seasonal patterns does not guarantee future results. This article is for informational purposes only and does not constitute investment advice.