Ahead of Aug. 17 Earnings, Deere & Company (DE) Enters Its Strongest Midterm-Year Stretch
Deere & Company is approaching a historically powerful Sep-to-July trading window just as shares pull back ahead of earnings, creating a rare clash between short-term nerves and long-term seasonality.
Price as of Aug 18, 2026: $588.72 (last close).
What is the seasonal pattern for Deere & Company (DE)?
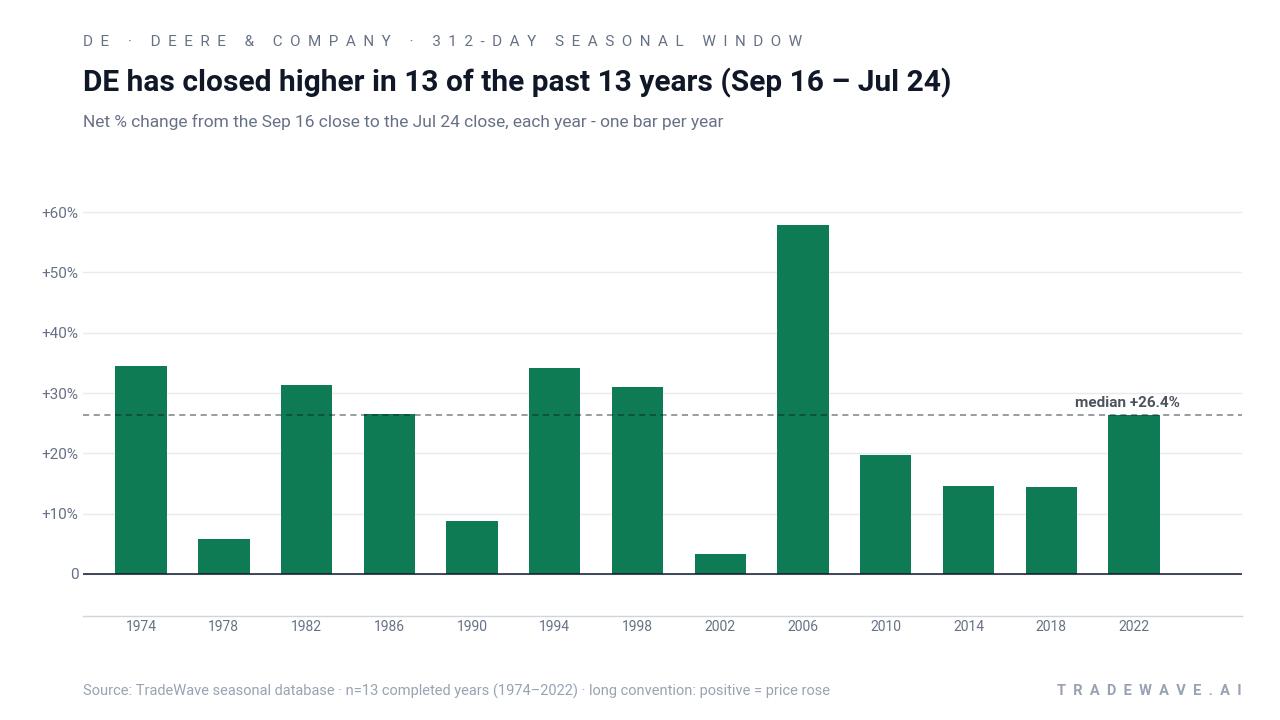
Deere & Company has risen in 13 of 13 midterm-year Sep 16 to Jul 24 windows, with an average gain of 23.7% in winning years.
- 13 for 13 in this window, averaging 23.7% gains in winning years across the last 13 midterm election cycles.
- The upcoming 312-day window runs from Sep 16, 2026 through Jul 24, 2027 and has historically favored long positions in DE.
- Percent Profitable is 100%, with 13 winners and 0 losers over the lookback period.
- Annualized return across those windows is 22.9%, with a Sharpe ratio of 1.36 and a TradeWave Ratio of 1.64.
- Individual years have seen sizable swings, with some windows experiencing double-digit drawdowns before finishing higher.
- Stacked over all cycles, this Deere & Company trading window compounds to a cumulative 1,359% gain.
According to historical data from TradeWave.ai, this midterm-year stretch has behaved very differently from an average calendar year for Deere & Company. The next section walks through how that pattern has played out in past cycles and what it means for the coming 312-day window.
How has Deere & Company (DE) traded in the Sep 16 to Jul 24 midterm-year window?
Deere & Company has posted gains in every single Sep 16 to Jul 24 window across the last 13 midterm election years, averaging a 23.7% rise per cycle. Shares finished Tuesday at 588.72 after a 1.9% drop on the day, leaving the stock about 11.7% below its 52-week high of 666.80.[2] That combination of a flawless historical seasonal record and a pullback from the highs gives this upcoming window unusual weight for traders trying to time entries rather than chase strength.
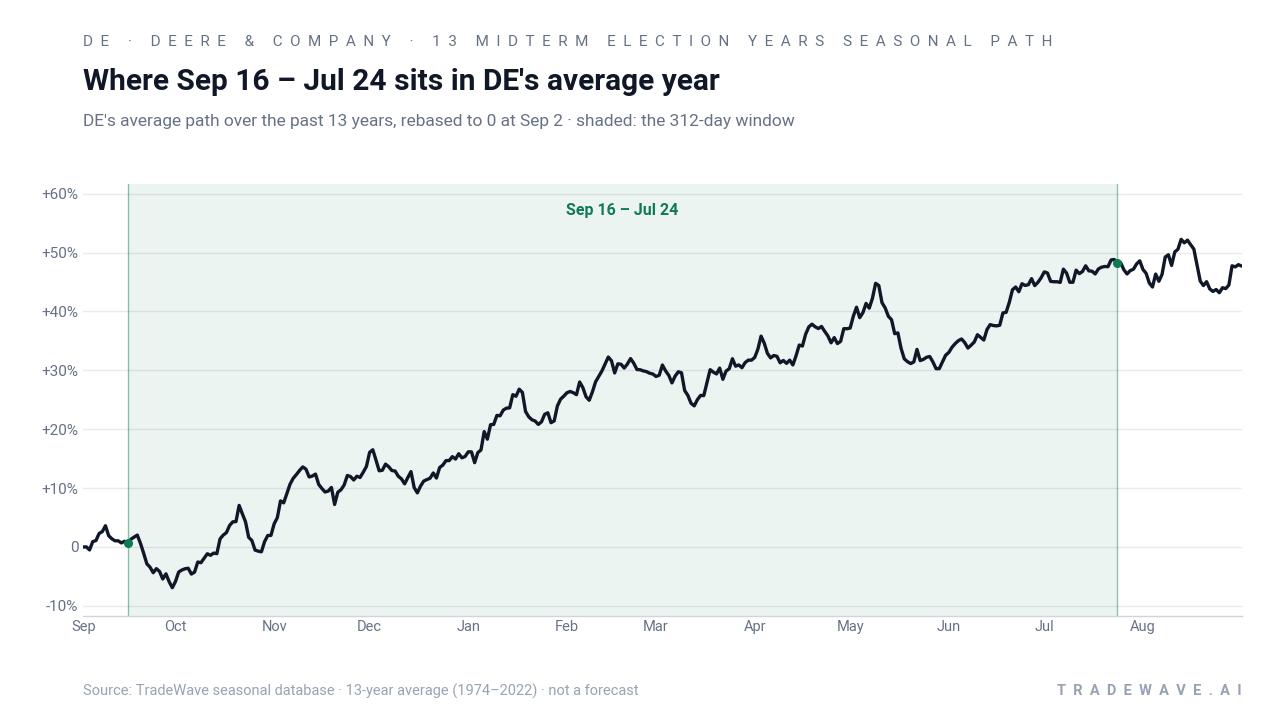
Grouping the data by the presidential election cycle matters here because this window always runs from the heart of a midterm election year into the following pre-election year, a phase that has often coincided with shifting fiscal priorities and infrastructure spending debates in Washington. For a capital-goods name tied to farm and construction budgets, that policy backdrop can be as important as the broader equity tape.
This seasonal window begins on Sep 16, 2026 and spans 312 days, carrying through to late July of the pre-election year. Historically, during this period, Deere & Company has shown a strong upside tendency in midterm election years, with every cycle in the sample finishing higher. The trade direction is long, and the pattern’s 100% Percent Profitable reading reflects 13 winners and 0 losers across the lookback.
The average gain across those winning years is 23.7%, while the median profit is 26.39%, which tells you the typical outcome has been a mid-20s percentage advance rather than a one-off outlier. Annualized, the return profile clocks in at 22.9%, and the Sharpe ratio of 1.36 points to a favorable risk-adjusted record for this specific Deere & Company trading window.
At the extremes, the strongest year in the sample was 2006, when the stock gained 57.81% between the Sep 16 entry and the Jul 24 exit, with a maximum favorable move of 67.79% at the peak and only a 5.36% worst drawdown from entry. The softest outcome was 2002, which still finished up 3.34% but saw a 19.71% adverse move at one point before recovering, underscoring that even “always up” windows can feel rough in real time.
Year-by-year ranges show how much the stock has typically swung inside the window before settling at those positive finishes.
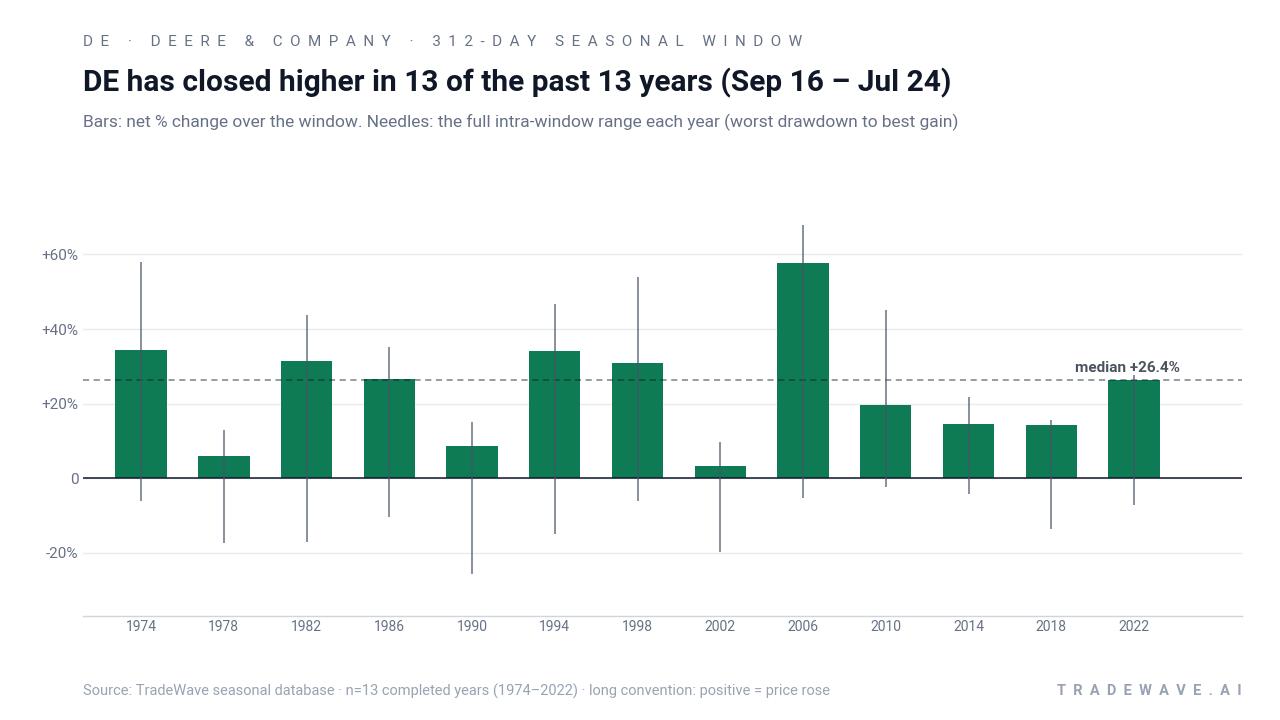
The maximum favorable move, or best run-up from entry, has often been much larger than the final net gain, which is what the TradeWave Ratio of 1.64 is flagging: price has typically traveled meaningfully in the trade direction at some point during the window. At the same time, maximum adverse moves have occasionally reached into the mid-teens or worse, as in 1990 and 2002, so even a historically strong DE seasonal trend has come with real drawdown risk along the way.
The cumulative view is striking. Stacking this 312-day window across the 13 midterm election years compounds to a 1,359% gain, which is what you would have earned by only being exposed to Deere & Company during this specific slice of the calendar and sitting out the rest. Add it up: nine months of midterm-to-pre-election exposure has historically done a lot of the heavy lifting for long-term DE bulls.
History does not guarantee future results; adverse excursions can be large even in winning windows, and past seasonal strength does not ensure similar outcomes in the next cycle.
Why does Deere & Company (DE) follow this seasonal pattern?
One likely driver is the way Deere’s fiscal calendar and order cycle line up with the political calendar, with farm and infrastructure spending decisions often clustering around midterm and pre-election years. Analysts have also pointed to institutional portfolio rebalancing into industrial and machinery names when visibility on policy and capital spending improves late in the presidential cycle. This pattern may reflect that combination of budget cycles and sector rotation more than any single catalyst, which is why the window has repeated across very different macro backdrops.
What is driving Deere & Company (DE) today?
Deere & Company slipped 1.9% to 588.72 on Tuesday, extending a modest pullback from its recent high near 600 and leaving the stock about 11.7% below its 52-week peak of 666.80.[2] The move comes one day before the company’s scheduled earnings report on Aug 20, 2026, which sits on a crowded week for industrial and consumer names and could reset expectations for farm equipment demand and construction spending.[2][3] JPMorgan Chase & Co. recently reiterated a 570 dollar price target, slightly below where the stock now trades, reflecting a more cautious stance that dates from Aug 14 and may not fully capture the latest price regime.[3]
The chart below shows how that pullback fits into DE’s past year of trading, alongside the median 60-day seasonal path for this window.
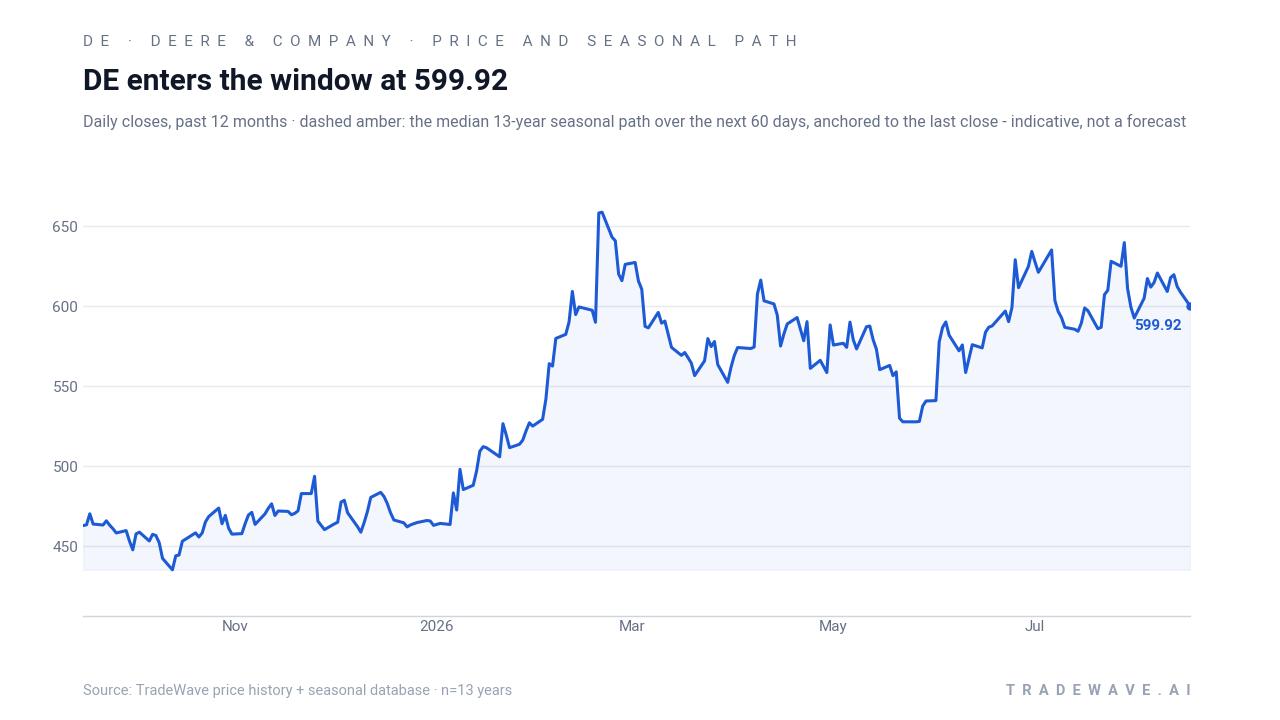
From a sector standpoint, Deere remains a bellwether for agricultural and construction equipment, so its earnings commentary on order books, dealer inventories and farmer sentiment will feed directly into the broader industrial outlook.[2] With no notable insider buying or selling reported in the past three months and no clearly flagged unusual options activity in the available data, positioning looks more driven by fundamental expectations than by a single crowded trade.[1][2] That puts even more focus on how management frames demand into 2027 and whether guidance lines up with the historically strong DE seasonal trend that kicks in next month.
What should traders watch as this Deere & Company seasonal window approaches?
First, the earnings reaction on and after Aug 20 will set the tone heading into the Sep 16 start of the window; a constructive outlook on farm and construction demand would align neatly with the historical midterm-to-pre-election strength.[2][3] Second, price behavior around the 600 level and the 52-week high zone near 667 will matter: in prior cycles, many of the strongest seasonal years saw DE clear resistance early in the window and then grind higher rather than chop sideways.
Third, watch how volatility behaves inside the window relative to history. If the stock starts to show deep intraperiod drawdowns without the kind of strong recoveries seen in past cycles, that would be an early sign that this midterm-year pattern may be weakening. Finally, options and positioning will be worth monitoring after earnings; if open interest and volume begin to cluster in upside calls or downside protection, that shift in risk appetite could either reinforce or contradict the bullish seasonal backdrop, even in the absence of a clearly labeled “unusual” signal in the current data.[1][2]
Sources
About this seasonal analysis
Seasonal pattern data is sourced from TradeWave.ai, which analyzes historical price behavior across annual calendar windows going back up to 30 years. Read the full data methodology or the book The 100-Year Pattern by Afshin Moshrefi (2026 edition). Past performance of seasonal patterns does not guarantee future results. This article is for informational purposes only and does not constitute investment advice.