S&P 500 SPDR (SPY) Has Rallied in Every Aug 6-Jul 29 Midterm Stretch Since 1998
S&P 500 SPDR has just entered a historically powerful 358-day seasonal window as tech-led gains, record highs and higher Treasury yields shape the trading backdrop.

What is the seasonal pattern for S&P 500 SPDR (SPY)?
S&P 500 SPDR has risen in 7 of 7 midterm-year windows starting Aug 6, with an average gain of 15.56% in winning years.
- 7 for 7 in this window, with S&P 500 SPDR averaging 15.56% gains across all winning years.
- Seasonal window runs from Aug 6 through Jul 29, spanning 358 days in the last 7 midterm election years.
- Percent Profitable is 100%, with 7 winners and 0 losers across the historical sample.
- Annualized return for the window is 15.46%, compounding to a 173% cumulative gain over the seven completed cycles.
- TradeWave Ratio of 1.85 signals that price has typically traveled meaningfully in the long direction within the window.
- Sharpe ratio of 2.16 points to a historically strong risk-adjusted profile for this SPY seasonal trend.
According to historical data from TradeWave.ai, this midterm-year stretch has behaved very differently from an average year for SPY. The next section walks through how that long seasonal regime has lined up with past market cycles.
How has S&P 500 SPDR (SPY) traded in this midterm-year window?
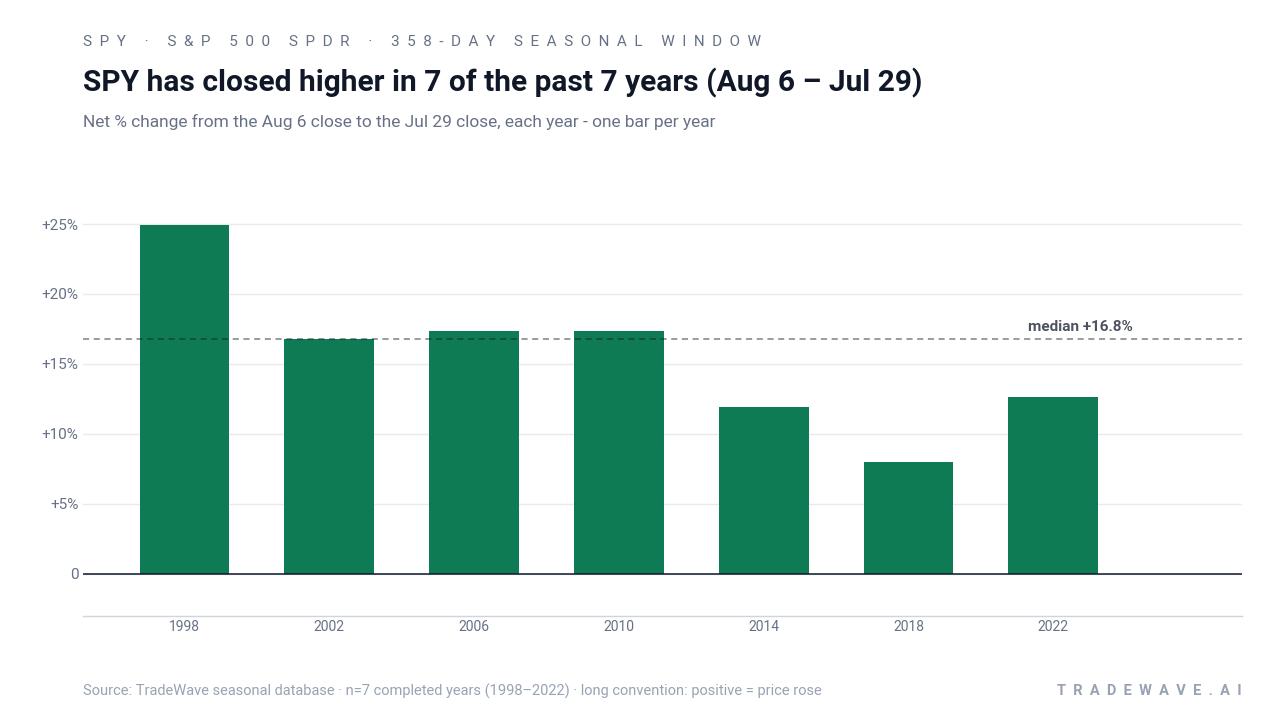
S&P 500 SPDR has finished higher in every single Aug 6 to Jul 29 midterm-year window since 1998, averaging gains of 15.56% across seven cycles. The latest iteration of this 358-day stretch began on Aug 6, with SPY entering the window near its prior-session close of 775.85 and sitting about 0.1% below its 52-week high of 776.85.[11] For a benchmark ETF that anchors global risk sentiment, a clean 7-for-7 record in a window this long is rare and puts a bright seasonal spotlight on the year ahead.
Grouping the data by the presidential election cycle matters here because this window always runs from the heart of a midterm election year into the year before the presidential election. That is typically when Washington policy uncertainty starts to fade and risk appetite rebuilds, a backdrop that has often lined up with stronger S&P 500 performance.
Across the seven completed midterm-year samples, SPY’s annualized return in this window clocks in at 15.46%, with a 173% cumulative gain if you hypothetically stacked each Aug 6 to Jul 29 stretch back-to-back. The median outcome is a 16.76% rise, so the pattern is not just skewed by one outlier year. The weakest gain in the set is still an 8.0% advance in 2018, while the strongest is a 24.9% jump in 1998.
Trade direction for this pattern is explicitly long, and every historical year has been a “favorable” one for that stance. Average winners gained 15.56%, and because there were no losing years in the sample, that figure is identical to the all-years average. For a broad index ETF, that kind of consistency across different macro regimes, from the late-1990s boom to the post-pandemic cycle, stands out.
Intraperiod swings have still been meaningful. In the best years, the maximum favorable move, or peak run-up from the Aug 6 entry, reached as high as 32.19% in 1998 and 23.89% in 2010. On the downside, the worst drawdowns from entry, known as maximum adverse excursions, ranged from a relatively shallow -1.27% in 2006 to deeper dips of -17.02% in 2018 and -15.36% in 2022, even though those windows ultimately finished in the green.
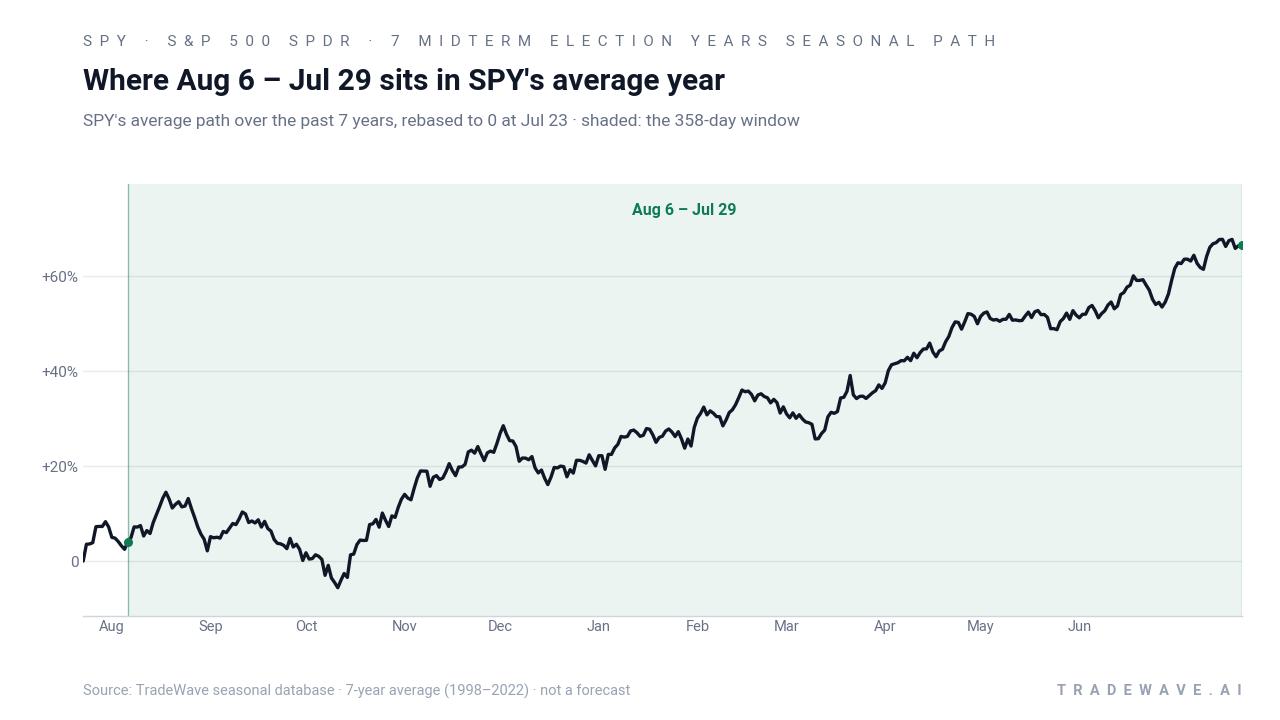
The historical seasonal average shows SPY grinding higher through much of this 358-day span, with gains tending to build rather than spike in a single burst. That fits the idea of a long regime shift from midterm-year volatility into the more traditionally supportive year before the presidential election.
A closer look at each year’s full intraperiod range shows how upside and downside have traded off inside the window.
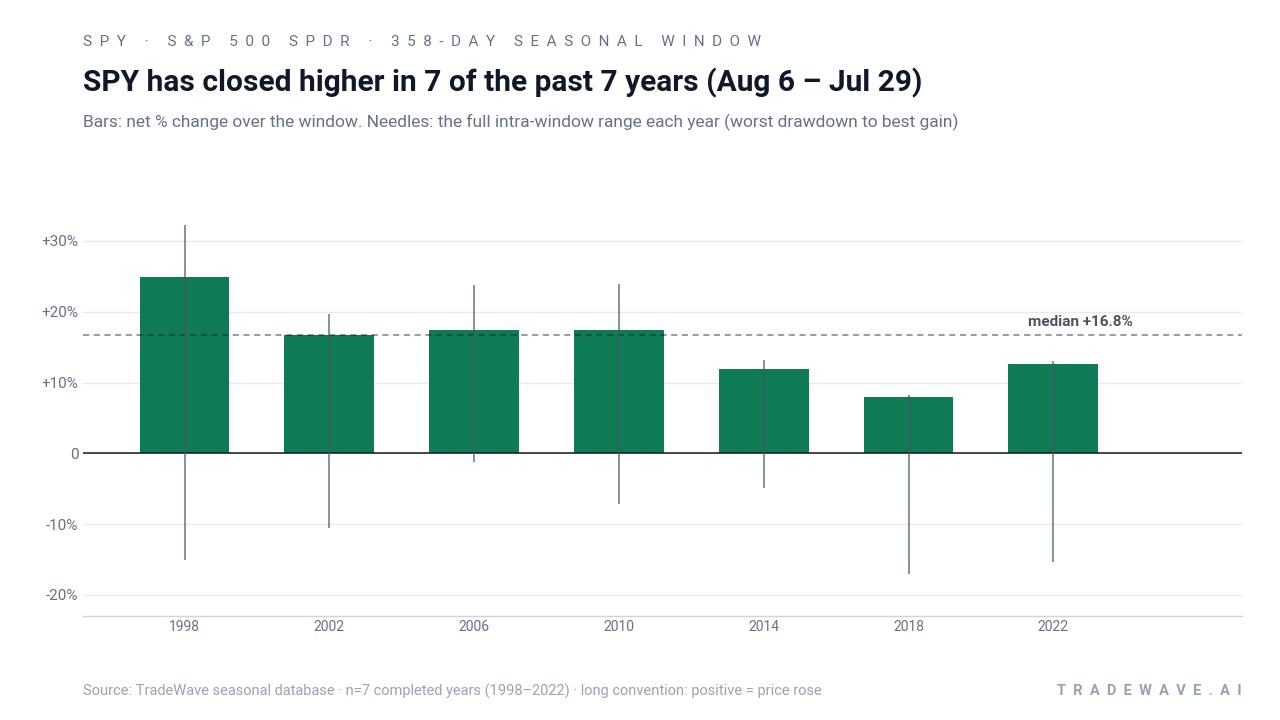
The stacked net, best-case and worst-case profile shows a clear pattern: every bar ends above zero, but the needles stretch meaningfully in both directions. Years like 2018 and 2022 combined double-digit drawdowns with double-digit rallies before finishing with moderate gains, while 2006 delivered a smoother path with limited downside and a strong final result. Add it up and you get a window that has favored longs historically, but has not spared them from volatility along the way.
History does not guarantee future results; adverse excursions (MAE) can be large even in winning windows.
Why does S&P 500 SPDR (SPY) follow this seasonal pattern?
This pattern may reflect how the presidential election cycle shapes risk appetite, with midterm-year policy uncertainty giving way to a more supportive backdrop as the year before the presidential election unfolds. Analysts often point to a mix of factors, including fiscal and regulatory clarity, improving earnings visibility and institutional portfolio rebalancing into equities as the policy path firms up. The long Aug-to-July window also captures key earnings seasons and year-end positioning, which can reinforce a pro-risk tilt when macro conditions are stable enough.
What is driving S&P 500 SPDR (SPY) today?
SPY comes into this midterm-year window with the S&P 500 sitting near record territory, helped by strong technology earnings and resilient index-level profit growth. In early August, futures tied to the Dow, S&P 500 and Nasdaq were reported higher as investors braced for another heavy week of corporate results, with roughly 71% of S&P 500 companies already having posted Q2 numbers and another 15% still to report, keeping index-level earnings revisions in focus.[2]
Tech has been doing much of the heavy lifting. On Aug 4, coverage of the S&P 500’s latest record high highlighted strong technology earnings as a key driver, reinforcing the idea that megacap growth names remain central to SPY’s performance profile in this phase of the cycle.[10] That sector concentration cuts both ways: it has powered the ETF higher into the seasonal window, but it also leaves the tape sensitive to any wobble in a handful of dominant stocks.
Macro conditions are not exactly calm in the background. Around Aug 3, 10-year Treasury yields were cited near 4.696%, with rising yields and geopolitical headlines both flagged as market-moving forces for index futures, including SPY.[2] Higher real yields can pressure equity valuations, especially for long-duration growth names, even as strong earnings help offset some of that drag.
Flows and positioning have been supportive as well. SPY was mentioned among benchmark ETFs that edged higher in the futures and overnight session, and it appeared on options and ETF activity lists, suggesting traders are actively using the fund to express macro views around earnings and rates.[2] For a vehicle that already dominates index-tracking flows, that extra layer of options and futures activity can amplify intraday swings as the seasonal window unfolds.
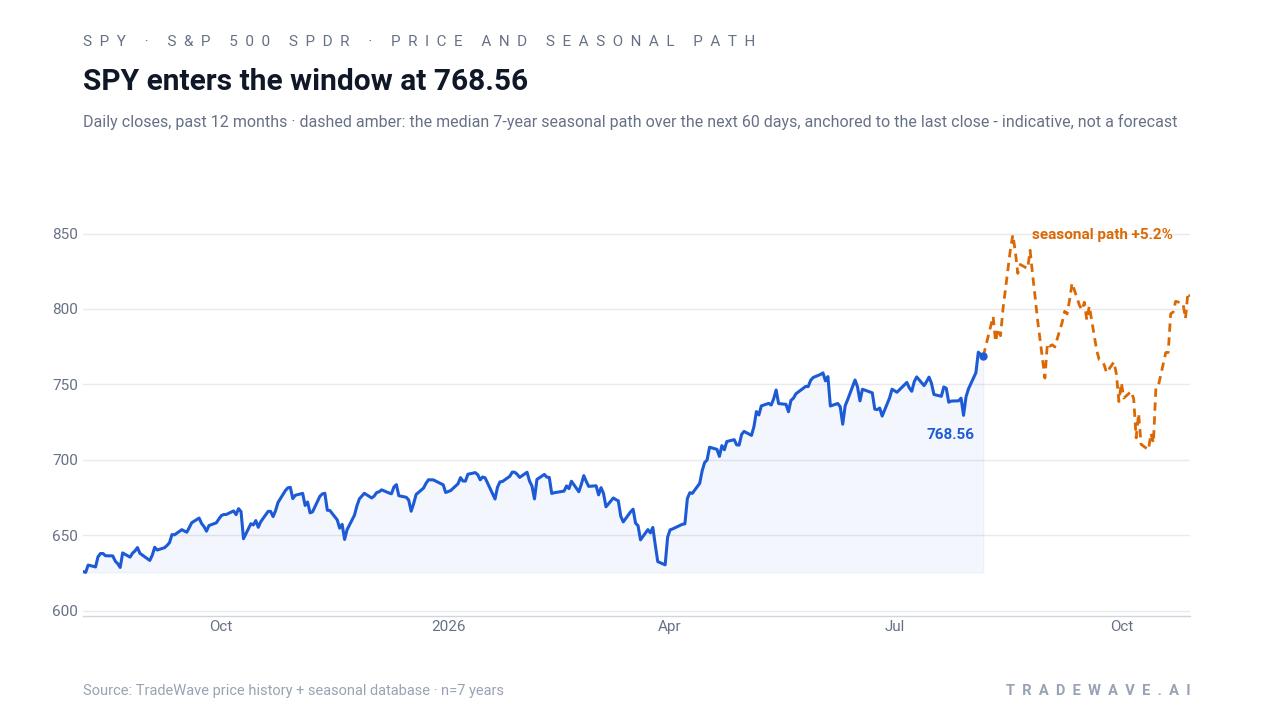
The chart below situates the latest move in its recent multi-month context and overlays the median seasonal path for the next 60 days.
What should traders watch in this SPY seasonal window?
First, watch how SPY behaves relative to its 52-week high zone around 776.85 as the window gets going.[11] In prior cycles, the strongest years often saw the ETF consolidate near highs before grinding higher, while choppier years featured deeper drawdowns early in the stretch before recovering.
Second, keep an eye on the earnings tape and guidance from the remaining S&P 500 companies reporting Q2 results, since those updates will help determine whether the current profit cycle can sustain the kind of double-digit gains seen in past midterm-to-pre-election windows.[2] Any broad-based deterioration in earnings breadth would be a clear break from the historical pattern that has underpinned this seasonal strength.
Third, monitor the interaction between tech leadership and Treasury yields. If strong technology earnings continue to offset the drag from higher long-term rates, SPY could track closer to its historical seasonal trend; if yields push higher without a matching earnings cushion, the ETF’s path through this window could look more like the volatile 2018 and 2022 samples, where large intraperiod drawdowns accompanied ultimately positive outcomes.[2][10]
Finally, watch ETF and options activity in SPY itself. The fund’s presence on futures and options lists around the latest earnings week suggests traders are leaning on it as a primary macro instrument.[2] If that activity builds as the calendar moves deeper into the midterm year and toward the year before the presidential election, it could either reinforce the historical upside bias or, if flows turn defensive, mark an early sign that this cycle may diverge from the 7-for-7 record.
Sources
- Yahoo Finance: Dow, S&P 500, Nasdaq Futures Climb As Markets Gear Up For Another Key Earnings Week: USO, PLTR, CRML, IONQ Stocks In Focus (Aug 3, 2026)
- Barchart: S&P 500 Posts a New Record High on Strong Tech Earnings (Aug 4, 2026)
- Yahoo Finance: State Street SPDR S&P 500 ETF Trust (SPY) Stock Price, News, Quote & ... (Aug 6, 2026)
About this seasonal analysis
Seasonal pattern data is sourced from TradeWave.ai, which analyzes historical price behavior across annual calendar windows going back up to 30 years. Read the full data methodology or the book The 100-Year Pattern by Afshin Moshrefi (2026 edition). Past performance of seasonal patterns does not guarantee future results. This article is for informational purposes only and does not constitute investment advice.