Marriott International (MAR) Faces Middle East Hit as 7-for-7 Midterm Rally Window Nears
Marriott International is approaching a historically powerful 319-day seasonal window even as the stock trades well below its 52-week high after a sharp post-earnings pullback and geopolitical pressure on travel.
Price as of Aug 7, 2026: $353.91 (last close).

What is the seasonal pattern for Marriott International (MAR)?
Marriott International has risen in 7 of 7 midterm-year windows starting Aug 28, with an average gain of 18.69% in winning years.
- 7 for 7 in this window, averaging 18.69% gains in winning years across the last 7 midterm election cycles.
- Seasonal window runs 319 days from Aug 28 to Jul 12, covering late-summer travel, the holiday period and the following spring.
- Percent Profitable is 100%, with 7 winners and 0 losers in the historical sample.
- Average profit of 18.69% in winning years, with a cumulative return of 230% when stacking the window across all cycles.
- TradeWave Ratio (TWR) of 2.44 and a Sharpe ratio of 3.76 point to strong, historically consistent upside in this MAR seasonal trend.
- Individual years have still seen sizable drawdowns inside the window, so intraperiod volatility has been meaningful even in ultimately positive seasons.
According to historical data from TradeWave.ai, this midterm-year stretch for Marriott International has behaved very differently from an average calendar year, with a distinct pattern that shows up when you line up past cycles by the election clock rather than the standard January-to-December view.
How strong is the upcoming seasonal window for Marriott International (MAR)?
Marriott International has risen in 7 of the last 7 midterm election years during the 319-day window that begins on Aug 28, averaging 18.69% gains and compounding to 230% across those cycles. Shares finished Monday at 353.91, down 1.6% on the day and about 13.9% below their 52-week high of 410.98, leaving room above if the historical pattern reasserts.
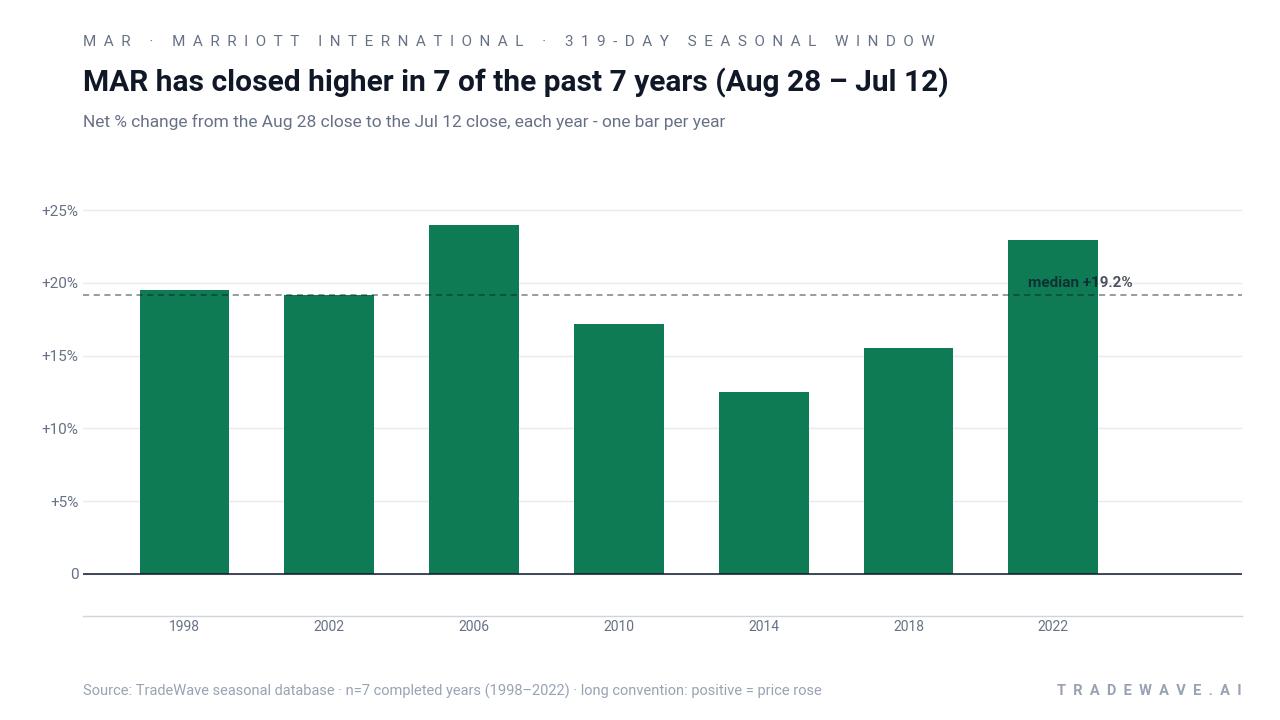
Grouping the data by the presidential election cycle matters here because this window spans late in the midterm election year into the following pre-election year, a phase when policy uncertainty often fades and risk appetite in cyclicals like hotels has historically improved. In this MAR seasonal trend, the trade direction is long, and every one of the seven midterm-year samples from 1998 through 2022 finished the window in positive territory.
Across those years, the average profit of 18.69% sits close to the median outcome of 19.16%, which suggests the distribution of returns has been tight rather than skewed by a single outlier. The weakest net gain in the sample was 12.49% in 2014, while the strongest was 23.96% in 2006, so even the “soft” years in this Marriott International trading window still delivered double-digit gains.
The intraperiod path has not been a straight line. In 1998, for example, the stock’s best point-to-peak move inside the window reached 42.85% while the worst drawdown from entry hit -38.0%, a reminder that large swings can occur even in seasons that ultimately finish higher. By contrast, 2006 saw a similar 42.89% maximum favorable move with only a -0.6% worst drawdown, showing how benign some cycles have been.
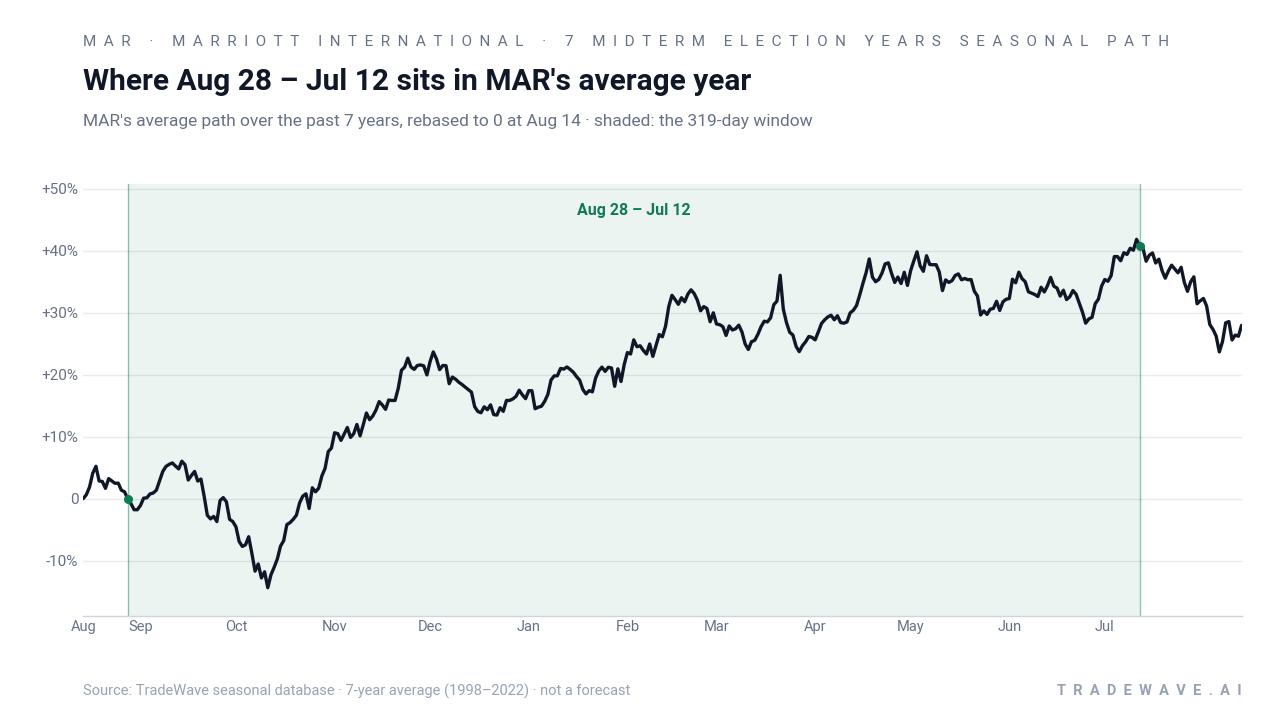
A closer look at yearly ranges shows how upside and downside have played out inside this historically bullish stretch.
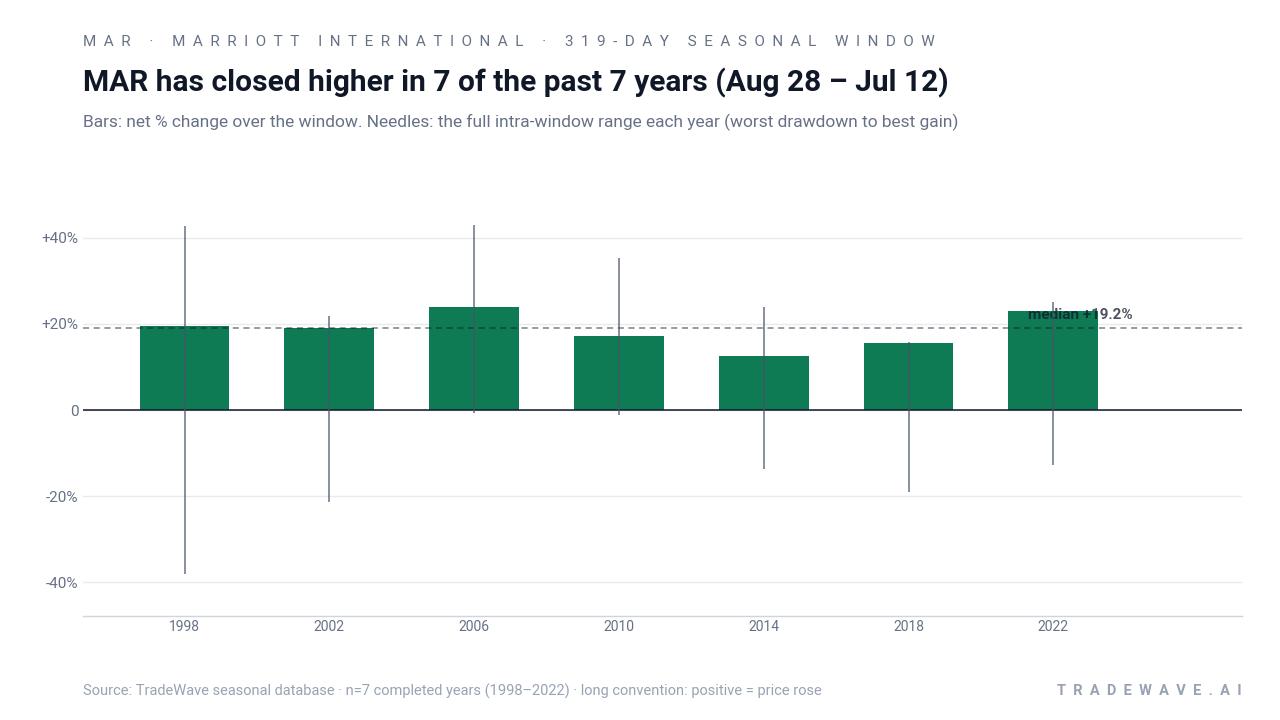
The bar-and-range profile shows that while every bar is positive, the needles extend meaningfully both above and below the final result, reflecting robust maximum favorable moves and sometimes deep maximum adverse moves. In 2018, for instance, Marriott International finished the window up 15.54%, yet the worst drawdown reached -19.01% and the best intraperiod gain topped out at 15.83%, underscoring how choppy a “winning” year can feel in real time.
Stacking the window year after year compounds to a 230% cumulative gain across the seven midterm election years in the sample, which is unusually strong for a single recurring slice of the calendar. The Sharpe ratio of 3.76 for this window, based on end-of-window outcomes, points to a historically favorable risk-adjusted profile compared with many other long seasonal regimes.
Put simply, this has been a powerful long-only seasonal window for Marriott International: seven for seven, double-digit average gains, and a track record that spans very different macro backdrops from the late 1990s through the post-pandemic cycle. History does not guarantee a repeat, but the consistency across midterm election years is hard to ignore.
Why does Marriott International (MAR) follow this seasonal pattern?
One likely driver is the way hotel demand and corporate travel budgets line up with the policy calendar, as midterm election uncertainty tends to fade into the following pre-election year and companies lock in spending plans. Analysts have also pointed to consumer spending cycles, with late-summer vacations, the holiday season and spring travel all falling inside this Aug 28 – Jul 12 window for a global hotel chain like Marriott. The pattern may also reflect institutional portfolio repositioning around midterm-year volatility, with investors rotating back into cyclical travel and lodging names as macro visibility improves.
History does not guarantee future results; adverse excursions can be large even in winning windows, and traders should treat this seasonal pattern as context rather than a forecast.
What is driving Marriott International (MAR) today?
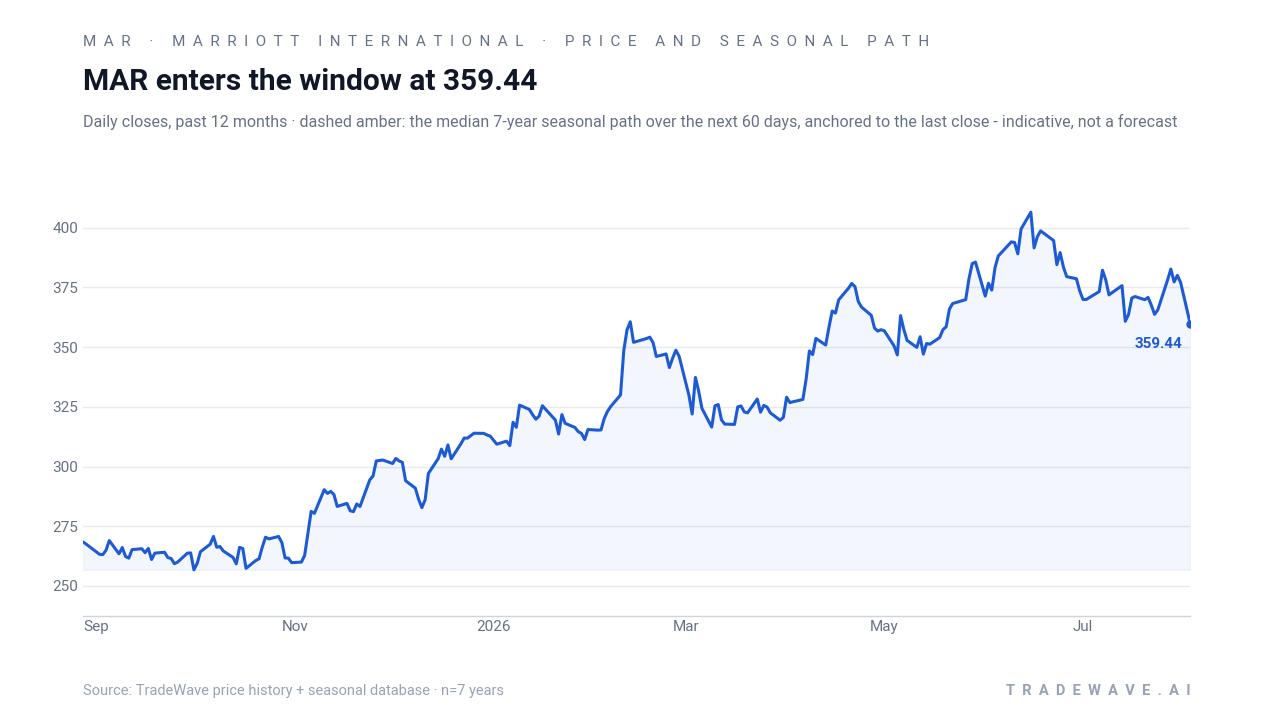
Marriott International closed Monday at 353.91, down 1.6% on the session and roughly 13.9% below its 52-week high of 410.98, after a volatile stretch that included a sharp post-earnings drop and heavier-than-usual trading around the release. The stock’s one-month return sits at -5.9%, and it is trading below its 50-day moving average of 376.89 on volume that has recently run above the 20-day average of about 1.69 million shares, reflecting a market still digesting new information.
The latest catalyst was the company’s Aug 3 Q2 2026 earnings report, where management said the conflict in the Middle East significantly weighed on sales and international revenue per available room, with regional RevPAR down 43% and the biggest hit expected in the fiscal fourth-quarter peak season.[1][2] Marriott also guided third-quarter adjusted EPS to a range of $2.74 to $2.82, below the $2.88 consensus cited in market commentary, which helped trigger a roughly 7% post-earnings slide as investors recalibrated growth expectations.[1][10]
Sector commentary points to mixed leisure demand into the summer for hotel owners, with strength in some markets offset by softness in regions directly exposed to geopolitical risk.[9] For Marriott, that means a solid core business but a meaningful drag from the Middle East, where travel disruptions and slower construction of new hotels have become a headwind.[2] Against that backdrop, the upcoming MAR seasonal trend window is notable because it historically spans both the company’s peak travel season and the period when policy and rate uncertainty in a midterm election year often begins to ease.
MarketBeat’s recent summary also flagged insider activity skewed toward selling rather than buying, a detail that has added to investor caution after the stock’s massive rally earlier in the year.[10] Combined with the earnings miss versus expectations and the geopolitical overhang, that positioning helps explain why MAR is consolidating below its highs even as Wall Street commentary earlier in 2026 framed the name constructively with a consensus price target around 372.08, a level now only modestly above the current quote.[10][11]
The chart below situates the latest pullback against the past year’s rally and overlays the median 60-day seasonal path for context.
What should traders watch as this Marriott International (MAR) window approaches?
First, the calendar: the 319-day window opens on Aug 28 and runs through Jul 12, so any shift in price behavior as the stock moves into late August will be watched closely against the historical pattern. Traders will be looking to see whether MAR can reclaim its 50-day moving average and start closing the gap toward the 372 area and beyond, or whether the post-earnings downtrend persists into the start of the window.
Second, the macro and policy backdrop: this is the midterm election year, and the window extends into the pre-election year, a phase that has often coincided with friendlier conditions for cyclical sectors when rate paths and fiscal plans become clearer. Any easing of geopolitical tensions in the Middle East or signs that travel demand in the region is stabilizing would be especially important for Marriott, given management’s warning that the biggest RevPAR hit may come in its fiscal fourth quarter.[1][2]
Third, the intraperiod volatility profile: past cycles show that even winning years have seen double-digit drawdowns inside the window, so traders may focus on how MAR behaves on pullbacks. If dips remain shallower than the worst historical maximum adverse moves and are met with strong buying, that would be more consistent with the bullish seasonal template. Conversely, a deeper or more persistent slide would mark a clear break from the historical MAR seasonal trend.
Finally, positioning and sentiment: the earlier note of insider selling and the heavy post-earnings reaction suggest investors are already more cautious than they were earlier in 2026.[10] Watching whether volume remains elevated on down days, or instead shifts toward accumulation as the window opens, will help show whether the market is leaning with or against a seasonal pattern that has, so far, been seven for seven.
Sources
- Seeking Alpha – Marriott International, Inc. (MAR) Q2 2026 Earnings Call Transcript (Aug 3, 2026)
- The Wall Street Journal – Marriott Says Middle East Conflict Weighed on Sales (Aug 3, 2026)
- MarketBeat – Marriott International, Inc. $MAR Shares Purchased by Eastern Bank (Aug 4, 2026)
- Barchart – Marriott International Stock Outlook: Is Wall Street Bullish or Bearish? (May 19, 2026)
About this seasonal analysis
Seasonal pattern data is sourced from TradeWave.ai, which analyzes historical price behavior across annual calendar windows going back up to 30 years. Read the full data methodology or the book The 100-Year Pattern by Afshin Moshrefi (2026 edition). Past performance of seasonal patterns does not guarantee future results. This article is for informational purposes only and does not constitute investment advice.