9-for-9 Midterm Run: Nasdaq 100 (NDX) Has Averaged 35.13% Gains in This 300-Day Window
Nasdaq 100 is entering a 300-day midterm-to-pre-election seasonal window that has never finished lower in the past nine cycles, even as the index trades just off record highs.
Price as of Sep 22, 2026: $30,732.40 (last close).

What is the seasonal pattern for Nasdaq 100 (NDX)?
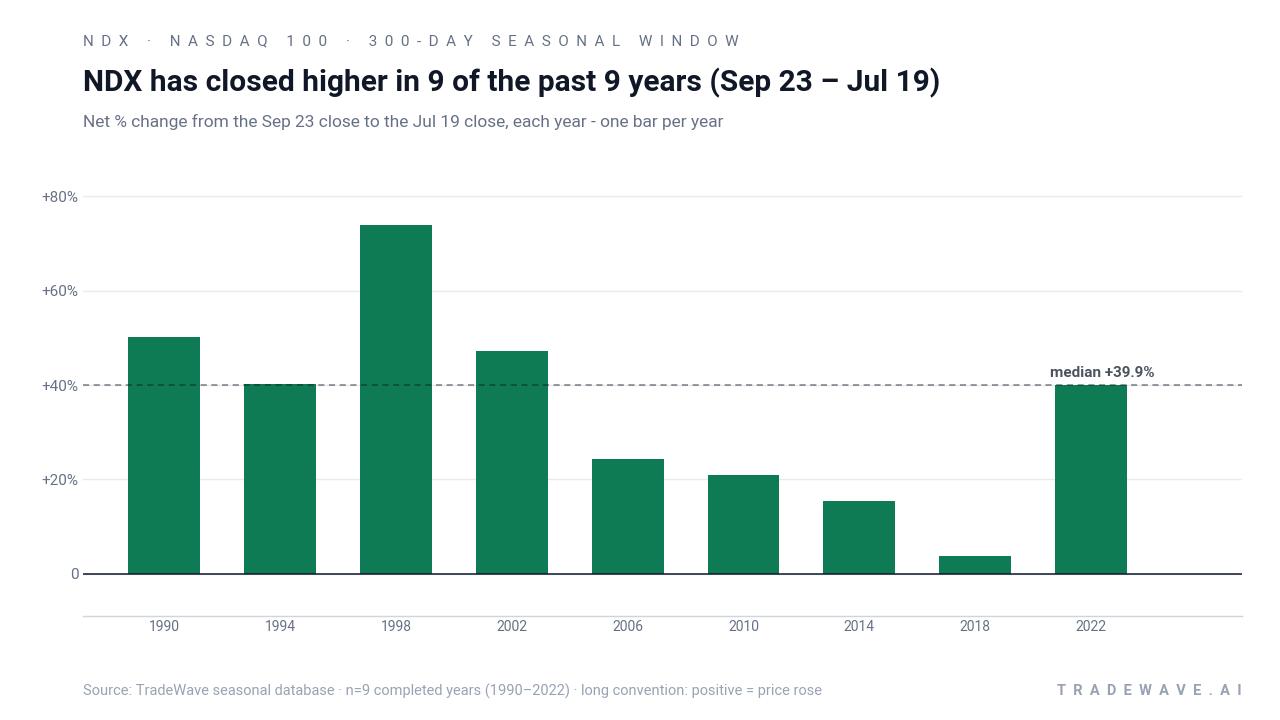
Nasdaq 100 has risen in 9 of 9 midterm-to-pre-election 300-day windows starting Sep 23, with an average gain of 35.13% in winning years.
- 9 for 9 in this window, with winning years averaging 35.13% gains from Sep 23 to roughly Jul 19.
- Percent Profitable is 100.0%, with 9 winners and 0 losers across the last nine midterm election years.
- Trade Direction is long, aligning with a cumulative return of 1261.2% when stacking the window across all cycles.
- Median profit of 39.92% shows that typical outcomes have skewed strongly positive, not just a few outliers.
- TradeWave Ratio of 1.52 indicates price has historically traveled meaningfully in the trade direction within the window.
- Sharpe ratio of 1.5 reflects a historically favorable risk-adjusted profile for this specific Nasdaq 100 trading window.
According to historical data from TradeWave.ai, this midterm-to-pre-election stretch has behaved very differently from an average year for the Nasdaq 100. The next section walks through how that pattern has played out across prior cycles and what it means for the window that opens today.
How has Nasdaq 100 (NDX) traded in the midterm-to-pre-election window?
Nasdaq 100 has closed higher in every single 300-day window starting Sep 23 of the last nine midterm election years, averaging 35.13% gains with no losing cycles. The index enters this latest iteration at 30,732.40, up 0.8% on the day and sitting about 0.1% below its 52-week high of 30,770.63. That combination of a powerful historical seasonality and an index already near record territory gives this year’s window unusual weight for anyone watching tech-led risk assets.
Grouping the data by the presidential election cycle matters here because this window always starts in the late part of a midterm election year and runs deep into the year before the presidential election, a phase that has often coincided with friendlier policy tone and risk-on positioning. In other words, this is not just a generic “October through summer” pattern; it is a specific midterm-to-pre-election regime that has repeatedly lined up with improving earnings visibility and looser financial conditions.
Across the nine completed cycles since 1990, every Sep 23 entry and roughly Jul 19 exit produced a positive net return for a long NDX position. The strongest year in this sample was 1998, when the index gained 73.85% over the window, while the softest was 2018, which still finished up 3.79% despite a deep drawdown along the way. That consistency is unusual for any index, let alone a tech-heavy benchmark that has lived through the dot-com bust, the global financial crisis and a pandemic era.
The average winner’s gain of 35.13% sits close to the median outcome of 39.92%, which tells you the pattern is not being skewed by a single bubble year. Instead, several cycles have delivered chunky double-digit returns, including 50.29% in 1990, 47.17% in 2002 and 40.22% in 1994. Even the more modest 15.5% and 20.99% gains in 2014 and 2010 would look attractive in most macro environments.
Intraperiod swings have been meaningful. Maximum favorable excursions, or the best point-to-peak moves within each window, have ranged from 5.58% in 2018 to 76.99% in 1998. Maximum adverse excursions, the worst drawdowns from entry, have stretched as far as -23.76% in 1998 and -21.91% in 2018, showing that even winning years have tested long holders before finishing higher. That is where the TradeWave Ratio of 1.52 and a Sharpe ratio of 1.5 help frame the risk-reward: historically, the upside travel has outweighed the downside, but the ride has not been smooth.
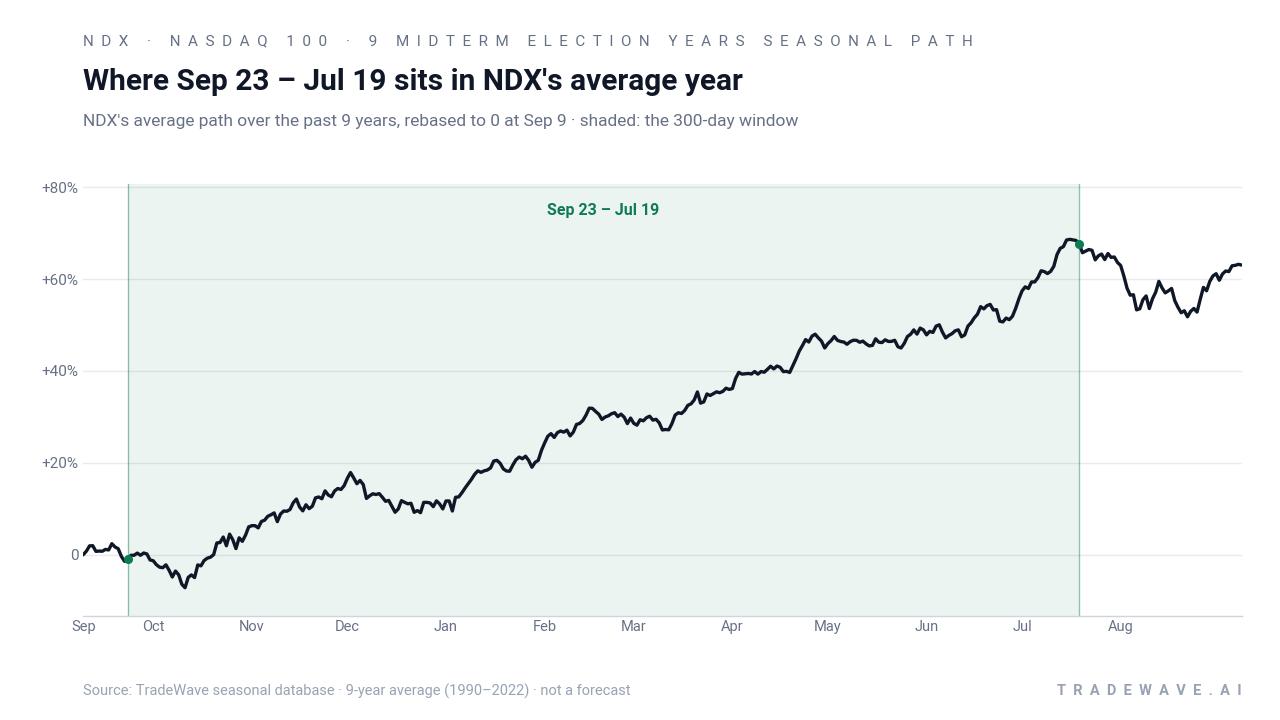
Year-by-year ranges show how those pullbacks and rallies have stacked up inside the window.
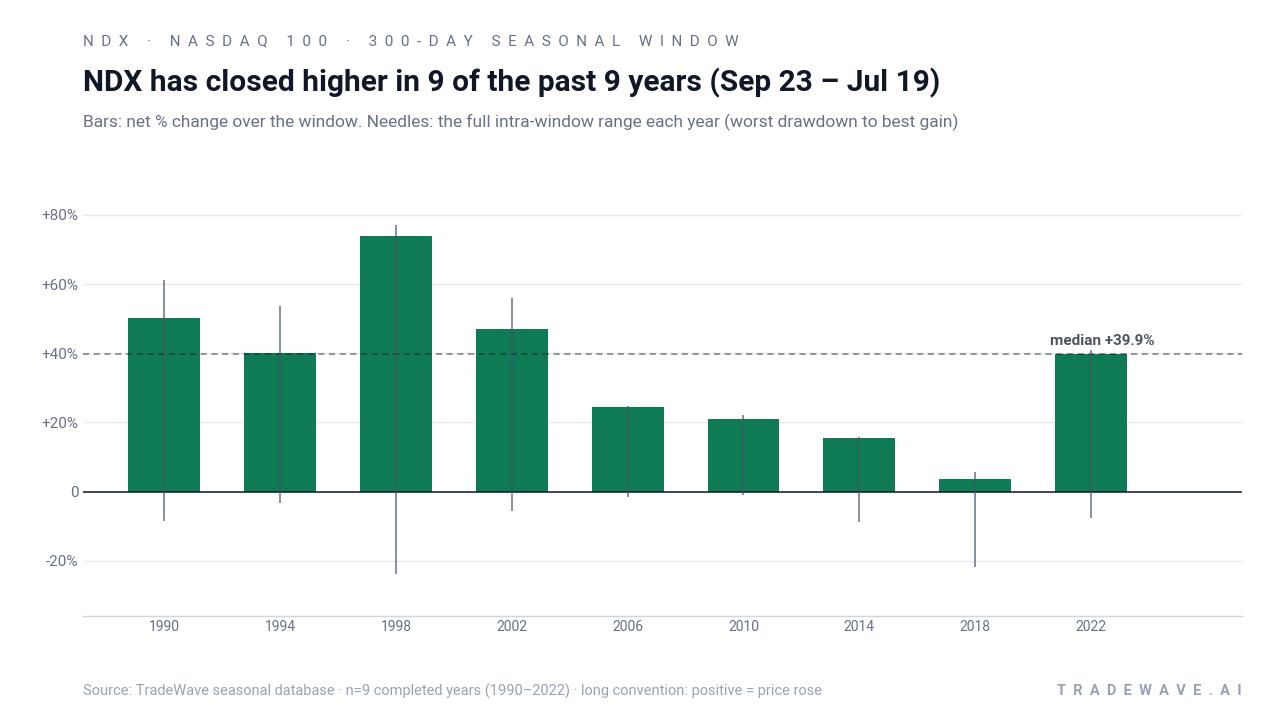
The stacked net, drawdown and rally bars show a clear pattern: every bar ends above zero, but the needles often extend far below and above, capturing swings that long investors had to sit through. In 2018, for example, NDX suffered a drawdown of -21.91% at one point before recovering to finish the window modestly higher, while 1998 combined a -23.76% dip with a 76.99% peak gain. Add it up and you get a 1261.2% cumulative return if you had only been exposed during these nine windows, but also a history of sharp air pockets along the way.
History does not guarantee future results; adverse excursions can be large even in winning windows, and past seasonality does not ensure similar outcomes in any single year.
Why does Nasdaq 100 (NDX) follow this seasonal pattern?
One likely driver is the way the earnings calendar and policy cycle line up between late midterm years and the year before the presidential election, a phase that has often featured improving earnings visibility and less policy uncertainty. Analysts have also pointed to institutional portfolio repositioning after midterm volatility, with large allocators rotating back into growth and technology as macro risks clear. The pattern may also reflect how tech-heavy benchmarks respond when consumer and corporate spending pick up into the following summer, reinforcing a risk-on backdrop that has historically favored NDX in this window.
What is driving Nasdaq 100 (NDX) today?
Nasdaq 100 finished the prior session at 30,732.40, up 0.8% on the day, and is trading essentially at its 52-week high of 30,770.63 while sitting well above its 50-day moving average of 29,218.49. The index has climbed 5.89% over the past month, with 20-day average volume running at roughly 7.3 billion shares, a backdrop that points to steady demand for large-cap growth and technology exposure. In 2025, the Nasdaq-100 delivered a 21% total return, outpacing the S&P 500 by 3 percentage points, with technology at a 61% average weight driving 88% of the index’s total return for the year.[2]
In 2026, the macro story has been about earnings and valuations holding up even as investors debate the path of interest rates. In May 2026, Nasdaq’s review highlighted blended first-quarter revenue growth of 11.1% across sectors and noted that forward 12-month S&P 500 price-to-earnings multiples had pushed to 20.9 times, supported by upward revisions to earnings estimates.[1] That mix of solid top-line growth and richer valuations leaves less room for error, which makes the historical NDX seasonal trend into the pre-election year more relevant for traders trying to gauge whether momentum can persist.
The chart below shows how that recent climb lines up with the historical median seasonal path over the next two months.
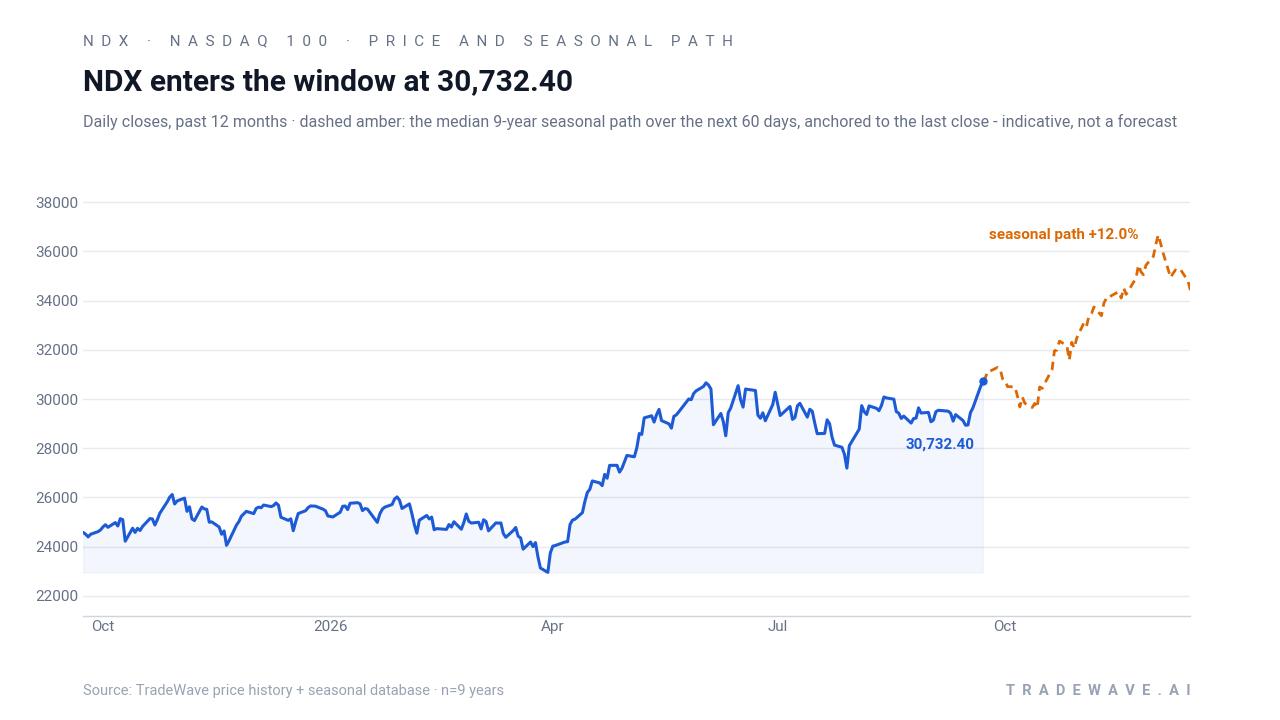
For context, the current move comes after a strong 2025 in which technology leadership was decisive. Nasdaq Global Indexes reported that tech’s heavy weighting and outsized contribution to returns made the Nasdaq-100 one of the cleanest expressions of the growth trade that year.[2] As the index steps into a historically strong midterm-to-pre-election seasonal window, traders will be watching whether earnings breadth, sector rotation and policy expectations can keep supporting that leadership or whether high valuations and macro shocks interrupt the pattern.
Sources
About this seasonal analysis
Seasonal pattern data is sourced from TradeWave.ai, which analyzes historical price behavior across annual calendar windows going back up to 30 years. Read the full data methodology or the book The 100-Year Pattern by Afshin Moshrefi (2026 edition). Past performance of seasonal patterns does not guarantee future results. This article is for informational purposes only and does not constitute investment advice.