Paychex (PAYX) Has Risen in 10 of 10 Midterm Oct-Jul Windows, Averaging 22.66% Gains
Paychex is heading into a historically powerful midterm-year seasonal window even as shares sit below their highs and short interest builds.
Price as of Sep 22, 2026: $114.53 (last close).

What is the seasonal pattern for Paychex (PAYX)?
Paychex has risen in 10 of 10 midterm-election-year windows starting Oct 9 and lasting 275 days, with an average gain of 22.66% in winning years.
- 10 for 10 in this window, averaging 22.66% gains in winning years across the last 10 midterm election years.
- Seasonal window runs from Oct 9 through roughly Jul 10, spanning 275 calendar days in the payroll and HR solutions sector.
- Percent Profitable is 100.0%, with 10 winners and 0 losers in the historical sample.
- Annualized return across these windows is 21.85%, with a Sharpe ratio of 1.29 based on end-of-window outcomes.
- TradeWave Ratio of 1.62 indicates price has typically traveled meaningfully in the long direction within the window, not just at the close.
- Individual years have still seen notable drawdowns inside the window, with some maximum adverse moves in the mid-teens before finishing higher.
According to historical data from TradeWave.ai, this upcoming stretch for Paychex behaves very differently from an average year. The next section walks through what that election-cycle seasonal pattern has looked like in prior midterm years.
How has Paychex (PAYX) traded in past Oct 9 to Jul 10 windows?
Paychex has closed higher in every single Oct 9 to Jul 10 window across the last 10 midterm election years, averaging a 22.66% gain over each 275-day stretch. Shares finished the prior session at 114.53, leaving the stock about 10.5% below its 52-week high of 127.98 and roughly 37.5% above the 52-week low near 83.29. Short interest has climbed to 20.42 million shares, or 5.79% of the float, with a short-interest ratio of 9.7 days to cover as of Sep 10, 2026, signaling a meaningful pocket of investors positioned against the name heading into this historically strong window.[3]
The grouping by presidential election cycle matters here because this window bridges the late stages of the midterm election year into the heart of the year before the presidential election, a phase that has often coincided with friendlier policy tone and steadier risk appetite. For a recurring-revenue payroll provider like Paychex, that backdrop has historically lined up with improving small business sentiment and portfolio managers rotating back into quality cash-flow names.
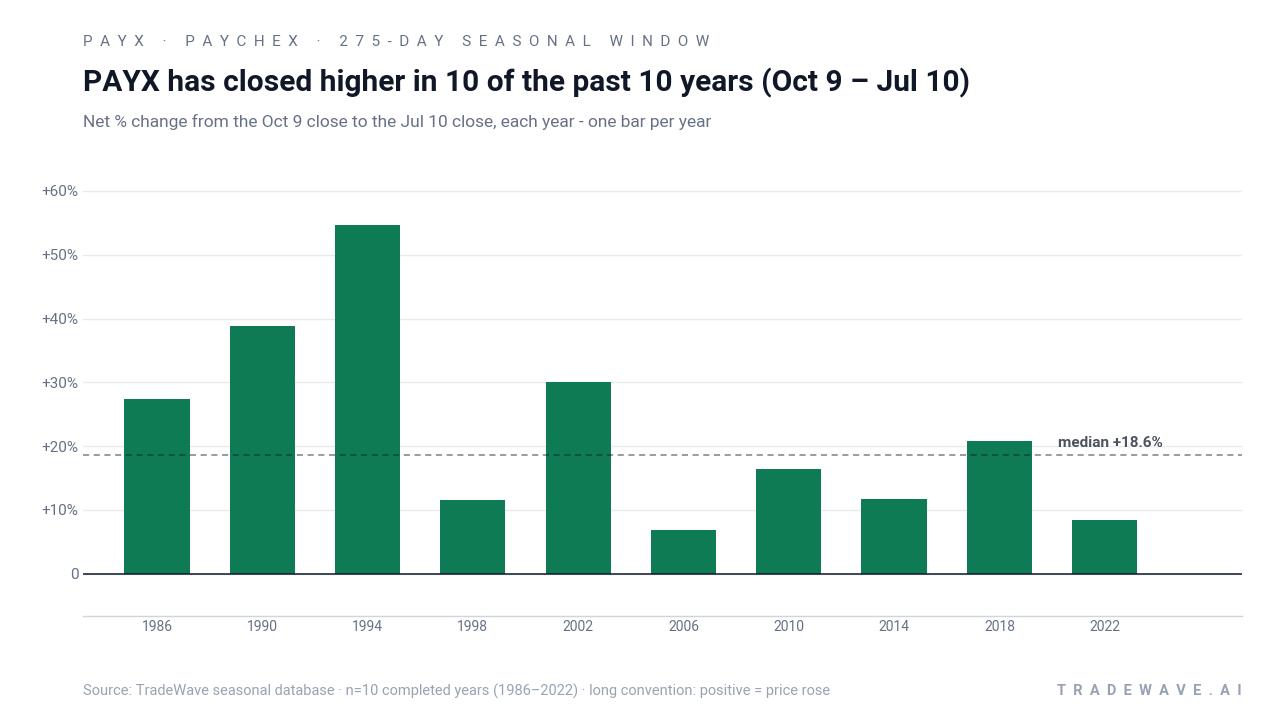
Across the 10 completed midterm-year samples from 1986 through 2022, Paychex’s average 275-day gain of 22.66% sits on top of a 621.61% cumulative return if an investor had only held the stock during this specific window each cycle. The median outcome of 18.6% shows that the pattern is not just driven by one or two outliers. Even the softer years, such as 2006 with a 6.88% gain or 2018 with 8.36%, still finished positive for a long-only approach.
The per-year table shows how that strength has played out in practice. In 1994, Paychex rallied 54.6% from the Oct 9 entry to the Jul 10 exit, with a best intraperiod move of 62.3% and only a 5.21% worst drawdown from entry. In contrast, 1990 delivered a 38.91% net gain but with a much wider range, including a 70.33% best run-up and a 14.79% adverse move at one point, underscoring that even winning years can feel volatile inside the window.
A second view, combining yearly net results with intraperiod swings, highlights how upside and downside have coexisted inside this bullish window.
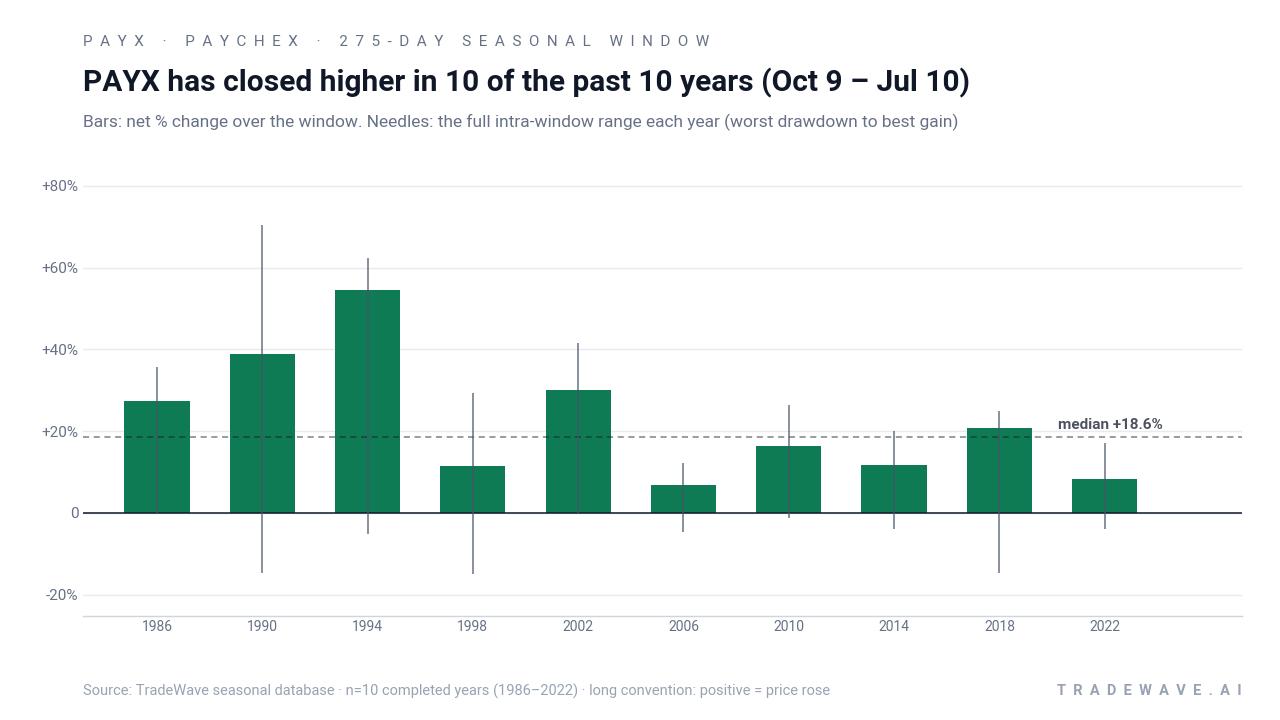
The maximum favorable moves inside the window have often been larger than the final gains, which is what the 1.62 TradeWave Ratio is capturing. At the same time, maximum adverse moves have reached into the low to mid-teens in several years, so the path has not been a straight line even in this unusually consistent pattern. Add it up: 10 winners out of 10, double-digit average gains, and a track record that has rewarded patience through volatility.
History does not guarantee future results, and even in a perfect 10-for-10 window, adverse excursions inside the period can be large before any recovery.
Why does Paychex (PAYX) follow this seasonal pattern?
One likely driver is the way the payroll and HR cycle lines up with the policy and spending backdrop from late midterm years into the year before the presidential election. Analysts have pointed to recurring revenue, strong operating margins and small business hiring trends as key levers for Paychex, and those often improve as political uncertainty fades and fiscal plans for the next administration come into focus.[1] This pattern may also reflect institutional portfolio rebalancing, with investors adding exposure to high-margin, cash-generative business services stocks as they position for the historically stronger pre-election year.
What is driving Paychex (PAYX) today?
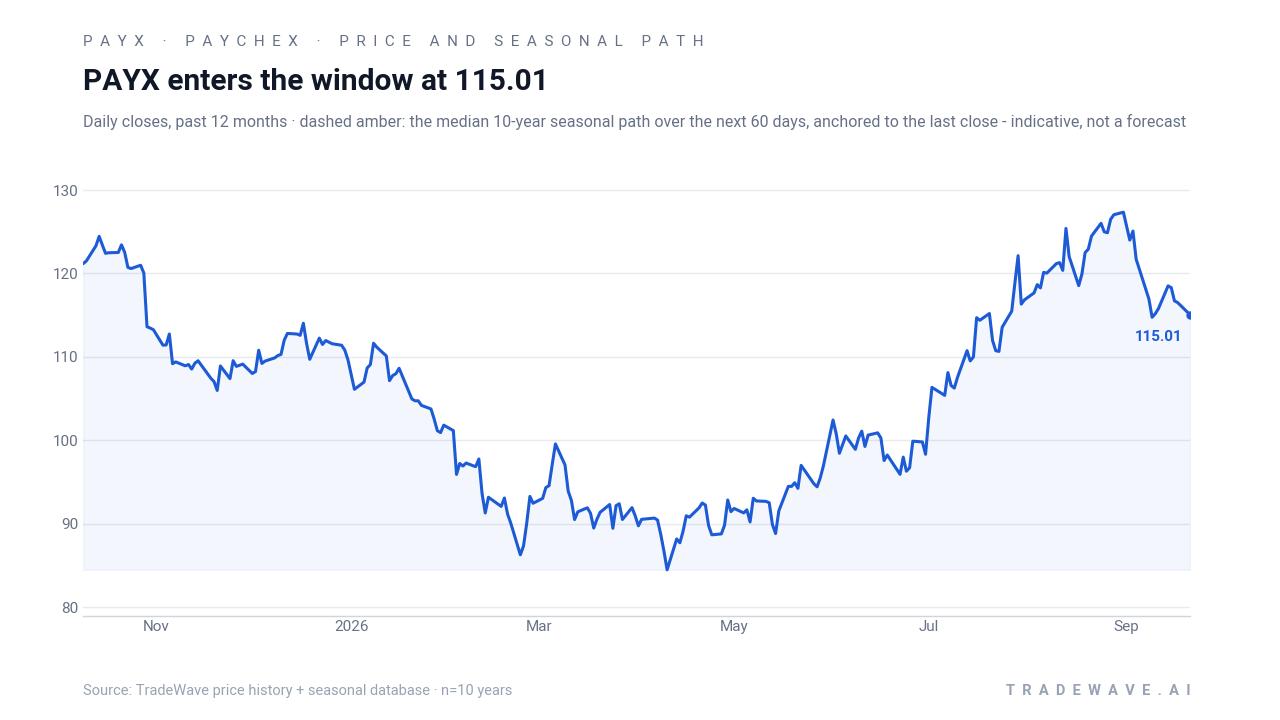
Paychex closed at 114.53 in the prior session, down 0.4% on the day, extending a roughly 7.6% slide over the past month as the stock drifts below its 50-day moving average of 118.83 on slightly elevated volume versus the 20-day average of about 2.68 million shares. The stock is trading about 10.5% under its 52-week high of 127.98 and well above the 52-week low set in early February, a range that leaves room for both short-covering and fresh selling as macro data on small business hiring and rates evolves.
Fundamentally, Paychex is coming off a stretch of strong reported profitability. In February 2026, the company posted Q2 FY26 operating margins of 41.7% and revenue growth of 18%, helped by the Paycor acquisition and price realization, even as management acknowledged that sluggish small business job growth was a headwind and guided FY26 revenue to 16.5% to 18.5%, slightly below prior estimates.[1] In May 2026, Paychex launched its AI-powered Workforce Intelligence (WISE) platform, pitching context-aware guidance and autonomous task execution as a way to deepen its value proposition and support product-led growth in payroll and HR solutions.[2]
Positioning has shifted as the stock has cooled. As of Sep 10, 2026, short interest stood at 20.42 million shares, or 5.79% of the public float, with a short-interest ratio of 9.7 days to cover, up 6.13% from the prior report.[3] That is not extreme by meme-stock standards, but it is meaningful for a mature, large-cap payroll provider and suggests a cohort of investors is leaning against the stock just as it approaches a historically strong seasonal window.
The chart below situates the latest pullback and positioning shift against the past year of trading and the upcoming seasonal projection.
What should traders watch as the Oct 9 seasonal window opens?
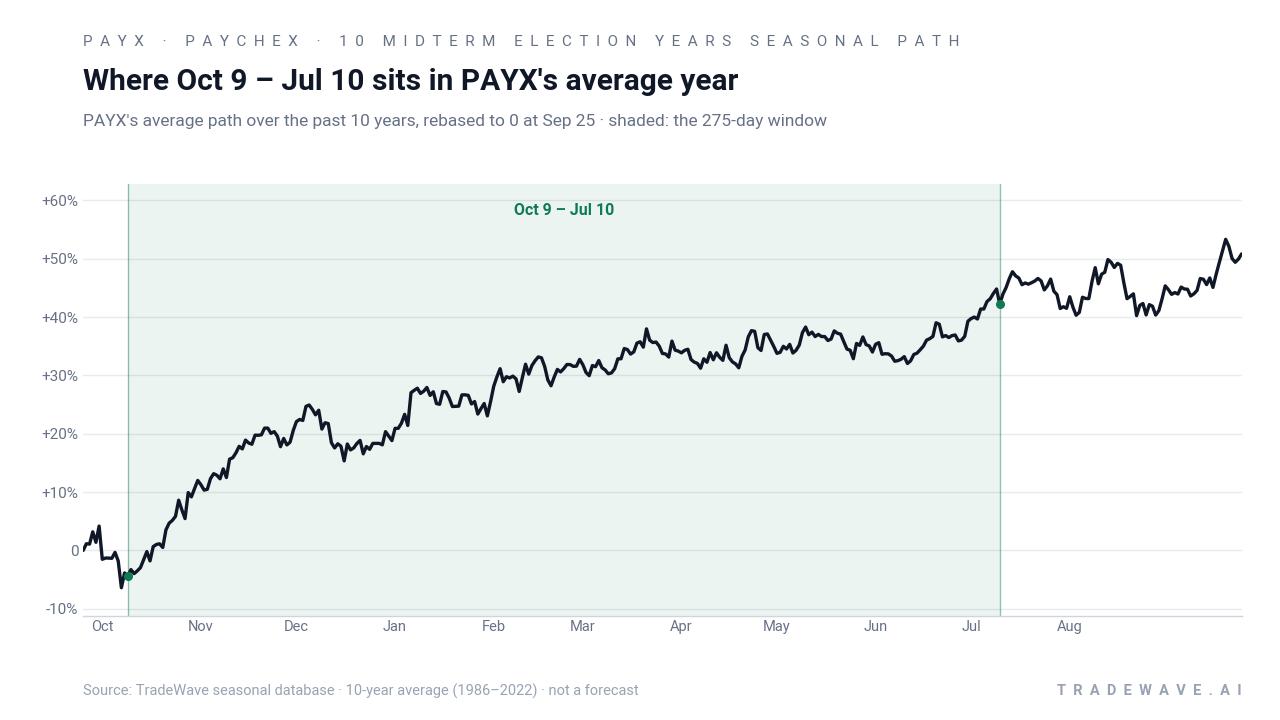
First, the calendar. The 275-day window begins on Oct 9 and runs through roughly Jul 10, carrying Paychex from the final weeks of the midterm election year into the core of the year before the presidential election. Historically, that has been a friendlier phase for equities, and this specific PAYX window has been one of the most consistent long-biased stretches in the stock’s history.
Second, price behavior around key levels. Traders will be watching whether Paychex can reclaim its 50-day moving average near 118.83 and then challenge the 52-week high at 127.98 as the window progresses, or whether the recent 7.6% one-month slide deepens despite the bullish seasonal backdrop. A pattern that tracks the historical seasonal trend, with early consolidation followed by a grind higher, would reinforce the 10-for-10 record; a decisive break lower with expanding volume would mark a clear departure from the past.
Third, the short-interest dynamic. With 5.79% of the float sold short and nearly 10 days to cover, traders will be monitoring whether bearish positioning continues to build or starts to unwind as the window develops.[3] A squeeze in short interest alongside price strength would fit the historical script of strong midterm-to-pre-election windows, while rising short interest into weakness would signal that this cycle may diverge from the prior pattern.
Finally, the policy and macro calendar. Data on small business hiring, wage growth and inflation, along with any shifts in rate expectations, will feed directly into the small business employment trends that Paychex depends on.[1] If those indicators stabilize or improve as political uncertainty around the midterm cycle fades, it would align with the historical PAYX seasonal trend; if they deteriorate, traders will have to weigh a rare 10-for-10 seasonal record against a tougher fundamental backdrop.
Sources
About this seasonal analysis
Seasonal pattern data is sourced from TradeWave.ai, which analyzes historical price behavior across annual calendar windows going back up to 30 years. Read the full data methodology or the book The 100-Year Pattern by Afshin Moshrefi (2026 edition). Past performance of seasonal patterns does not guarantee future results. This article is for informational purposes only and does not constitute investment advice.