Nine-for-Nine Streak: Nasdaq 100 (NDX) Averages 33.25% Gains in This 300-Day Election Window
Nasdaq 100 is trading about 5.9% below its 52-week high as it approaches a 300-day midterm-to-pre-election seasonal window that has delivered gains in every cycle studied.
Price as of Sep 15, 2026: $28,937.84 (last close).

What is the seasonal pattern for Nasdaq 100 (NDX)?
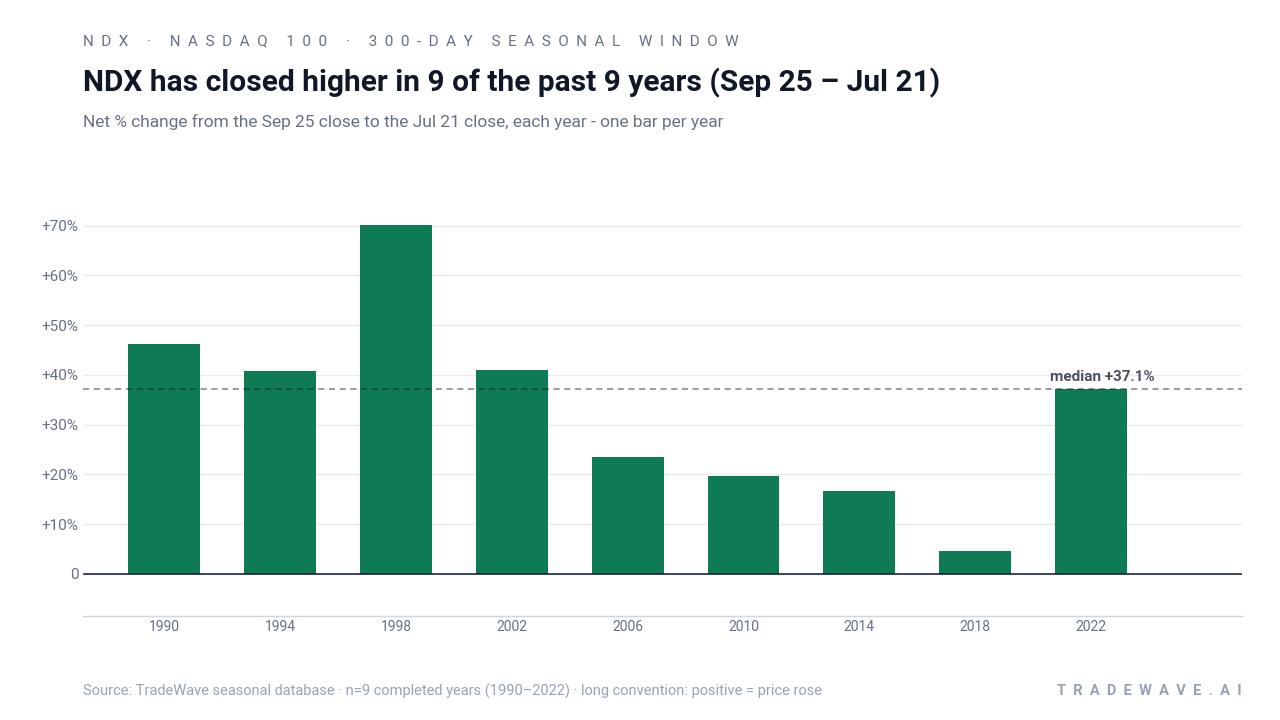
Nasdaq 100 has risen in 9 of 9 midterm-to-pre-election year windows starting around Sep 25, with an average gain of 33.25% in winning years.
- 9 for 9 in this 300-day window, with average winner gains of 33.25% and a cumulative return of 1,116% across cycles.
- Percent Profitable is 100%, with 9 winners and 0 losers across the last 9 midterm election years in this pattern.
- Trade Direction is long, with a Sharpe ratio of 1.54 and a TradeWave Ratio of 1.52, pointing to strong risk-adjusted upside moves.
- Individual years have ranged from a 4.52% gain in 2018 to a 70.03% surge in 1998, showing both consistency and occasional outsized rallies.
- Intraperiod swings have been meaningful, with worst drawdowns inside the window reaching as deep as about 23.5% in some years.
- The window opens on Sep 25 and runs roughly to late July, overlapping the traditional midterm-to-pre-election phase that has often favored growth and tech-heavy indices.
According to historical data from TradeWave.ai, this long midterm-to-pre-election stretch has behaved very differently from an average year for Nasdaq 100. The next section walks through how that pattern has played out in prior cycles and what it implies for the coming window.
How has Nasdaq 100 (NDX) traded in the midterm-to-pre-election window?
Nasdaq 100 has closed higher in every one of the last 9 midterm-to-pre-election windows starting around Sep 25, averaging gains of 33.25% over roughly 300 days. The index finished the prior session at 28,937.84, down 0.65% on the day and sitting about 5.9% below its 52-week high of 30,762.20. That combination of a modest pullback from the highs and a historically powerful seasonal tailwind is the backdrop as traders look toward the next phase of the election cycle.
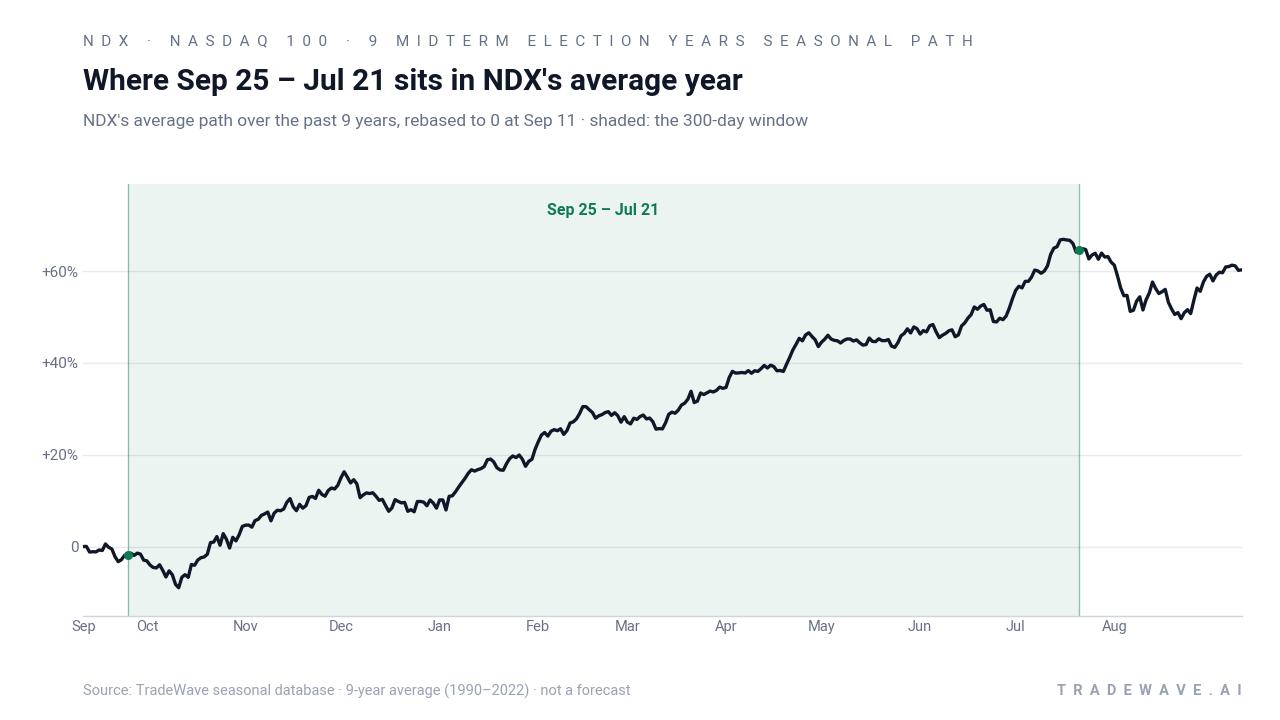
Grouping the data by the presidential election cycle matters here because this window runs from the late part of the midterm election year into the heart of the year before the presidential election, a phase that has often coincided with friendlier policy tone and improving risk appetite. In this sample, the pattern phase is labeled “pe2-9,” which captures the last 9 midterm election years that match today’s calendar setup.
Across those 9 cycles, every single Sep 25 to roughly Jul 21 stretch finished positive for a long NDX position. Average gains of 33.25% sit alongside a median outcome of 37.07%, which tells you the typical year has been closer to the high side of that range rather than dragged up by one outlier. Add it up: stacking those windows compounds to about 1,116% across the sample.
The strongest year in the dataset was 1998, when NDX gained 70.03% over the window, with a maximum favorable move of 77.57% and a worst intraperiod drawdown of 23.51%. At the other end of the spectrum, 2018 still finished up 4.52%, but that came with a 22.06% drawdown at one point, showing that even “winning” years have included sharp air pockets.
Those intraperiod swings are captured by the maximum favorable excursion and maximum adverse excursion metrics. In plain English, the best rallies inside the window have often pushed 40% to 70% above the starting level in strong years, while the worst pullbacks have at times taken 7% to more than 20% off the entry before the trend reasserted higher. The TradeWave Ratio of 1.52 indicates that, on average, price has tended to travel meaningfully in the trade direction within the window, not just drift to its final close.
Year-by-year ranges show how far NDX has tended to swing inside the window before settling at its final gain.
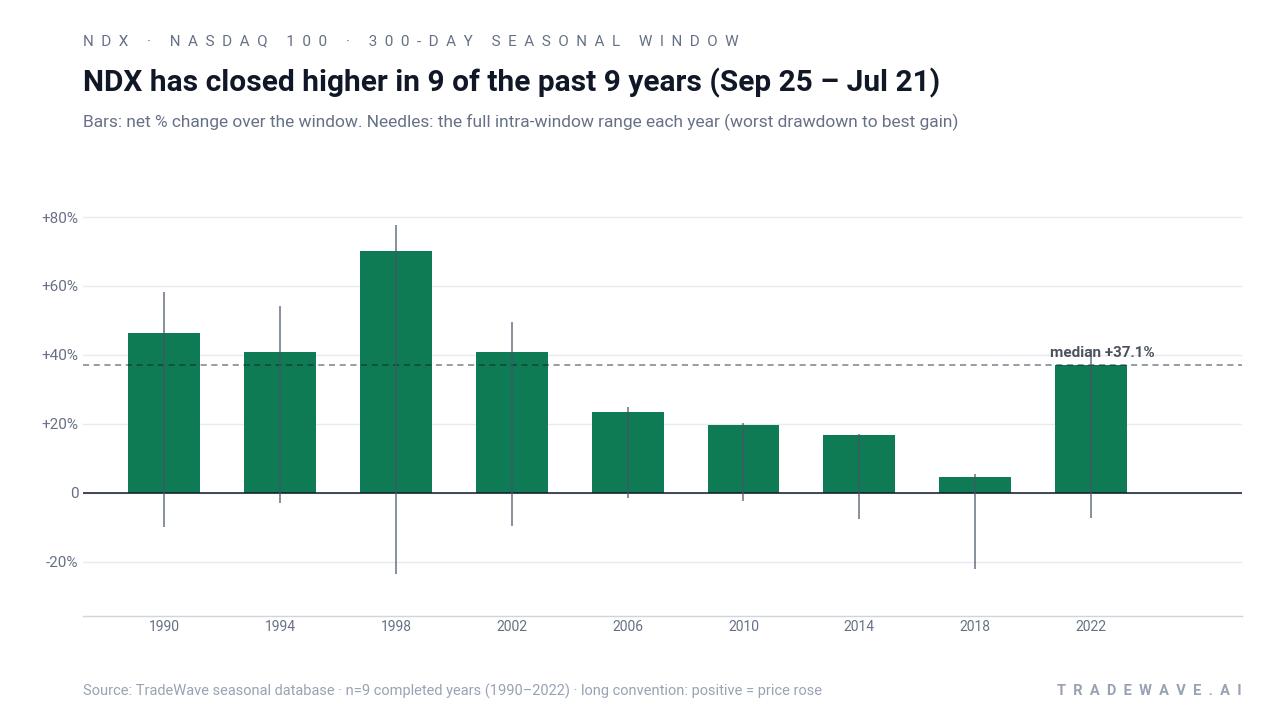
Viewed together, the trend and range charts show a pattern of persistent upside with meaningful volatility rather than a smooth climb. The early part of the window has often seen some chop and occasional downside spikes, while the bulk of the gains have tended to accrue as the calendar moves deeper into the pre-election year. The key takeaway is simple: nine for nine, with big average gains, but not without some uncomfortable swings along the way.
History does not guarantee future results; adverse excursions can be large even in winning windows, and traders should treat this pattern as context rather than a forecast.
Why does Nasdaq 100 (NDX) follow this seasonal pattern?
One likely driver is the way the earnings calendar and policy backdrop line up between late midterm years and the year before the presidential election. Analysts have pointed to a mix of improving macro visibility, lighter policy uncertainty, and strong technology and consumer spending cycles that often support growth stocks in this phase.[3] The pattern may also reflect institutional portfolio repositioning and index-level flows into tech-heavy benchmarks as investors lean back into risk once the midterm political overhang has passed.[4]
What is driving Nasdaq 100 (NDX) today?
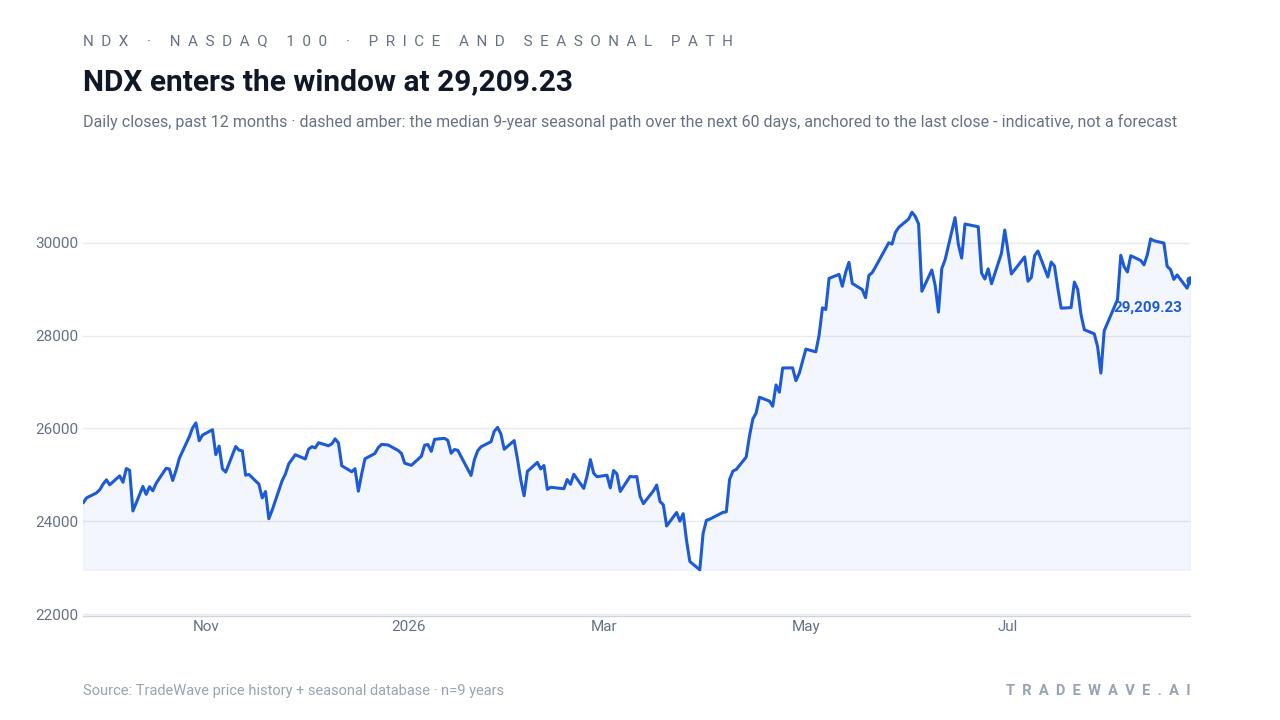
Nasdaq 100 slipped 0.65% in the prior session to 28,937.84, leaving the index about 5.9% below its 52-week high of 30,762.20 and roughly 26.7% above its 52-week low of 22,841.42. The pullback comes after a powerful multi-quarter run driven by mega-cap technology and artificial intelligence names, with NDX still serving as the primary barometer for growth-oriented stocks and high-beta risk appetite.[4] Options activity around the index has been elevated, with sources earlier in 2026 highlighting record-setting NDX options expirations and surging demand for short-dated contracts, a structure that can amplify intraday swings as dealers hedge rapidly changing exposures.[5]
The chart below situates the latest move against the past year of trading and a 60-day seasonal projection path.
Macro drivers remain familiar. In prior cycles, commentary has tied NDX futures and options positioning closely to expectations for Federal Reserve policy and inflation data, with tech and growth names particularly sensitive to shifts in real yields and discount rates.[2] At the same time, the index’s heavy concentration in semiconductors and AI leaders such as Nvidia has meant that single-stock earnings and guidance can ripple quickly through NDX volatility and options pricing, especially around major reporting dates.[3][4] Layered on top of that, the expansion of weekly and daily options expirations has given traders more tools to express short-term views, but it has also increased the potential for sharp, flow-driven swings around key macro and policy events.[5]
Sources
- Reuters - Nasdaq proposes "fast entry" rule to speed up inclusion of large new listings - Reuters
- The Wall Street Journal - Stock Market Today: Nasdaq Futures Gain; Dow Futures Waver Ahead of Inflation Data — Live Updates - The Wall Street Journal
- Nasdaq - Purgatory of the Markets: Navigating NDX Volatility Amidst NVDA Earnings | Nasdaq
- Nasdaq - Summer Rally Signals: Why NDX Outperformance Points to Options Opportunities | Nasdaq
- Nasdaq - Nasdaq Weekly Options Expansion: Meeting Surging Investor Demand and Risk Management Needs | Nasdaq
About this seasonal analysis
Seasonal pattern data is sourced from TradeWave.ai, which analyzes historical price behavior across annual calendar windows going back up to 30 years. Read the full data methodology or the book The 100-Year Pattern by Afshin Moshrefi (2026 edition). Past performance of seasonal patterns does not guarantee future results. This article is for informational purposes only and does not constitute investment advice.