Dow Jones Industrial Average (DJI) Has Risen in 10 of 10 Midterm Oct-Jul Windows, Averaging 21.06% Gains
Dow Jones Industrial Average is trading about 6.0% below its 52-week high as it approaches an Oct 10 seasonal window that has delivered double-digit gains in every midterm election year in the sample.
Price as of Sep 16, 2026: $51,461.90 (last close).

What is the seasonal pattern for Dow Jones Industrial Average (DJI)?
Dow Jones Industrial Average has risen in 10 of 10 midterm-election-year Oct 10 to Jul 20 windows, with an average gain of 21.06% in winning years.
- 10 for 10 in this window, averaging 21.06% gains in winning years across the last 10 midterm election years.
- Seasonal window runs from Oct 10 through Jul 20, spanning 284 days that historically favor long exposure in DJI.
- Percent Profitable is 100.0%, with 10 winners and 0 losers in the historical sample.
- Median profit of 20.68% and annualized return of 20.64% point to a consistently strong DJI seasonal trend in this phase.
- TradeWave Ratio of 1.8 suggests price typically travels meaningfully in the trade direction within the window, while a Sharpe ratio of 1.69 reflects strong risk-adjusted returns.
- Even the weakest year in the sample, 2018, still finished up 6.15% despite a maximum intraperiod drawdown of 15.18%.
According to historical data from TradeWave.ai, this midterm-to-pre-election stretch has behaved very differently from an average year for the Dow. The next section walks through how that pattern has played out in past cycles and what it means for the coming Oct 10 window.
How has Dow Jones Industrial Average (DJI) traded in the Oct 10 to Jul 20 midterm-year window?
Dow Jones Industrial Average has closed higher in every single Oct 10 to Jul 20 window across the last 10 midterm election years, averaging gains of 21.06%. The index heads toward this regime at 51,461.90, about 6.0% below its 52-week high of 54,744.33 and roughly 14.2% above its 52-week low of 45,057.28. That combination of a modest pullback from records and a historically powerful midterm-to-pre-election seasonal pattern is why this specific slice of the calendar matters for traders watching the Dow Jones Industrial Average trading window.
Pattern phase equals the midterm election year, and calendar phase is the late part of that same midterm year. The upcoming Oct 10 start date effectively bridges the market from a choppy midterm backdrop into the year before the presidential election, a phase that has often coincided with friendlier policy expectations and stronger risk appetite for equities.
Grouping the data by presidential election cycle rather than by simple calendar years is key here. Corporate tax policy, spending priorities and regulatory tone tend to move in multi-year arcs around the White House, so a midterm-year seasonal pattern can look very different from the same dates in a pre-election or post-election year even if the macro headlines sound similar.
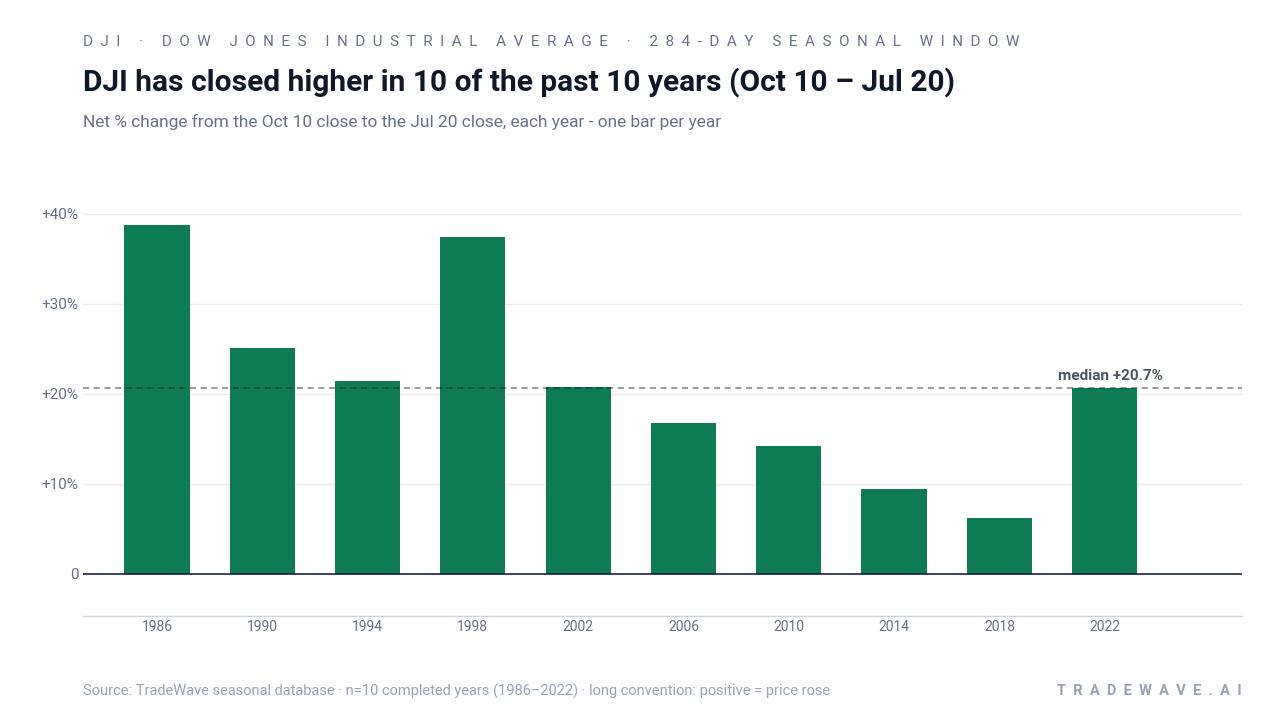
Across the 10 completed midterm-election-year samples from 1986 through 2022, the long-direction pattern has never produced a losing Oct 10 to Jul 20 stretch. Percent Profitable sits at 100.0%, with 10 winners and 0 losers, and the median profit of 20.68% is almost identical to the 21.06% average, which tells you the gains are not just a couple of outliers carrying the series.
The strongest year in the set was 1986, when the Dow gained 38.73% between the Oct 10 entry and the Jul 20 exit, with a best intraperiod run-up of 40.53% and only a 0.14% worst drawdown from the starting level. At the other end of the spectrum, 2018 still finished the window up 6.15%, but the index suffered a 15.18% maximum adverse move at one point before recovering, a reminder that even “all green” seasonal patterns can involve sharp swings along the way.
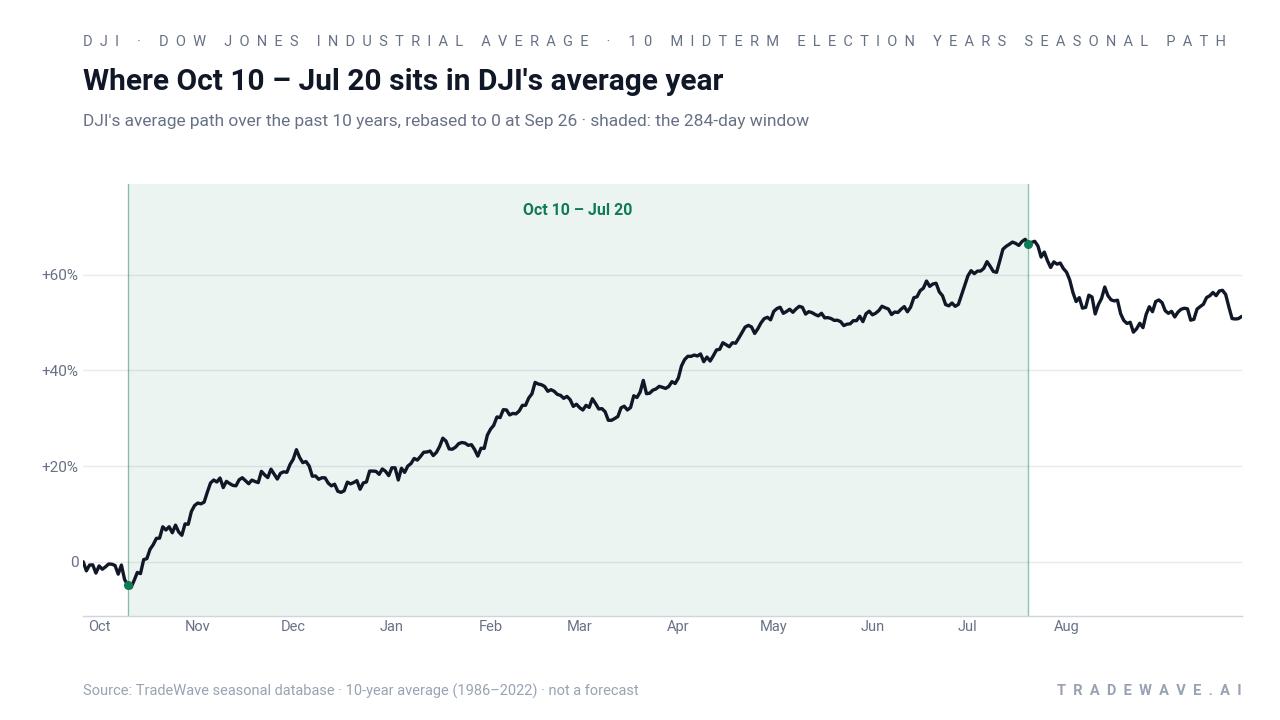
The historical seasonal average path suggests the typical pattern is not a straight line. Gains tend to build over the course of the 284 days, with periods of consolidation and occasional drawdowns, but the average line slopes steadily higher from entry to exit. That fits with the idea that midterm-year volatility often gives way to a more persistent uptrend as markets look ahead to the year before the presidential election.
Year-by-year ranges show how much DJI has swung inside the window before settling at those positive closes.
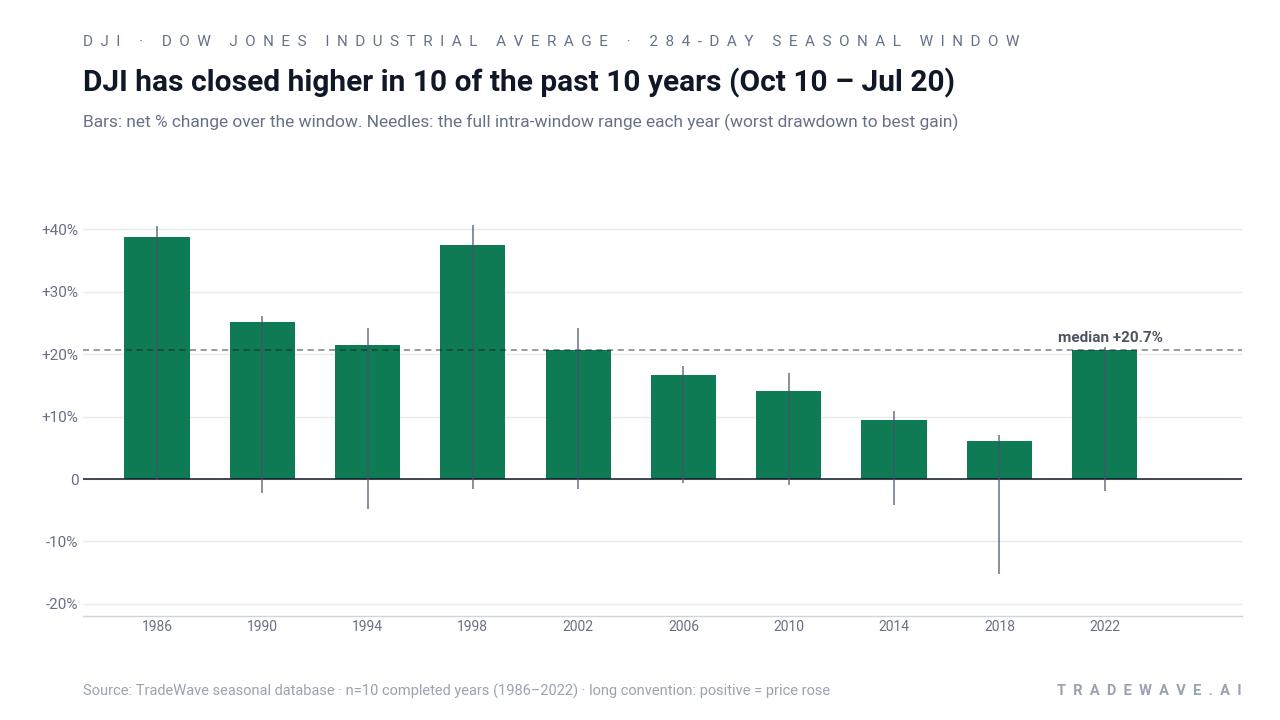
The stacked net / maximum favorable move / maximum adverse move profile shows a clear pattern. In strong years like 1986, 1998 and 2002, the best intraperiod gain slightly exceeded the final net result, which means rallies largely held. In more volatile years such as 2018, the worst drawdown was deep relative to the final gain, underscoring that even a 100% win-rate window can involve double-digit downside before the seasonal tailwind reasserts itself.
Put it together and the message is simple: this is a long-biased seasonal regime with a perfect win record in the sample and chunky average gains, but the path has not always been smooth.
History does not guarantee future results; adverse excursions can be large even in winning windows, and traders should size risk with those past drawdowns in mind.
Why does Dow Jones Industrial Average (DJI) follow this seasonal pattern?
One likely driver is the way the presidential election cycle shapes policy expectations and risk appetite. Midterm election years often bring early-year volatility and policy uncertainty, but by October the market is already looking ahead to the year before the presidential election, which has historically featured friendlier fiscal and regulatory backdrops. That shift, combined with year-end portfolio rebalancing, new-year inflows and the spring earnings cycle, may help explain why this Oct 10 to Jul 20 window has repeatedly favored long exposure in the Dow.
What is driving Dow Jones Industrial Average (DJI) today?
Dow Jones Industrial Average finished the prior session at 51,461.90, down 1.21% on the day, leaving it about 6.0% below its 52-week high of 54,744.33 and roughly 14.2% above its 52-week low of 45,057.28. The pullback comes after a stretch in which renewed investor confidence and strong earnings helped push the index above 52,000 for the first time in late June, with industrial and large-cap technology components doing much of the heavy lifting.[2][3]
The chart below shows how that recent dip fits into the Dow’s 12‑month path and the indicative 60‑day seasonal projection.
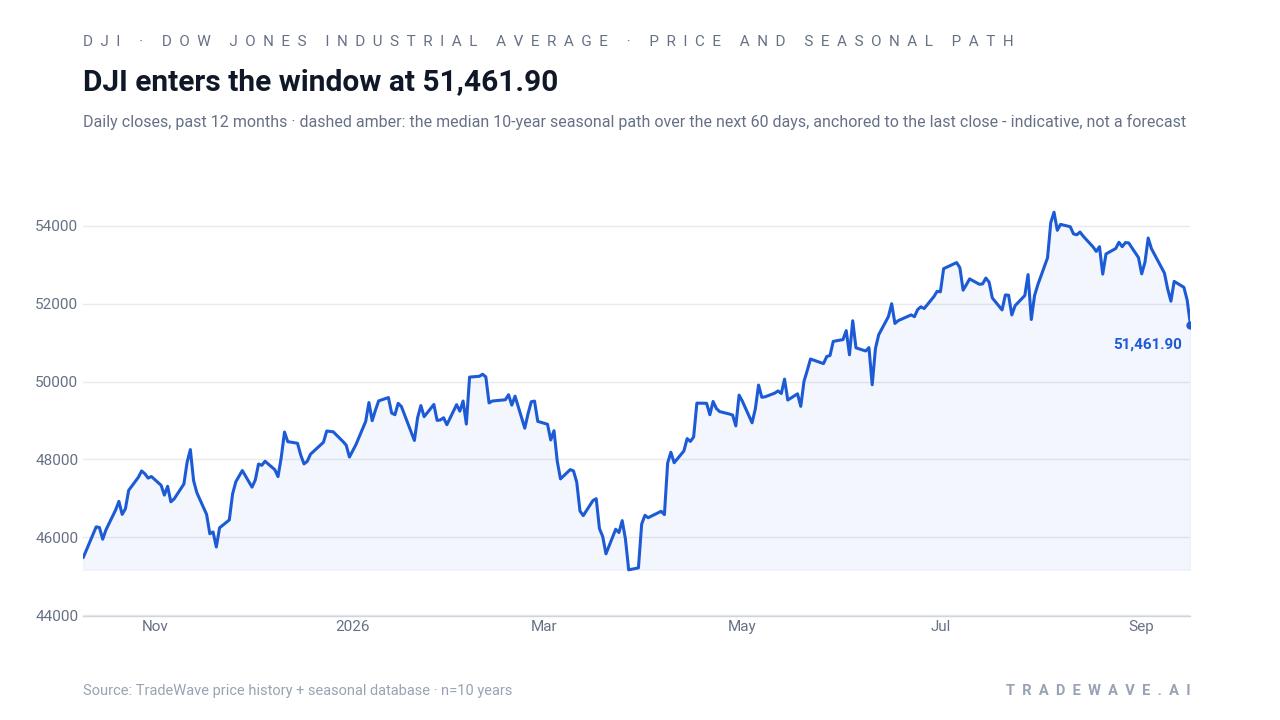
Macro drivers remain familiar. Geopolitical risk around the Middle East and shifting expectations for central bank policy continue to sway day-to-day moves, while earnings breadth and industrial strength have underpinned the broader uptrend in 2026.[3] Against that backdrop, the upcoming Oct 10 seasonal window sits as a potential inflection point where historical seasonality and the policy calendar line up.
What should traders watch as the Oct 10 seasonal window approaches?
First, the calendar. The Oct 10 start date is less than a month away, and it runs deep into the year before the presidential election, a phase that has often coincided with stronger equity performance. How the Dow behaves into quarter-end, especially around any policy or rate headlines, will shape the starting point for this historically strong window.
Second, levels. On the upside, the 52-week high near 54,744 is the obvious reference; a break back toward that area before or early in the window would echo prior cycles where rallies started quickly. On the downside, traders will be watching how the index reacts if it drifts closer to the 50-day moving average around 52,909 or toward the 52-week low zone near 45,057, since past windows have shown that sizeable drawdowns can still resolve higher by Jul 20.
Third, volatility inside the window. History shows that maximum adverse moves have occasionally reached mid-teens even in years that finished positive, so intraperiod shakeouts would not be unusual. If the Dow sells off sharply after Oct 10 but then stabilizes and recovers within the window, that would be consistent with the historical pattern. A sustained break that fails to recover by midyear would be the kind of behavior that would contradict the last 10 midterm-election-year samples.
Finally, the policy and earnings calendar. Key inflation prints, central bank meetings and the early 2027 earnings season will all land inside this 284-day stretch. Traders will be watching whether strong earnings breadth and industrial leadership, which helped power the index to records earlier in 2026, reassert themselves as the market transitions from the concluding midterm election year into the year before the presidential election.[1][3]
Sources
- Seeking Alpha - Dow tops record high, and here’s how all 30 stocks rank according to SA Quant Ratings
- Yahoo Finance - Stock market today: Dow closes above 52,000 for first time, S&P 500 ...
- Yahoo Finance - Stock market today: Dow jumps 750 points, S&P 500, Nasdaq notch record highs to cap best month for stocks since 2020
About this seasonal analysis
Seasonal pattern data is sourced from TradeWave.ai, which analyzes historical price behavior across annual calendar windows going back up to 30 years. Read the full data methodology or the book The 100-Year Pattern by Afshin Moshrefi (2026 edition). Past performance of seasonal patterns does not guarantee future results. This article is for informational purposes only and does not constitute investment advice.