CBOE Volatility Index (VIX) Has Finished Lower in Every Oct 10-Feb 15 Midterm Window
CBOE Volatility Index is sitting in the mid-teens as it approaches an Oct 10 seasonal window that has historically seen implied volatility grind lower into the pre-election year.
Price as of Sep 18, 2026: $14.81 (last close).

What is the seasonal pattern for CBOE Volatility Index (VIX)?
CBOE Volatility Index has fallen in 8 of 8 midterm-year Oct 10 to Feb 15 windows, with an average 24.29% gain for short positions in winning years.
- 8 for 8 in this window, with VIX closing lower every time from Oct 10 to Feb 15 in the last eight midterm election years.
- Percent Profitable is 100.0%, with 8 winners and 0 losers for the short-side pattern across the sample.
- Avg Profit for winning years is 24.29%, stacking to a 454.55% cumulative return when the window is repeated over the full history.
- The TradeWave Ratio (TWR) of 2.88 signals that VIX typically travels meaningfully in the trade direction within the window, not just at the close.
- A Sharpe ratio of 2.09 points to unusually strong risk-adjusted returns for this specific VIX seasonal window.
- Intraperiod swings have still been large, with some years showing sharp spikes before VIX ultimately faded into the pre-election year.
According to historical data from TradeWave.ai, this midterm-year autumn stretch has behaved very differently from an average VIX month, which makes the upcoming window worth a closer look.
How has CBOE Volatility Index (VIX) behaved in the Oct 10 to Feb 15 window?
The Oct 10 to Feb 15 window in midterm election years has seen VIX finish lower in every one of the last eight cycles, a clean 8-for-8 record for short volatility exposure. Today VIX sits at 14.81, down 4.1% on the prior session’s close and about 58.0% below its 52-week high of 35.3.[1] That puts implied equity volatility closer to the floor of its past-year range as markets wrap up the midterm election year and head toward the historically more risk-on pre-election phase.
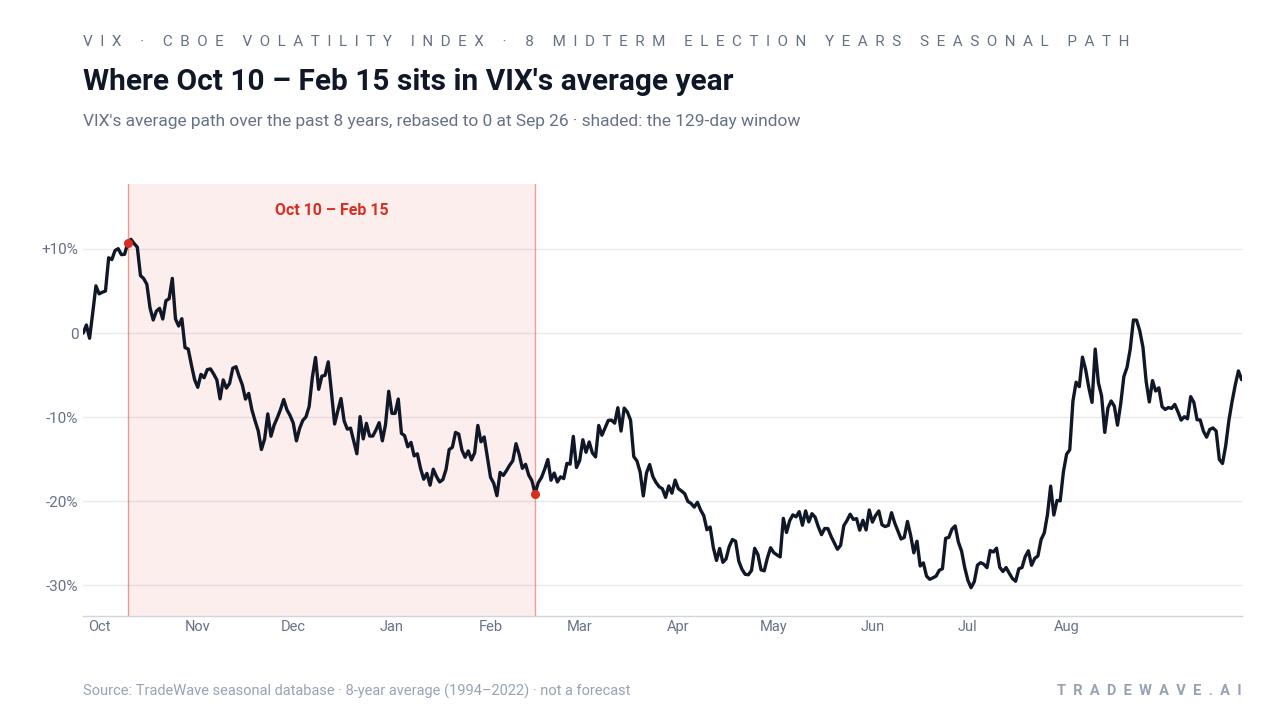
Grouping the data by the presidential election cycle matters here because this pattern only shows up in midterm years, not in a generic “average year” view. The window captures the handoff from late-year policy and rate uncertainty into the pre-election year, when fiscal and monetary stances have often stabilized and equity markets have tended to grind higher, pressuring implied volatility lower in the process.
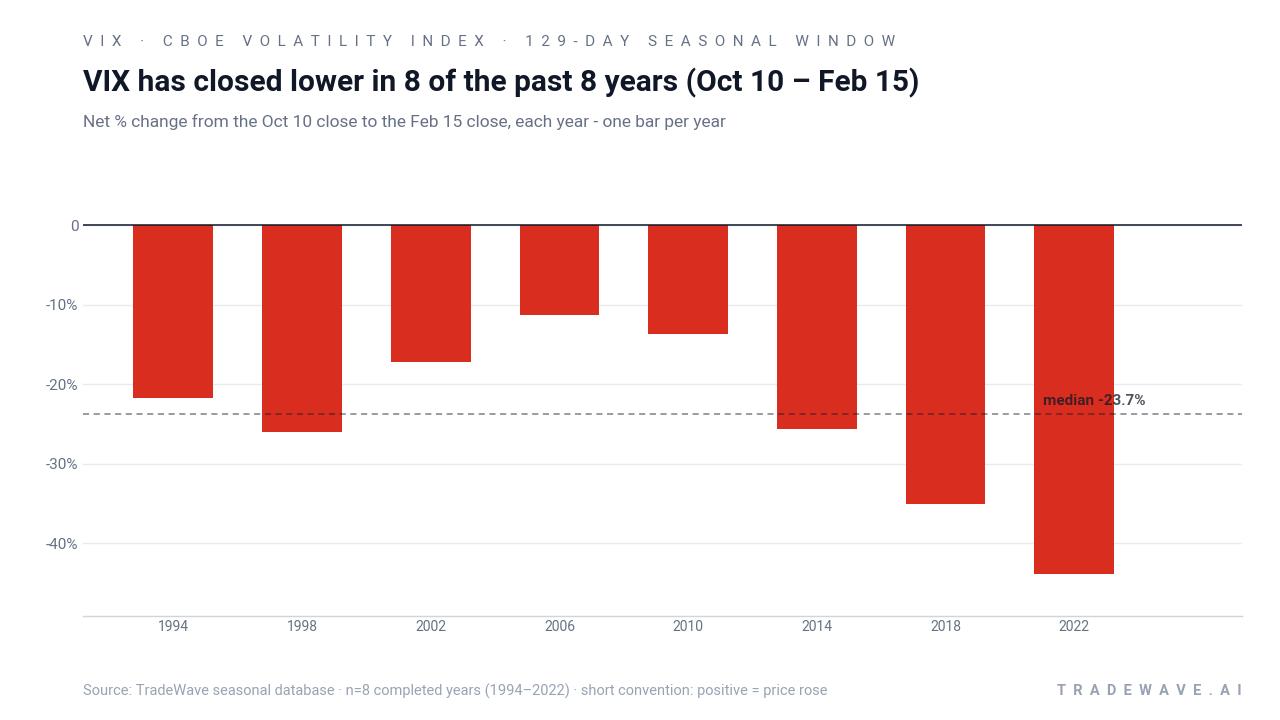
For this pattern the trade direction is explicitly short, so years where VIX fell are “good” outcomes and spikes are “bad” ones for the strategy. Across the eight midterm election years in the sample, Percent Profitable is 100.0%, with 8 winners and 0 losers, and the average profit for those winning shorts is 24.29%. The median profit of 23.67% shows that the result is not just driven by one outlier year, and the 454.55% cumulative return figure reflects what happens when that 129-day window is repeated across the full history.
The per-year table shows how that plays out in practice. In 2018, for example, VIX entered the window at 22.96 and exited at 14.91, a net return of -35.06% for the index and a strong year for the short pattern, even though the maximum favorable move within the window reached 57.67% at one point. In 1998, VIX started at 40.07 and finished at 29.65, a -26.0% net change, but the worst intraperiod drawdown from the entry was -49.89%, underscoring how far volatility can fall during this stretch before any countertrend spikes.
A second view combines net results with the full intraperiod range, highlighting both maximum favorable and maximum adverse moves for shorts.
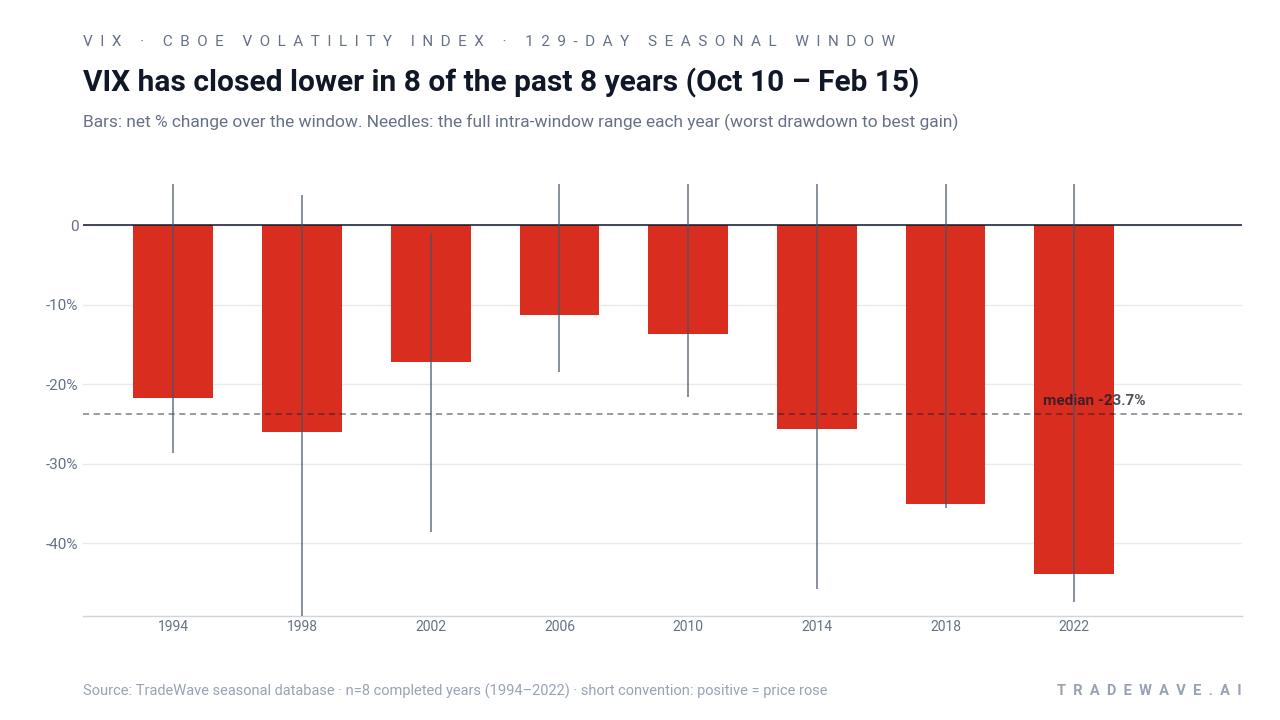
The maximum favorable excursion, or MFE, captures the best point-to-peak move in favor of the short during each year, while the maximum adverse excursion, or MAE, tracks the worst drawdown against it. Several years, such as 2014 and 2018, show large positive MFE values alongside deep negative MAE, which means VIX often spiked hard before ultimately sliding into the close of the window. The TradeWave Ratio of 2.88 reflects that VIX typically travels a long way in the trade direction within the window, even if the final close does not capture the full swing.
The cumulative chart for this pattern climbs steadily, with no flat or down years, which is unusual for a volatility index that is known for mean-reversion and sudden shocks. Add it up: repeating this 129-day short-volatility window across the eight midterm election years in the sample compounds to a 454.55% gain. History does not guarantee a repeat, but the consistency across cycles is hard to ignore.
History does not guarantee future results, and the intraperiod MAE readings show that even in winning years, short volatility positions have faced large and sometimes sudden adverse moves.
Why does CBOE Volatility Index (VIX) follow this seasonal pattern?
One likely driver is the way the policy and earnings calendar lines up around the midterm election year. By late in the year, many of the big macro shocks and rate surprises are known, and the market often shifts from reacting to new headlines to positioning for the historically stronger pre-election year. Analysts have also pointed to options expiration patterns and year-end portfolio rebalancing as forces that can suppress implied volatility into early February, especially when equity markets grind higher and realized volatility stays contained.
What is driving CBOE Volatility Index (VIX) today?
The prior session’s close left VIX at 14.81, down 0.63 points or 4.1% on the day, and about 10.7% above its 52-week low of 13.38 while sitting far below the 35.3 high logged over the past year.[1] That keeps the index in the same mid-teens zone that commentators in May 2026 described as “low fear” relative to past spikes, even as macro and geopolitical headlines remained noisy.[2] Recent coverage has framed this environment as one where investors lean on VIX options and structured trades, such as butterfly spreads, to secure cheap protection against the risk of a sudden equity selloff rather than paying up for volatility after the fact.[5]
The chart below shows how that backdrop fits into VIX’s past year of trading, along with a purely historical seasonal projection for the next two months.
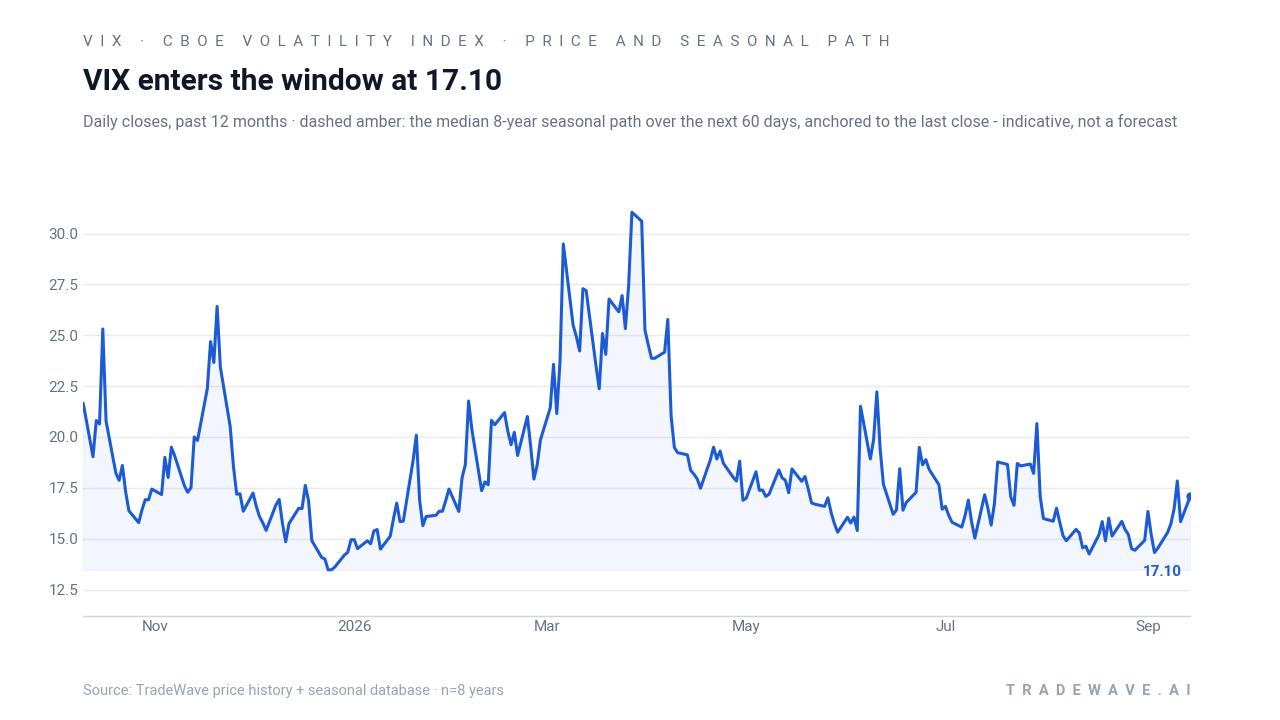
In this regime, low but not extreme VIX readings have coexisted with ongoing macro uncertainty, which keeps demand alive for hedging strategies without triggering outright panic.[2][3] Because VIX tends to fall when equities grind higher and expand sharply during risk-off episodes, the current mid-teens level suggests equity markets are pricing in modest day-to-day swings rather than a near-term shock. That makes the upcoming seasonal window particularly interesting: historically, this is when implied volatility has had a habit of bleeding lower into the pre-election year even when the news flow stayed noisy.
What should traders watch as this VIX seasonal window approaches?
First, the calendar: the 129-day window opens on Oct 10 and runs through Feb 15, covering the final stretch of the midterm election year and the first weeks of the pre-election year. Historically, that has been a sweet spot for short volatility exposure in VIX, with 8 winners and 0 losers and an average 24.29% gain for shorts across the sample. Second, levels: traders will be watching whether VIX can hold near or below the mid-teens into the start of the window, or whether a pre-window spike toward the 20–30 zone forces hedgers to pay up for protection.[2][5]
Third, macro and policy catalysts: inflation prints, central bank meetings, and any late-breaking fiscal debates can all jolt implied volatility, especially when they land near major options expirations. If VIX spikes on those events but then fades back toward the teens, that would rhyme with prior midterm-year patterns where early-window shocks gave way to a grind lower. If instead volatility stays elevated or trends higher through November and into early 2027, it would mark a clear break from the historical seasonality and signal that this cycle is trading on a different macro script.
Sources
- Yahoo Finance (Cboe Indices) - CBOE Volatility Index (^VIX) Charts, Data & News - Yahoo Finance
- Barchart - CBOE Volatility Index Price - Barchart.com
- Seeking Alpha - S&P VIX Index (VIX) Latest Stock Analysis | Seeking Alpha
- Barchart - CBOE Volatility Index Put/Call Ratio - Barchart.com
- Barchart (Column) - The VIX Butterfly Playbook for Volatility Spikes
About this seasonal analysis
Seasonal pattern data is sourced from TradeWave.ai, which analyzes historical price behavior across annual calendar windows going back up to 30 years. Read the full data methodology or the book The 100-Year Pattern by Afshin Moshrefi (2026 edition). Past performance of seasonal patterns does not guarantee future results. This article is for informational purposes only and does not constitute investment advice.