S&P 500 (SPX) Has Risen in 10 of 10 Midterm Oct-Jul Windows, Averaging 21.3% Gains
The S&P 500 is less than a month from a 285-day midterm-to-pre-election seasonal window that has never finished lower in the past 10 comparable cycles, even as the index trades well below its 52-week high.

What is the seasonal pattern for S&P 500 (SPX)?
S&P 500 has risen in 10 of 10 midterm-to-pre-election windows starting around Oct 11, with an average gain of 21.32% in winning years.
- 10 for 10 in this window, with S&P 500 averaging 21.32% gains in winning years across the last 10 midterm election cycles.
- The upcoming window begins Oct 11 and runs 285 days into late July, covering the handoff from the midterm election year into the historically strong pre-election year.
- Percent Profitable is 100%, with 10 winners and 0 losers across the sample, all aligned with a long trade direction.
- Median profit of 18.9% shows that even the middle-of-the-pack years delivered double-digit gains for this S&P 500 trading window.
- Individual years have seen maximum favorable moves above 40% and adverse drawdowns near 14%, underscoring that upside has come with real volatility.
- Stacking this 285-day window across the 10 completed cycles compounds to a cumulative return of 574%, highlighting how persistent the SPX seasonal trend has been here.
According to historical data from TradeWave.ai, this midterm-to-pre-election stretch has behaved very differently from an average year for the S&P 500. The next section walks through what that pattern has looked like and how it frames the coming 285 days.
How has S&P 500 (SPX) traded in the midterm-to-pre-election window?
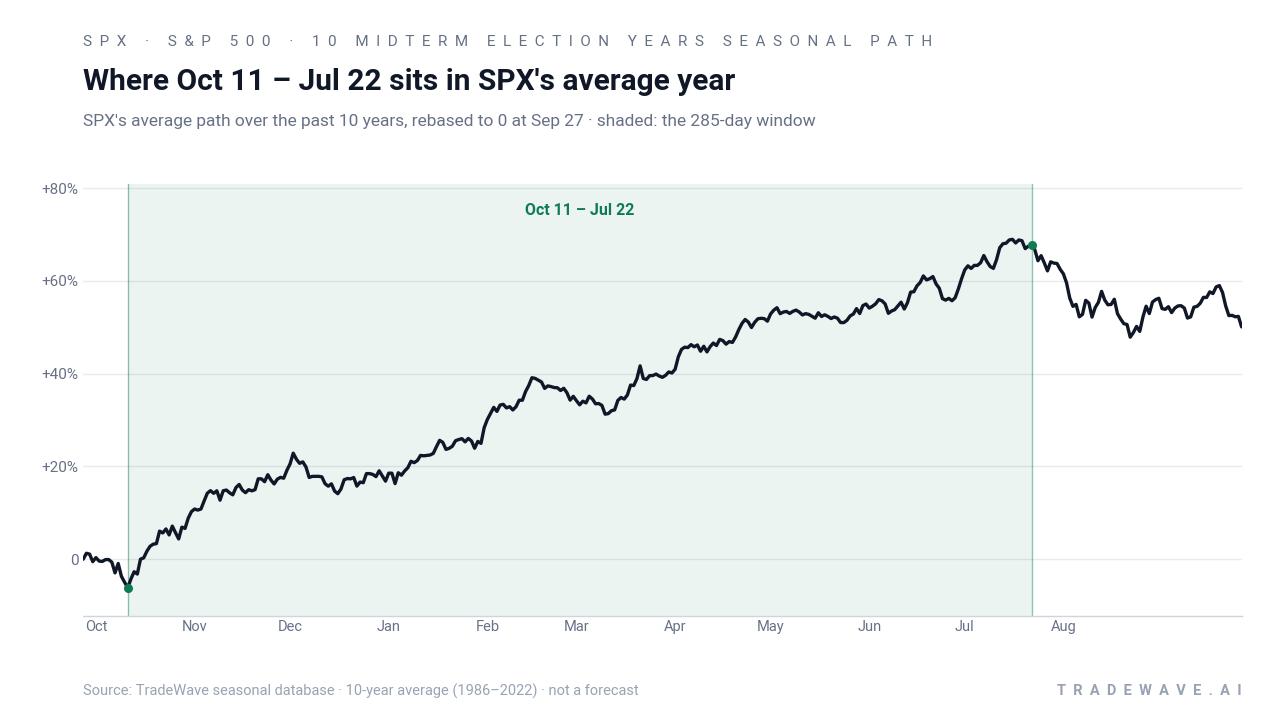
The seasonal window that begins around Oct 11 has delivered gains for S&P 500 in every one of the last 10 midterm election cycles, with average profits north of 20% for long exposure. The index finished the prior session at 6,575.32, leaving it about 15.7% below its 52-week high of 7,816.70 and roughly 27.4% above its 52-week low of 6,316.91. That gap between a soft spot on the chart and a historically powerful SPX seasonal trend is what makes this particular 285-day trading window stand out.
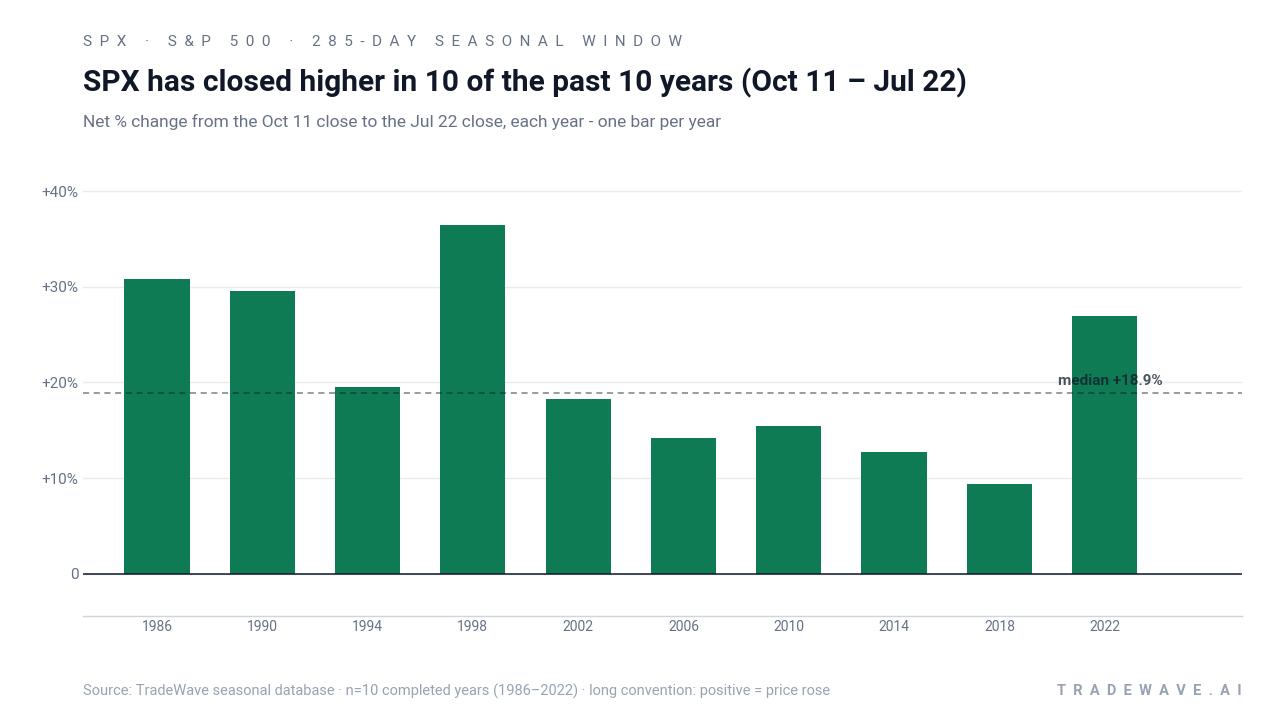
Grouping the data by the presidential election cycle matters here because this 285-day slice always starts late in a midterm election year and runs deep into the year before the presidential election, a phase that has often coincided with friendlier policy tone and risk-on positioning. In this sample, the trade direction is explicitly long, and every one of the 10 completed windows from 1986 through 2022 finished with a positive net return for S&P 500. Average profit across those winners is 21.32%, with a median outcome of 18.9%, so the typical year has delivered a solid double-digit gain rather than a marginal drift higher.
The strongest year in the set was 1998, when the index gained 36.41% between the October entry and the late-July exit, with a best intraperiod run-up of 42.36% before giving back a small portion of the move. At the other end of the spectrum, 2018 still finished up 9.41% over the window, but it carried a much rougher ride, with the worst drawdown inside the period reaching about 13.99% from the entry level. That spread between maximum favorable excursion and maximum adverse excursion is what the MFE/MAE profile is capturing: historically, this has been a bullish window for SPX, but not a quiet one.
Across the 10 midterm election years in the sample, the TradeWave Ratio of 2.02 and Sharpe ratio of 2.02 point to a regime where the index has tended to travel meaningfully in the trade direction relative to its volatility. In plain English, when this window has worked, it has often worked with conviction rather than a slow grind. The per-year table shows that even the more modest years like 2006 and 2014 still posted gains of 14.19% and 12.77% respectively, while years such as 1986, 1990, 1998 and 2022 all cleared 26% net returns over the same 285-day span.
A second view shows how yearly net gains stack up against the full intraperiod range between worst drawdown and best rally.
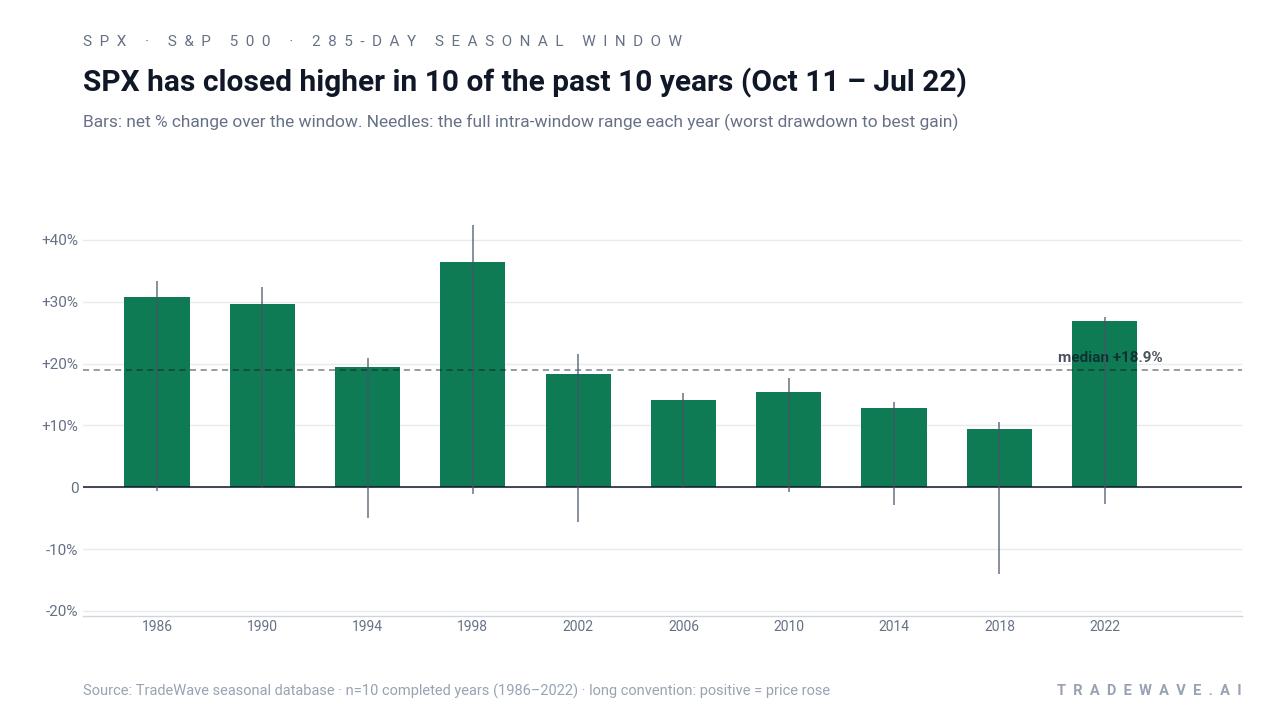
The stacked net/MFE/MAE chart makes two things clear. First, every bar is above zero, which matches the 10-for-10 win record for long SPX exposure in this window. Second, the needles extend both above and below those bars, showing that even in winning years the index has often swung several percentage points against the trade before finishing higher. In 2018, for example, the worst drawdown of about 13.99% came alongside a best intraperiod gain of 10.61%, a reminder that this historically strong S&P 500 trading window has combined upside persistence with meaningful volatility.
History does not guarantee future results; adverse excursions (MAE) can be large even in winning windows.
Why does S&P 500 (SPX) follow this seasonal pattern?
One likely driver is the policy and liquidity backdrop that tends to develop between late in the midterm election year and the year before the presidential election, when Washington uncertainty often fades and fiscal or regulatory risk is clearer. Analysts have also pointed to institutional portfolio rebalancing and sector rotation into growth and technology as the pre-election year approaches, which can amplify a risk-on bias in broad indices. This 285-day SPX seasonal pattern may reflect that combination of cleaner policy visibility, supportive central bank expectations and renewed appetite for equity exposure after earlier midterm-year volatility.
What is driving S&P 500 (SPX) today?
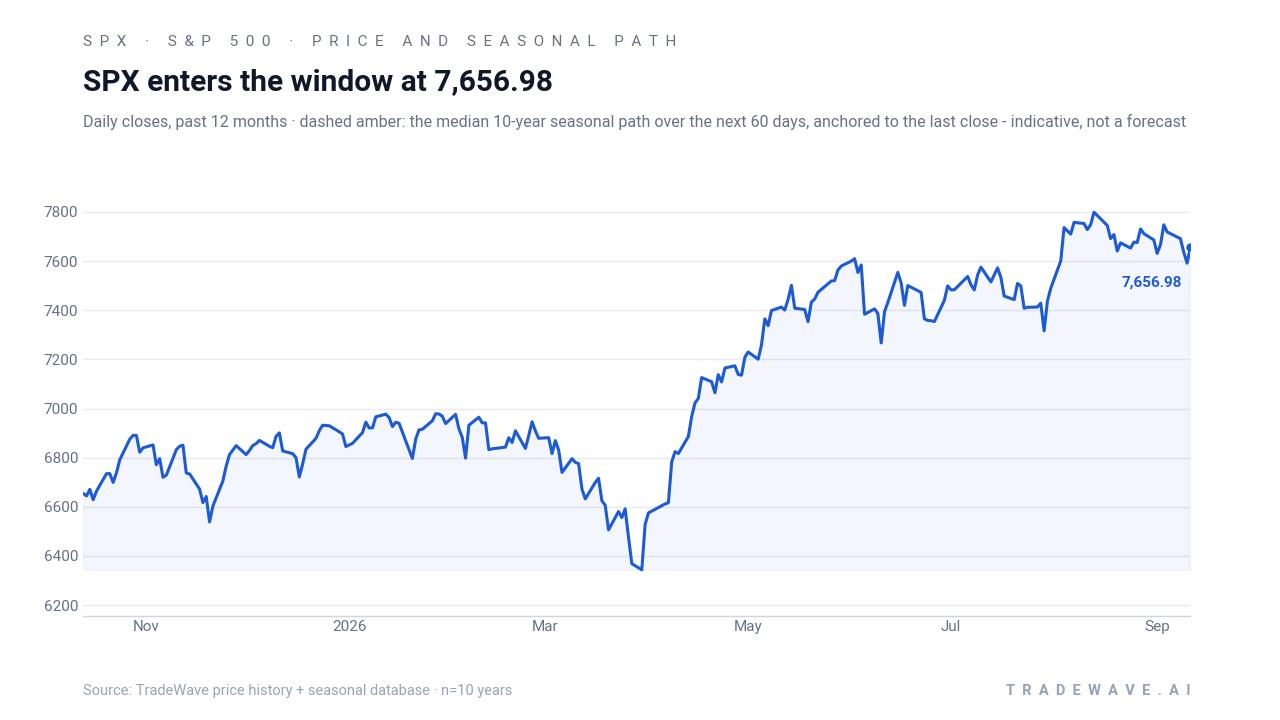
S&P 500 ended the prior session at 6,575.32, up 0.11% on the day, leaving it about 15.7% below its 52-week high of 7,816.70 and roughly 4.1% above its 52-week low of 6,316.91. The index has spent much of 2026 digesting a powerful multi-year run as investors weigh the prospect of Federal Reserve rate cuts that could support equities but also cap future returns compared with past cycles.[2] Macro commentary earlier this year flagged high U.S. debt levels, geopolitical tensions and the path of Fed policy as the main overhangs for the benchmark, even as survey-based outlooks still penciled in mid-single to high-single-digit gains for the year.[2]
The chart below places the latest move in the context of the past year and overlays the median 60-day seasonal path as a reference, not a forecast.
From a macro lens, the policy calendar remains central. Expectations of Fed rate cuts have been described as supportive for equities but potentially consistent with more muted returns than in earlier bull markets, especially if growth slows while inflation stays sticky.[2] At the same time, geopolitical risks around China/Taiwan and the Middle East continue to sit near the top of institutional risk lists, a backdrop that can inject bouts of volatility into an otherwise constructive SPX seasonal outlook. Technology leadership has been a recurring theme in survey work for 2026, which matters because megacap tech names carry outsized weight in the index and often drive how strongly any seasonal pattern shows up in headline SPX levels.[2]
Looking ahead to the Oct 11 start date, the key tension is between a market that is still below its highs and a historical window that has rarely been this one-sided in favor of long exposure. If the index remains under pressure into early October, the upcoming midterm-to-pre-election seasonal regime could open with S&P 500 trading at a discount to its prior peak, a setup that has sometimes preceded outsized rallies in past cycles. If instead the market recovers sharply before the window begins, traders may treat the historical pattern more as a volatility map than as a directional cue, focusing on how far SPX has tended to swing both up and down inside this 285-day stretch.
What should traders watch as this S&P 500 seasonal window approaches?
Three things stand out for this iteration of the pattern. First, the policy calendar: upcoming Fed meetings and any shift in rate-cut expectations will shape how much of the historical pre-election-year strength can actually show through in SPX, especially if growth data softens. Second, levels: the 52-week high near 7,816.70 and the recent low around 6,316.91 are the obvious bookends; how the index behaves as it moves toward either boundary during the window will show whether this cycle is tracking closer to a strong year like 1998 or a bumpier one like 2018. Third, volatility: in prior cycles, the biggest winners in this window still saw double-digit intraperiod drawdowns, so traders will be watching whether any early pullbacks stay within that historical MAE range or start to break the pattern.
If the S&P 500 begins the Oct 11 window under macro stress but then stabilizes and grinds higher into year-end, that would be consistent with the long-run SPX seasonal trend for this midterm-to-pre-election stretch. A failure to hold key support levels, or a pattern of rallies that repeatedly stall well below the 52-week high, would be the first sign that this cycle might diverge from the 10-for-10 record. Either way, the historical playbook is clear: this 285-day window has often been where the broader bull market, if it is going to reassert itself, finds its footing.
Sources
About this seasonal analysis
Seasonal pattern data is sourced from TradeWave.ai, which analyzes historical price behavior across annual calendar windows going back up to 30 years. Read the full data methodology or the book The 100-Year Pattern by Afshin Moshrefi (2026 edition). Past performance of seasonal patterns does not guarantee future results. This article is for informational purposes only and does not constitute investment advice.