CBOE Volatility Index (VIX) Has Risen in 7 of 8 Late-Midterm Windows, Averaging 8.73% Gains
CBOE Volatility Index is sitting just above its 52-week low as a historically bullish 21-day midterm-year seasonal window from Sep 13 to Oct 3 approaches.
Price as of Aug 31, 2026: $14.92 (last close).

What is the seasonal pattern for CBOE Volatility Index (VIX)?
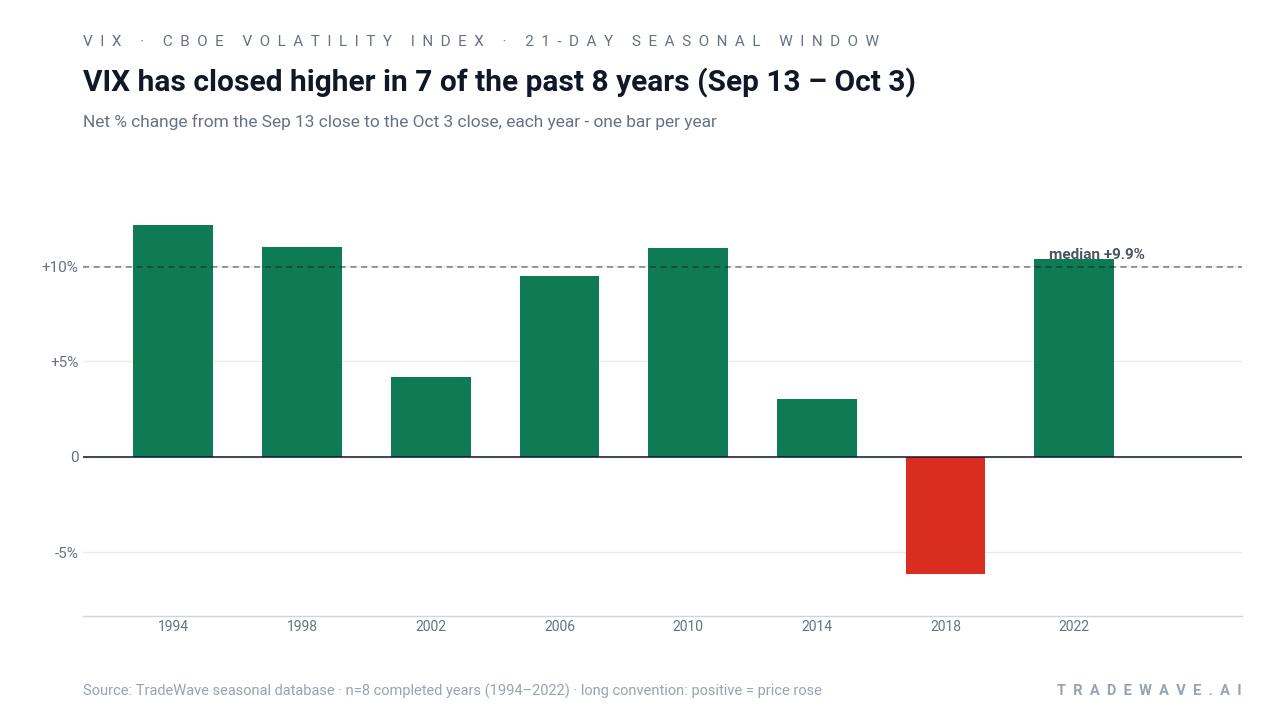
CBOE Volatility Index has risen in 7 of 8 late-midterm-year Sep 13–Oct 3 windows, with an average gain of 8.73% in winning years.
- 7 for 8 in this window, with winning years averaging 8.73% gains and a 68% cumulative return across the sample.
- Percent Profitable is 88%, with 7 winners and 1 loser across the last 8 midterm election years in this 21-day stretch.
- Including the lone losing year, Avg Profit - All still comes in at 7%, pointing to a historically bullish VIX seasonal trend.
- Individual years have seen maximum favorable moves inside the window as high as 27.91%, while adverse swings have reached as deep as -18.41%.
- The pattern is long-directional, meaning the historical edge has come from VIX moving higher during this CBOE Volatility Index trading window.
- This late-midterm election-year slice has often coincided with choppier equity markets and heavier demand for volatility hedges.
According to historical data from TradeWave.ai, this upcoming late-September stretch has behaved very differently from an average month on the volatility calendar. The next section walks through how that pattern has played out in prior midterm election years.
How has CBOE Volatility Index (VIX) behaved in the Sep 13–Oct 3 window?
CBOE Volatility Index has closed higher in 7 of the past 8 late-midterm-year windows from Sep 13 to Oct 3, making this one of its most consistently bullish seasonal stretches. The index ended the prior session at 14.92, up 3.4% on the day and sitting just 11.5% above its 52-week low of 13.38 while more than 57.7% below its 52-week high of 35.30.[1][5] That combination of a historically strong volatility window and a spot VIX level near the bottom of its one-year range is a setup equity traders will not want to ignore.
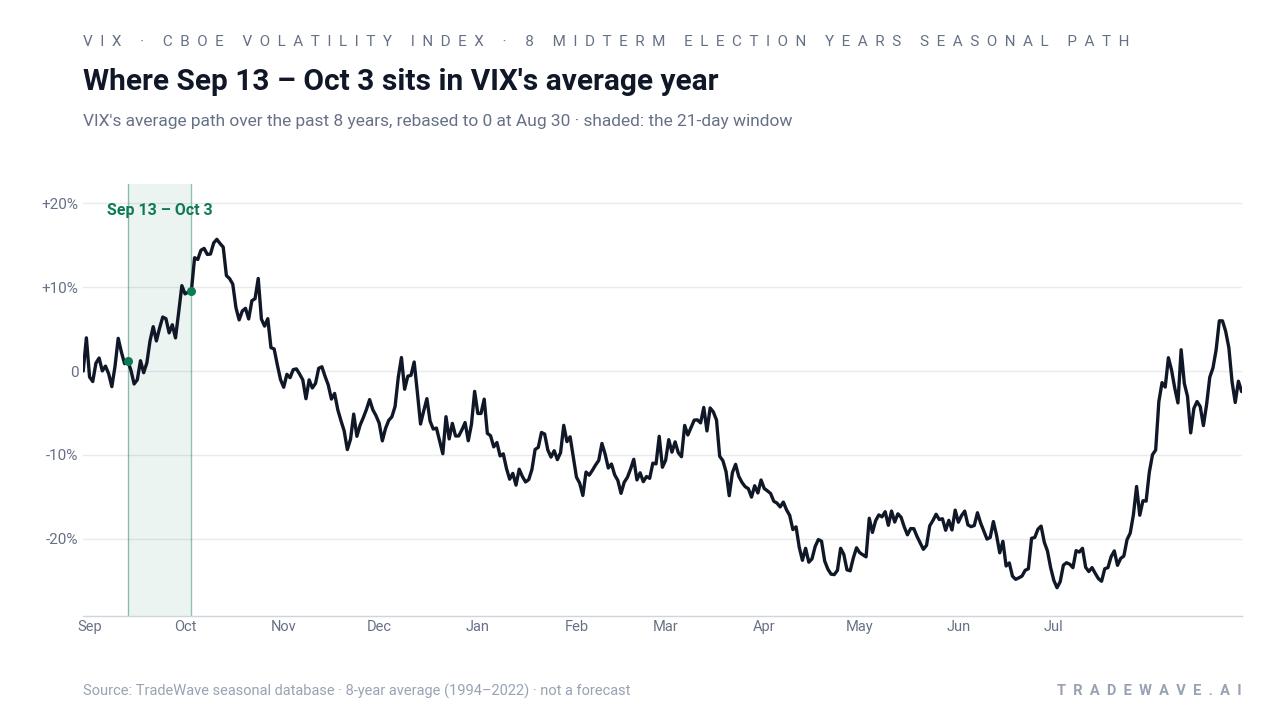
The presidential election-cycle lens matters here because this pattern is built only from the last 8 midterm election years, not from every calendar year. Pattern phase equals midterm election year, and calendar phase is also the concluding midterm election year, which is typically when policy uncertainty around fiscal debates, budget deadlines and early pre-election positioning starts to pick up.
Historically, the trade direction for this window has been long, meaning the edge has come from VIX moving higher rather than lower. Percent Profitable sits at 88%, with 7 winning years and just 1 losing year, so the win-loss record is unusually strong for a volatility index that often chops sideways. Average profit in the winning years is 8.73%, while including the losing year brings Avg Profit - All to 7%, which still points to a solid positive bias.
The per-year table shows how that plays out in practice. The strongest year in the sample is 2022, when VIX gained 10.38% over the window after an entry around 27.27, with a maximum favorable move of 27.91% and a worst drawdown of -6.78% from the entry. The weakest outcome is 2018, the lone loser, when VIX slipped 6.14% despite an 11.16% best intraperiod pop and a -10.27% adverse move before the window closed.
Those swings underline why intraperiod behavior matters as much as the final close. In 2014, for example, the index finished the window up only 3.05%, but the best run-up inside the period reached 27.34% while the worst drawdown hit -18.41%. That is a textbook high-variance volatility window: plenty of upside for traders who timed entries and exits, but also deep air pockets for anyone caught leaning the wrong way.
The maximum favorable excursion and maximum adverse excursion profiles are both large in several years, which is exactly what you would expect from a VIX seasonal trend that clusters around macro and policy catalysts. MFE readings in the mid-teens to high-20s show that when VIX breaks higher in this window, it can do so quickly. MAE readings that stretch into double digits in some years show that even in a historically bullish stretch, the index has often dipped meaningfully before turning higher.
The next chart stacks net returns with both best and worst intraperiod swings to show how wide the historical range has been.
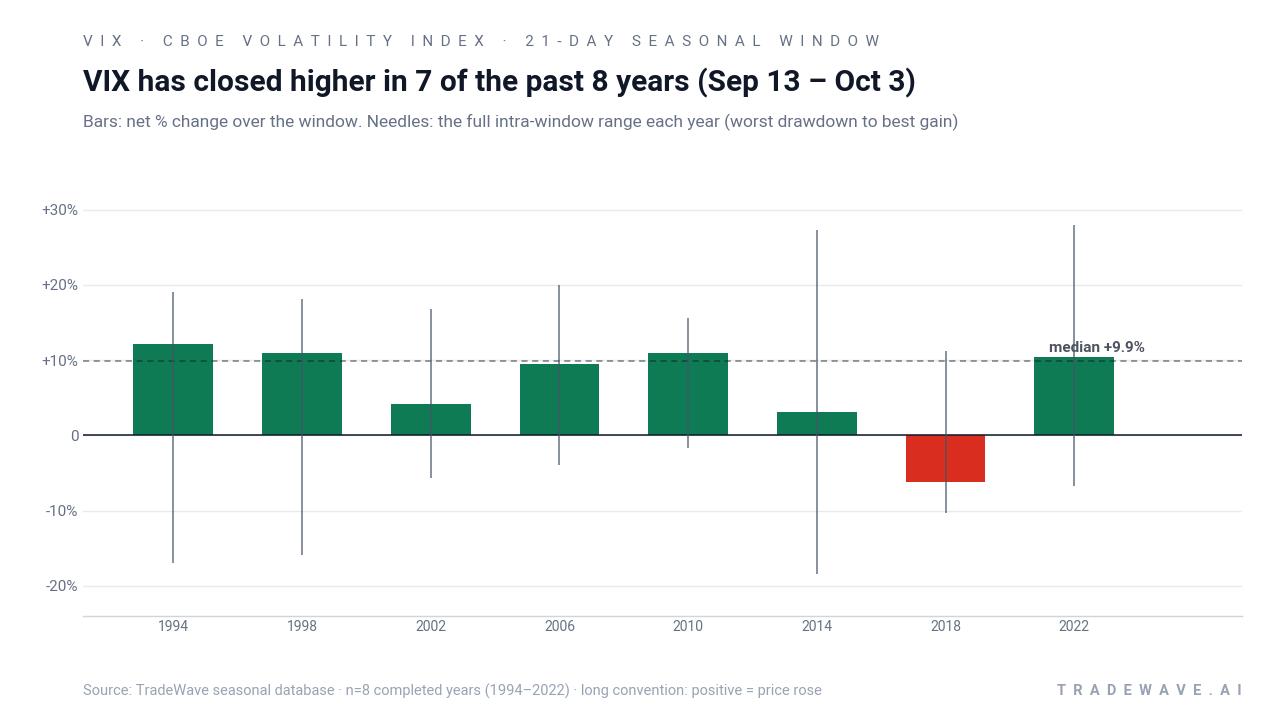
History does not guarantee future results; adverse excursions (MAE) can be large even in winning windows.
Why does CBOE Volatility Index (VIX) follow this seasonal pattern?
This late-September window in midterm election years likely reflects a mix of options expiration patterns, fiscal-year-end portfolio rebalancing and rising policy noise around Washington budget deadlines. Analysts have pointed to the way institutional investors reload equity hedges into the fourth quarter and how implied volatility often reprices as liquidity thins and macro data surprises build. None of that makes a repeat move certain, but it helps explain why this specific slice of the calendar has repeatedly delivered higher VIX readings.
What is driving CBOE Volatility Index (VIX) today?
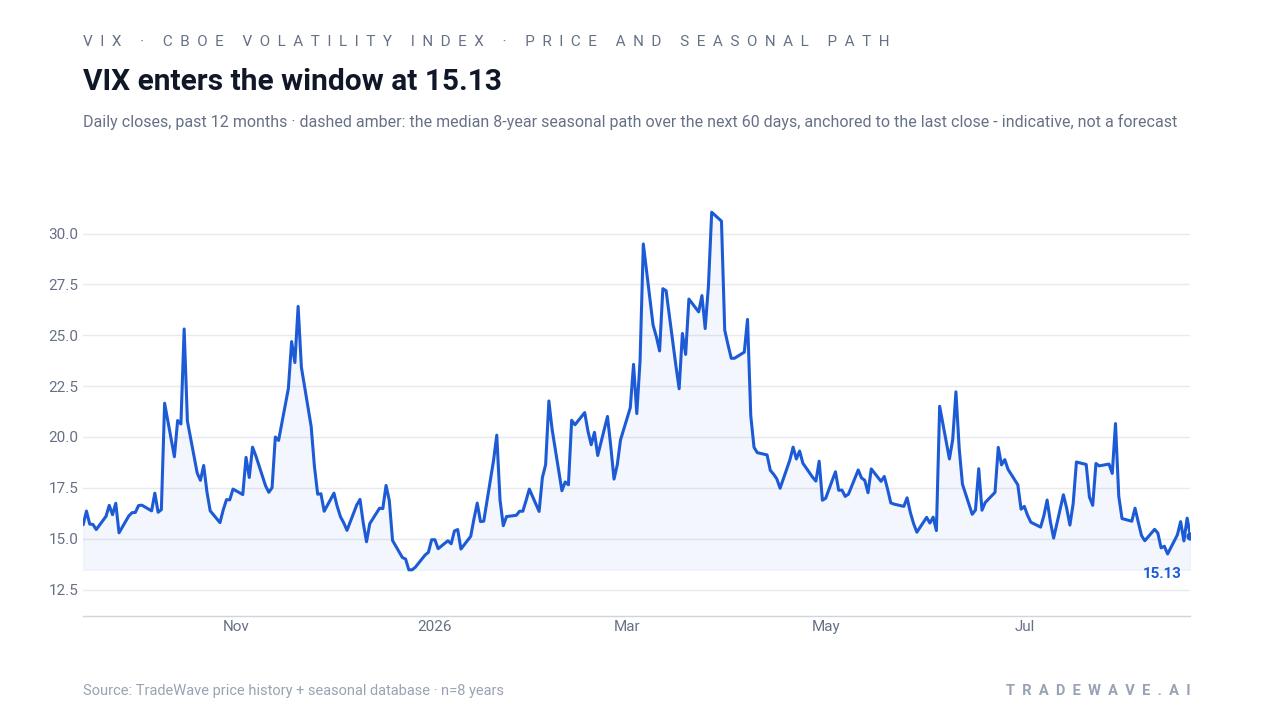
The prior session’s close at 14.92 leaves VIX up 3.4% on the day but still well below the psychologically important 20 level that many traders use as a rough line between calm and stressed markets.[2][5] That puts the index just above its 52-week low of 13.38 and far from the 35.30 high seen over the past year, a backdrop consistent with a market that has been pricing in relatively low 30-day S&P 500 volatility even as occasional spikes have appeared.[1][5]
In mid-August, commentary highlighted that market volatility as measured by VIX was “back well below 20,” which tends to reduce demand for outright volatility hedges and pushes more investors toward yield and carry trades instead.[4] Earlier in the summer, VIX briefly reached its highest level since early April, reminding traders that even in a low-vol regime, short bursts of risk-off can arrive quickly when macro headlines or positioning collide.[5] That pattern of low averages with sharp, contained spikes is exactly what has defined much of 2026 so far.
Structurally, VIX remains the market’s primary gauge of expected 30-day S&P 500 volatility, derived from options prices rather than realized index moves.[5] When equities grind higher in a tight range, implied volatility tends to compress, while abrupt equity drawdowns usually coincide with VIX surging as investors rush to buy protection.[6] The current low reading suggests investors are still comfortable with the macro and policy backdrop, but the approaching seasonal window argues that comfort has not always lasted into late September in prior midterm election years.
The chart below situates the latest move in its recent multi-month context and overlays the historical seasonal path for the next 60 days.
What should traders watch as the Sep 13–Oct 3 window approaches?
First, the calendar. The 21-day window begins on Sep 13 and runs through Oct 3, squarely in the concluding midterm election year and just ahead of the transition into the historically stronger pre-election year for equities. That timing often coincides with heavier policy and budget headlines, quarter-end positioning and a fresh round of macro data that can jolt implied volatility.
Second, levels. On the downside, the 13–14 zone has been the recent floor; a decisive break below that area during the window would contradict the historical pattern of VIX lifting in late September. On the upside, prior spikes toward the mid-20s and low-30s over the past year mark the kind of moves that have historically shown up as large maximum favorable excursions inside this seasonal window, even when the final close was more modest.[1][5]
Third, behavior relative to the pattern. If VIX grinds sideways or drifts lower through the window, it would mark only the second losing outcome in the eight-sample history and suggest that today’s low-volatility regime is proving more durable than past midterm years. If instead the index starts to stair-step higher with one or two sharp bursts, that would be more in line with the historical record of 7 winners out of 8 and average winning gains near 9%.
Finally, watch how volatility-linked ETFs and options markets respond. Products tied to VIX futures, such as long and inverse volatility ETFs, often amplify moves in the underlying index and can feed back into hedging demand when flows get one-sided.[1][7] If those flows build into the Sep 13–Oct 3 window while spot VIX lifts off its lows, it would fit the historical script of this late-midterm election-year pattern. If they stay muted and VIX remains pinned near the bottom of its range, traders may need to treat this cycle as the exception rather than the rule.
Sources
- Yahoo Finance - CBOE Volatility Index (^VIX) Components - Yahoo Finance
- Yahoo Finance - CBOE Volatility Index (^VIX) Forum & Discussion - Yahoo Finance
- Yahoo Finance - CBOE Volatility Index (^VIX) Options Chain - Yahoo Finance
- Barchart - The Low-Cost VIX Hedge Most Options Traders Ignore
- GuruFocus - VIX: 15.17 (Aug 2026) — Historical Chart & Data
- Barchart - Why is the VIX So Low?
- MarketBeat - Cboe Volatility Index (U.S.) | Stock Market Indexes
About this seasonal analysis
Seasonal pattern data is sourced from TradeWave.ai, which analyzes historical price behavior across annual calendar windows going back up to 30 years. Read the full data methodology or the book The 100-Year Pattern by Afshin Moshrefi (2026 edition). Past performance of seasonal patterns does not guarantee future results. This article is for informational purposes only and does not constitute investment advice.