S&P 500 (SPX) Near Records as Options-Driven Rally Meets 100% Profitable Midterm Stretch
The S&P 500 is hovering just below record territory as it approaches a 293-day midterm-to-pre-election seasonal window that has never posted a loss in the last 10 cycles.

What is the seasonal pattern for S&P 500 (SPX)?
S&P 500 has risen in 10 of 10 midterm-year Sep 23 to Jul 12 windows, with an average gain of 19.27% in winning years.
- 10 for 10 in this window, with S&P 500 averaging 19.27% gains across the last 10 midterm-year cycles.
- Seasonal window runs from Sep 23 and spans 293 days into the following pre-election year, covering the heart of the so‑called 100‑Year Pattern regime.
- Percent Profitable is 100%, with 10 winners and 0 losers across the historical sample.
- Median profit of 20.75% and annualized return of 18.94% point to a historically strong long bias in this SPX seasonal trend.
- TradeWave Ratio of 1.85 and a Sharpe ratio of 1.75 indicate sizable directional travel with solid risk-adjusted returns in this S&P 500 trading window.
- Individual years have still seen drawdowns inside the window, including intraperiod drops of more than 10% even in cycles that finished higher.
According to historical data from TradeWave.ai, this midterm-to-pre-election stretch has behaved very differently from an average year for the index. The next section walks through what that long seasonal regime has looked like in past cycles and how it frames the coming months.
How has S&P 500 (SPX) traded in the Sep 23 to Jul 12 midterm window?
S&P 500 has closed higher in every single Sep 23 to Jul 12 midterm-year window across the last 10 cycles, averaging 19.27% gains over 293 days. The index finished the prior session at 7,711.76, about 1.3% below its 52-week high of 7,816.70, so it is set to enter this historically powerful regime from a position near the top of its range.[1]
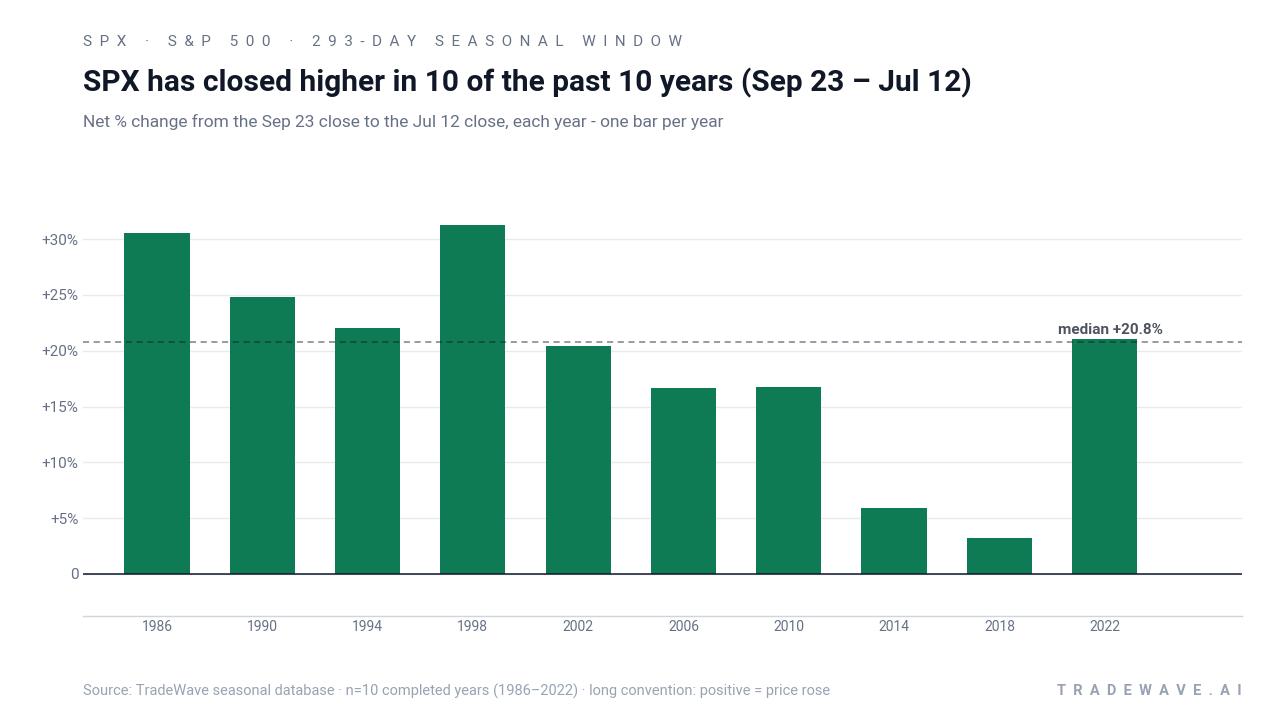
The pattern is built on the last 10 midterm election years, grouped by the presidential cycle rather than by consecutive calendar years. That means each data point reflects how SPX behaved from late September of a midterm year through mid-July of the following pre-election year, a phase that has often coincided with friendlier policy signals and improving risk appetite.[2]
Across those 10 cycles, the long trade direction has been consistently rewarded. Percent Profitable is 100%, with 10 winners and 0 losers, and the median gain of 20.75% sits slightly above the average, which suggests the distribution has not been skewed by a single outlier year. The weakest outcome in the sample still delivered a 3.23% gain in 2018, while the strongest year, 1998, posted a 31.24% advance from entry to exit.
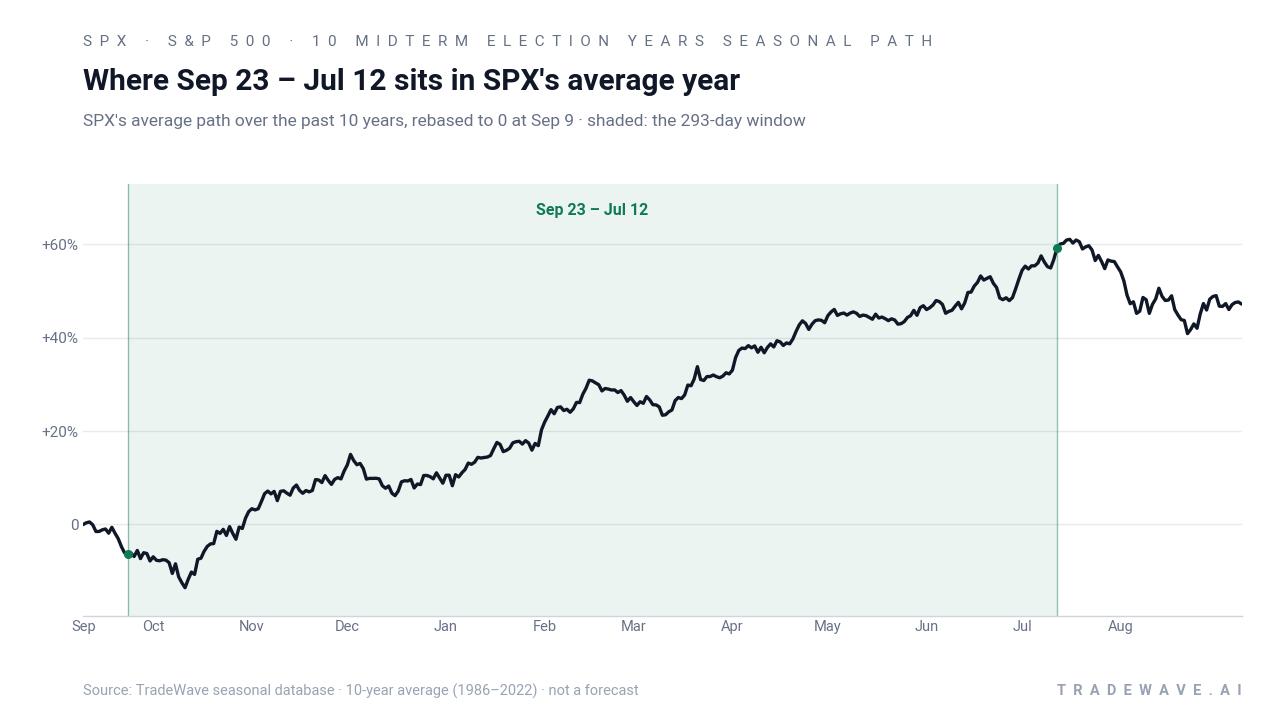
The historical seasonal average shows the index tending to grind higher through much of the window, with gains building steadily rather than arriving in a single burst. Trend statistics back that up: the pattern logs 48 “trend long” readings versus just 2 “trend short,” and a similar skew in the alternative trend view, which points to persistent upside bias rather than choppy mean reversion.
Year-by-year ranges show how much SPX has typically swung inside the window before finishing higher.
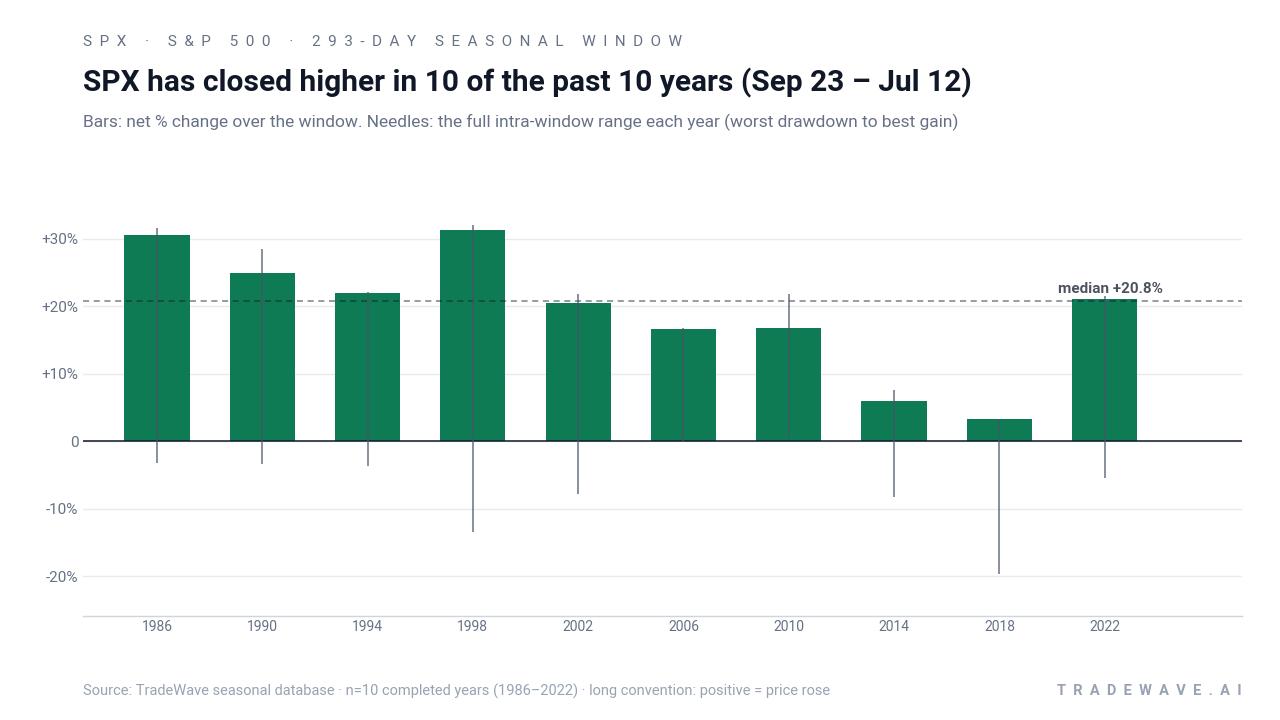
The bar-and-needle profile highlights that even in winning years, the ride has not been smooth. Maximum favorable moves have often pushed into the low-20% to low-30% range, while maximum adverse moves have at times reached double-digit drawdowns, such as a roughly 19.6% intraperiod drop in 2018 before the window still finished positive. That combination of sizable peak gains and meaningful setbacks fits with a TradeWave Ratio of 1.85 and a Sharpe ratio of 1.75, pointing to a window where upside has historically outweighed volatility but where risk management still mattered.
Stacking the 293-day window back-to-back across the 10 midterm cycles compounds to a cumulative gain of about 466%, underscoring how powerful this specific slice of the calendar has been for long exposure. In other words, if an investor had only been in the market during this midterm-to-pre-election stretch across those years, they would have captured a large share of the index’s long-run advance.
This upcoming window also sits inside the broader midterm-to-pre-election seasonal regime often referred to as the 100-Year Pattern, a roughly 295-day span that has historically delivered unusually strong S&P 500 performance since 1930. The current setup lines up with that long-run template: a choppy first half of the midterm year followed by a historically friendlier backdrop from late September into the following summer.[2]
History does not guarantee future results, and intraperiod drawdowns have at times been large even in years that ultimately finished higher.
Why does S&P 500 (SPX) follow this seasonal pattern?
One likely driver is the way the policy and earnings calendar lines up in the midterm-to-pre-election phase. Analysts have pointed to a mix of reduced political uncertainty after midterm votes, fiscal support, and improving earnings breadth as factors that often support risk assets in this stretch.[2] The pattern may also reflect institutional portfolio repositioning as investors lean back into equities once early-midterm volatility has cleared, reinforcing a historical seasonality that has favored longs in this window.
What is driving S&P 500 (SPX) today?
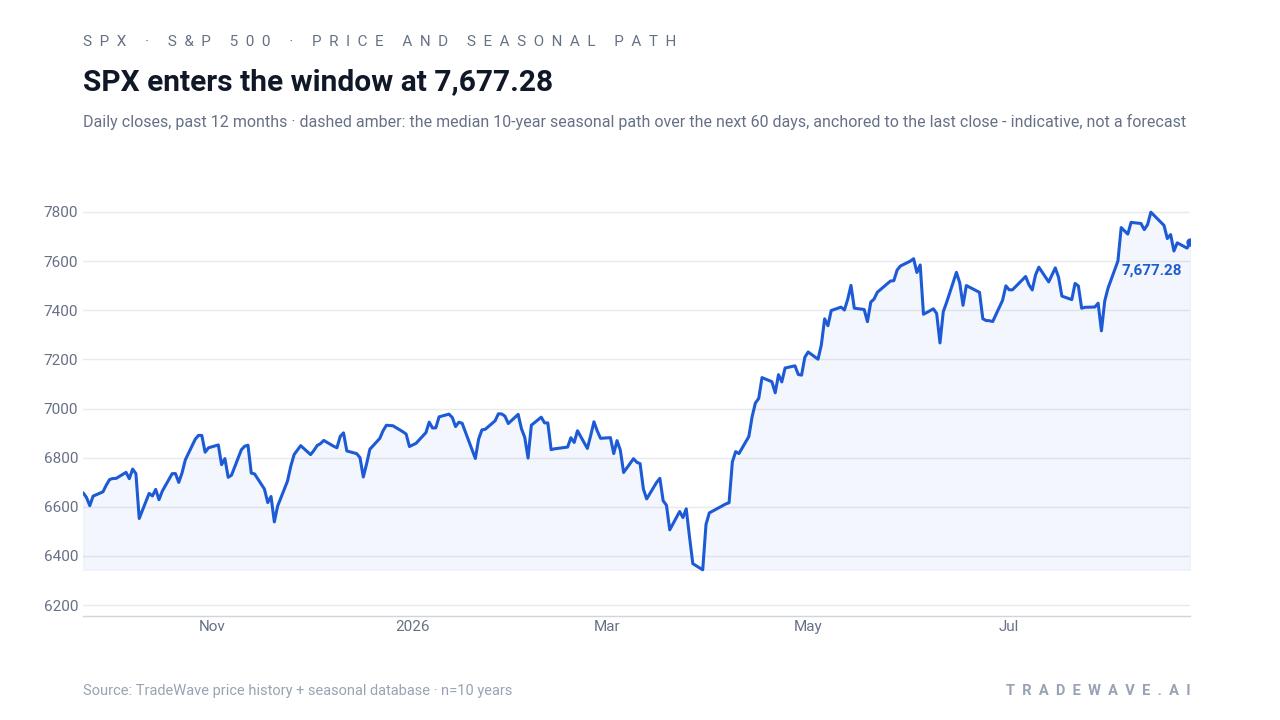
S&P 500 slipped 0.25% in the prior session to 7,711.76, leaving it about 1.3% below its 52-week high and still comfortably above support zones that options traders have been watching around 7,400 to 7,500.[1][6][7] The pullback comes after one of the strongest earnings stretches in decades, with blended growth running in the mid-20% range and a high share of companies beating estimates, but strategists warn that growth is now above trend and decelerating, a mix that has historically led to more muted forward returns when valuations are rich.[2]
In early May 2026, FactSet-based tallies showed roughly 84% of S&P 500 companies beating EPS estimates and about 81% topping revenue forecasts, helping push blended earnings growth to around 27% and fueling the index’s climb to record territory.[3][4] That strength has lifted 2026 and 2027 profit expectations, but it also raises the bar for future quarters at a time when higher-for-longer interest rates and a wave of AI-related IPO supply are front of mind for equity investors.[2]
Options-market structure has been another key driver. Fresh analysis in August highlighted how aggressive call buying and dealer gamma positioning helped power the latest leg of the rally, with 7,800 flagged as a technical ceiling and 7,400 as a key support zone tied to options concentrations.[6] In July, traders were already focused on a “risk pivot” near 7,500, where shifts in dealer hedging could amplify moves in either direction if positive gamma flips negative.[7]
Back in June 2026, Bank of America technicians also pointed to a cooled 14-day RSI and a TD Sequential exhaustion signal as signs that a “three-wave” correction might be forming, a reminder that even in strong years, the index can experience meaningful shakeouts before resuming its trend.[5] Layered on top of that, macro strategists have stressed that elevated policy rates and stretched multiples make paying peak valuations for peak earnings more fragile, especially if earnings growth slows or if heavy new issuance from AI and tech listings soaks up demand.[2]
The chart below shows how the latest pullback fits into the past year’s climb and the median seasonal path over the next two months.
What should traders watch as this seasonal window approaches?
First, the calendar: the 293-day window opens on Sep 23 and runs deep into the 2027 pre-election year, overlapping a phase that has historically delivered strong risk-on behavior for SPX. Traders will be watching whether the index can hold above the 7,400 to 7,500 “risk pivot” band as that date approaches, since prior cycles show that when this window moves, it often moves quickly.[6][7]
Second, earnings and macro data. The historical pattern has thrived when earnings breadth stays wide and policy uncertainty fades, so upcoming profit reports, inflation prints, and any hints on the rate path will be key tests of whether the backdrop still rhymes with prior midterm-to-pre-election cycles.[2] A sustained break of the options-defined support zone or a sharp deterioration in earnings revisions would be an early sign that this cycle may diverge from the textbook seasonal script.
Finally, volatility inside the window. Past years show that even in a 10-for-10 winning stretch, intraperiod drawdowns can be sharp, with some cycles seeing double-digit declines before recovering. How SPX behaves on the next sizable pullback, and whether buyers step in near the historical support bands, will tell traders whether the long-running seasonal edge is still being respected or starting to fade.
Sources
- Yahoo Finance - S&P 500 INDEX (^SPX) Interactive Stock Chart - Yahoo Finance
- Yahoo Finance - S&P 500 Earnings Are So Good Investors Are Starting to Worry
- Yahoo Finance - One of the S&P 500's best earnings seasons in 20 years comes with a catch: Chart of the Day
- Yahoo Finance / Fortune (syndicated) - 84% of S&P 500 companies have beaten earnings estimates this quarter—and these two words keep coming up
- Yahoo Finance - BofA warns the S&P 500 is flashing technical signals that a 'three-wave' stock correction is underway
- Morningstar / MarketWatch syndication - Aggressive options trading helped drive the S&P 500's latest rally. What that means for investors.
- CNBC - As the S&P 500 sells off, traders eye key 'risk pivot' level
About this seasonal analysis
Seasonal pattern data is sourced from TradeWave.ai, which analyzes historical price behavior across annual calendar windows going back up to 30 years. Read the full data methodology or the book The 100-Year Pattern by Afshin Moshrefi (2026 edition). Past performance of seasonal patterns does not guarantee future results. This article is for informational purposes only and does not constitute investment advice.