9-for-9 Midterm Run: Nasdaq 100 (NDX) Enters a 300-Day Window With 100% Profitable Years
Nasdaq 100 is sliding from record territory just weeks before a 300-day midterm-year seasonal window that has never been negative in this dataset, putting a powerful historical tailwind on traders’ radar.
Price as of Sep 1, 2026: $29,077.22 (last close).

What is the seasonal pattern for Nasdaq 100 (NDX)?
Nasdaq 100 has risen in 9 of 9 midterm-year windows starting around Sep 25, with an average gain of 33.25% in winning years.
- 9 for 9 in this window, with Nasdaq 100 averaging 33.25% gains across all winning years.
- The upcoming pattern runs roughly from Sep 25 to late July, spanning 300 calendar days in midterm election years.
- Percent Profitable is 100%, with 9 winners and 0 losers across the last 9 midterm election-year cycles.
- Average profit in winning years is 33.25%, with a median outcome of 37.07% and cumulative compounded gains of 1,116% across the sample.
- The TradeWave Ratio of 1.52 and Sharpe ratio of 1.54 point to strong upside travel in the trade direction with solid risk-adjusted returns.
- Individual years have still seen double-digit drawdowns inside the window, so the path has not been a straight line even in winning cycles.
According to historical data from TradeWave.ai, this midterm-year stretch has behaved very differently from an average calendar year for the Nasdaq 100. The next section walks through how that pattern has played out and why the late-September start date matters for index traders.
How has Nasdaq 100 (NDX) traded in the Sep 25 to late-July window?
Nasdaq 100 has closed higher in every one of the last 9 midterm election-year windows starting around Sep 25, with average gains north of 30% and no losing cycles in this sample. The index finished the prior session at 29,077.22, down 1.3% on the day and about 5.5% below its 52-week high of 30,762.20, after a strong one-month run of 2.36% that left it near record territory. That combination of a powerful historical tailwind and a market that is already elevated is what makes this particular seasonal regime worth watching as the calendar moves toward late September.
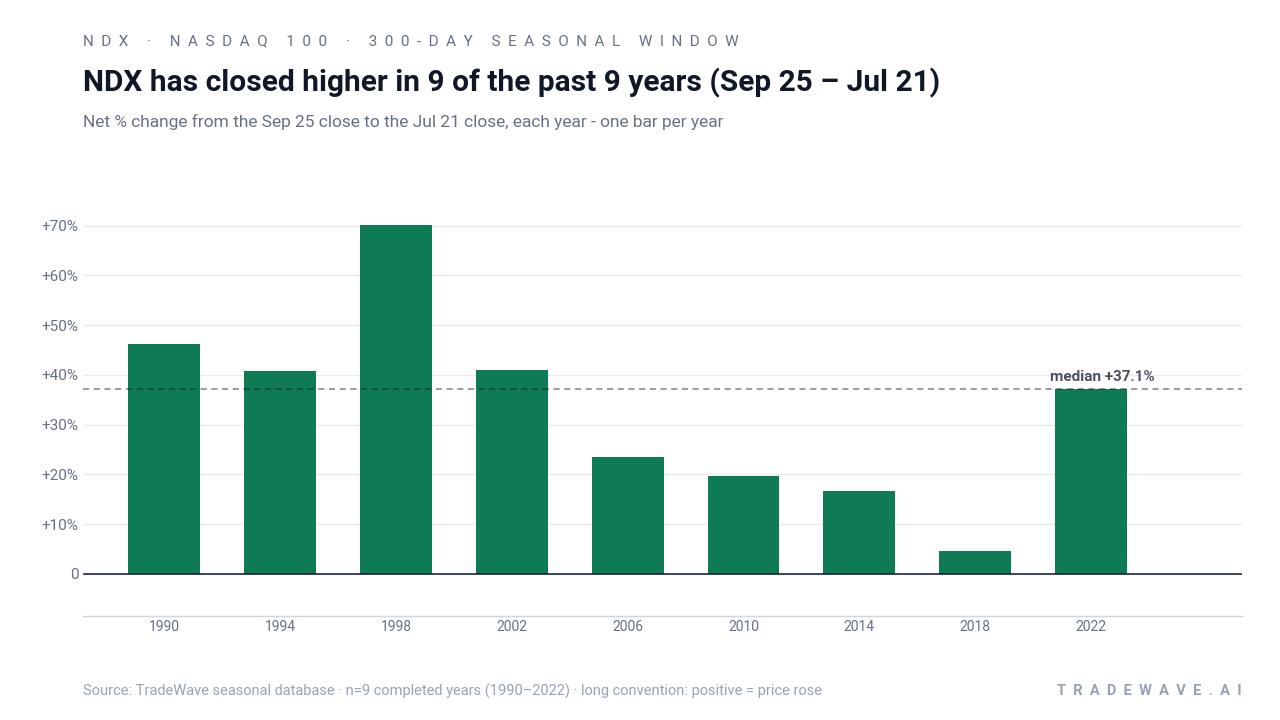
The pattern is built on the last 9 midterm election years, a phase where policy uncertainty often peaks before giving way to a more supportive backdrop as the year before the presidential election begins. Grouping by the presidential cycle rather than simple calendar years matters here because fiscal stance, regulation risk and liquidity conditions tend to rhyme across midterm years, and that has historically lined up with a distinct “late-September to summer” playbook for the Nasdaq 100.
Across those 9 midterm-year windows, the trade direction is long and the record is clean: 9 winners, 0 losers, for a Percent Profitable reading of 100%. Average profit across all years is 33.25%, with a median outcome of 37.07%, so the typical winning cycle has not been a marginal grind higher but a sizable move. Add it up and stacking those windows compounds to roughly 1,116% cumulative gains, which is why this slice of the calendar stands out even in a long-term bull market for large-cap tech.
The per-year table shows how that strength has played out in practice. The standout year was 1998, when the Nasdaq 100 gained 70.03% between the late-September entry and the following July exit, with a maximum favorable move of 77.57% and a maximum adverse move of -23.51% along the way. On the softer end of the spectrum, 2018 still finished positive at 4.52%, but it carried a -22.06% worst drawdown inside the window, a reminder that even “winning” midterm-year seasons can feel brutal in real time.
Looking across all cycles, the maximum favorable excursion, or MFE, has often been meaningfully larger than the final net gain, which is what the TradeWave Ratio of 1.52 is flagging. That metric captures how far price typically travels in the trade direction within the window, independent of where it closes, and a reading above 1 suggests that intraperiod rallies have tended to overshoot the final result. At the same time, maximum adverse excursions, or MAE, have reached double digits in several years, so the path to those strong finishes has involved real downside volatility.
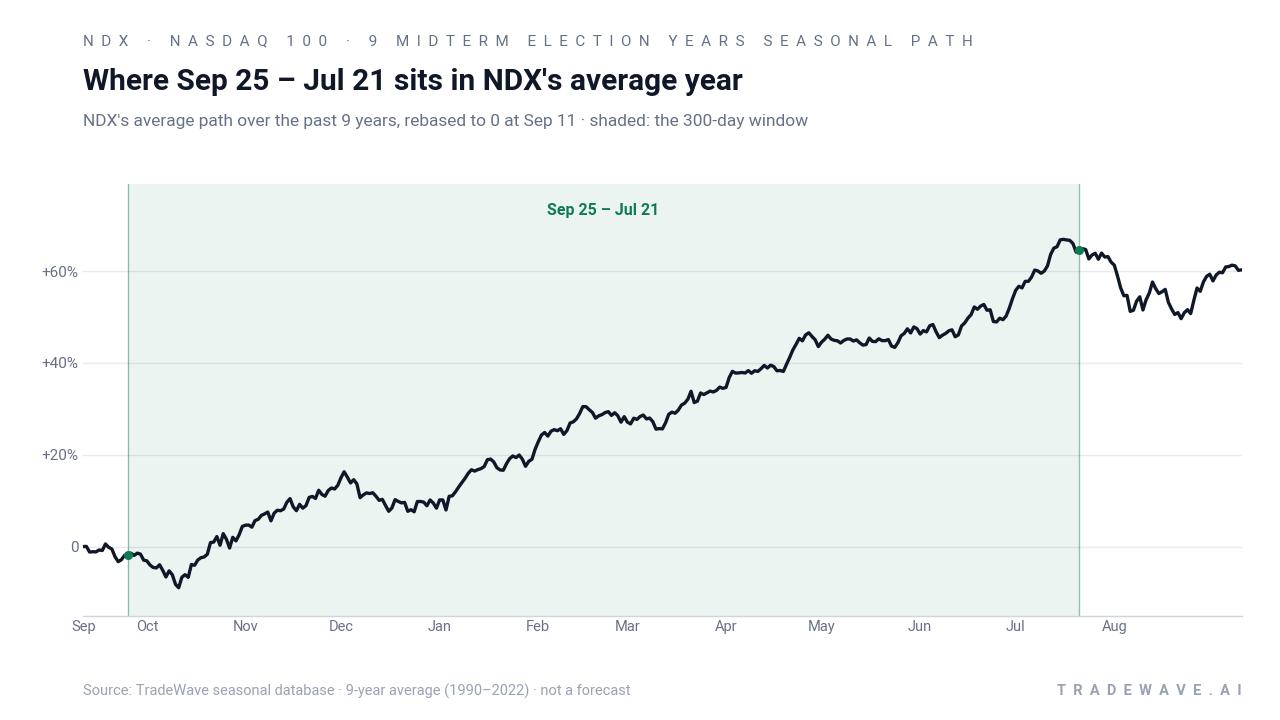
The historical seasonal average chart suggests that, on average, the Nasdaq 100 has tended to firm up soon after the late-September start, with gains accruing through year-end and then extending into the first half of the year before the presidential election. The profile is not a straight line, but the bias is clearly upward across most of the 300-day stretch, which is unusual for such a long window.
Year-by-year ranges show how those average gains have coexisted with sizable swings both up and down inside the window.
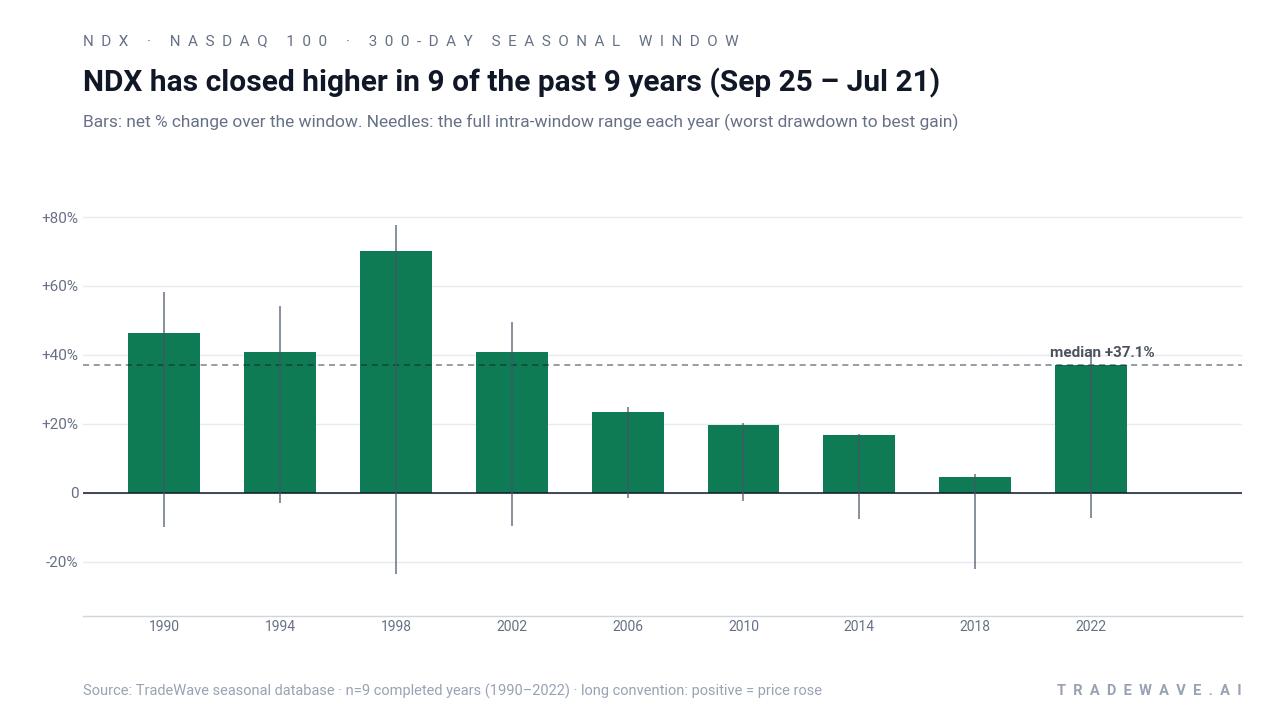
The combined net / MFE / MAE view makes the trade-off clear. In strong years like 1990, 1994, 1998, 2002 and 2022, the Nasdaq 100 not only finished with gains between roughly 37% and 70% but also saw peak run-ups that pushed even higher before settling back. Yet several of those same years carried worst drawdowns between about -7% and -23%, underscoring that the path has been volatile even when the final scorecard looked impressive. The pattern is clear: this window has favored longs in every midterm-year sample so far, but it has not spared them from sharp pullbacks along the way.
History does not guarantee future results; adverse excursions (MAE) can be large even in winning windows.
Why does Nasdaq 100 (NDX) follow this seasonal pattern?
One likely driver is the way the policy calendar and earnings cycle line up between late September of a midterm election year and the following summer. Analysts often point to midterm-year volatility giving way to a more supportive backdrop as election uncertainty clears, fiscal plans firm up and the Federal Reserve’s path becomes clearer, which can encourage risk-taking in growth and technology stocks. This window also captures multiple earnings seasons and year-end portfolio rebalancing, so institutional flows and sector rotation into higher-beta names may help reinforce the historical Nasdaq 100 seasonal trend.
What is driving Nasdaq 100 (NDX) today?
The Nasdaq 100 slipped 1.3% in the prior session to 29,077.22, backing off from a 52-week high of 30,762.20 as rising global bond yields pressured growth stocks. The move came after a strong August in which the major U.S. indices, including the Nasdaq, still managed to log a winning month even as investors digested higher Treasury yields and swings in oil prices.[1][2] Within the index, heavyweight technology and AI-linked names remain central to the story, with recent coverage highlighting chipmakers and platform companies that continue to drive both earnings expectations and day-to-day volatility for the benchmark.[1]
The chart below situates the latest pullback against the past year of trading and a typical seasonal path over the next two months.
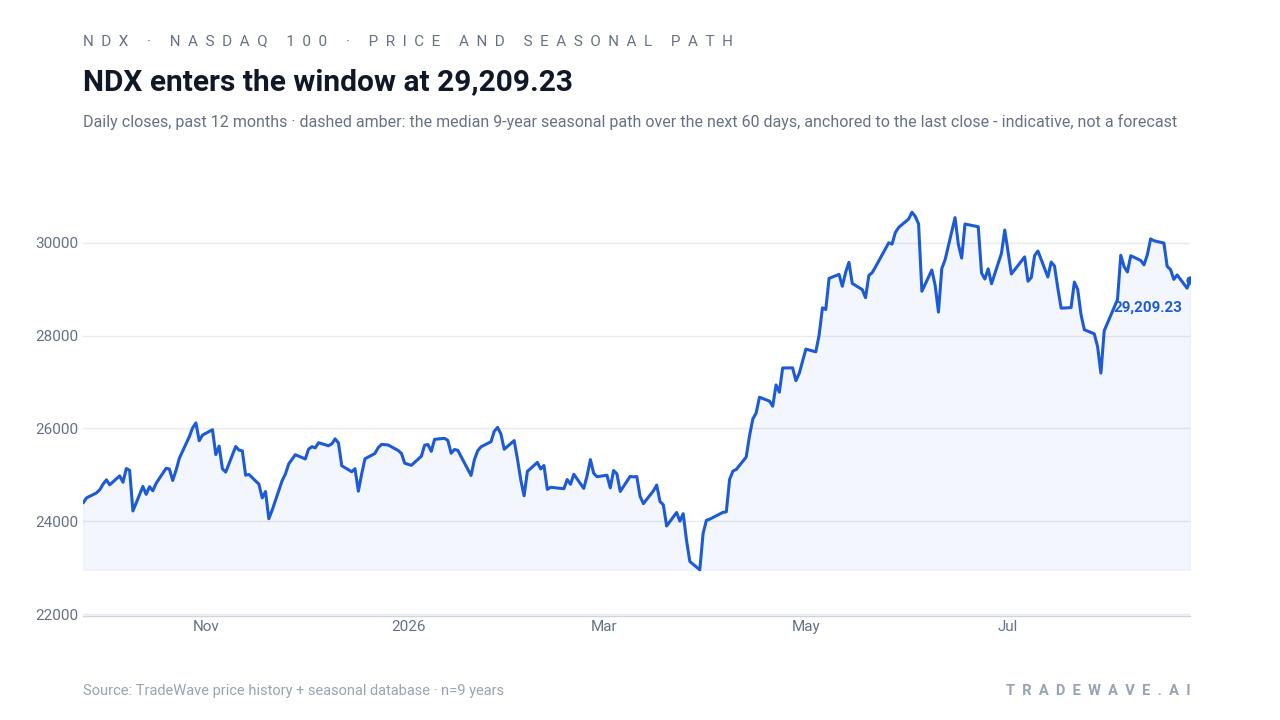
Macro remains the main swing factor. Higher long-term yields have tightened financial conditions and weighed on richly valued growth stocks, while geopolitical tensions and moves in crude oil have added another layer of uncertainty for risk assets.[2] For Nasdaq 100 traders, that backdrop collides with a historically strong late-September to summer seasonal regime, creating a tension between near-term rate worries and a longer-term pattern that has repeatedly favored staying long through the midterm-to-pre-election transition.
What should traders watch as the Sep 25 window approaches?
First, the calendar. The current pattern phase is the late part of the midterm election year, and the upcoming 300-day window bridges directly into the year before the presidential election, which has often been one of the strongest phases for U.S. equities. How policymakers handle rates, fiscal debates and regulation into year-end will shape whether this cycle rhymes with prior midterm-to-pre-election transitions or breaks the mold.[2]
Second, levels and volatility. With the Nasdaq 100 sitting roughly 5.5% below its 52-week high after a 2.36% one-month gain, traders will be watching whether pullbacks into late September are shallow consolidations or the start of something deeper. Historically, even winning windows have tolerated intraperiod drawdowns of 10% to 20%, so a sharp shakeout would not, by itself, contradict the seasonal pattern.
Third, sector leadership. The index’s heavy tilt toward technology and AI means that any shift in sentiment around chipmakers, cloud platforms or mega-cap software could either amplify or blunt the usual seasonal tailwind.[1] If those names continue to attract flows into the fall, the historical pattern of strong midterm-year windows has more room to assert itself; if they roll over on earnings or guidance, the path could look choppier even if the window ultimately finishes higher.
Finally, behavior inside the window. In prior cycles, the strongest years often saw the Nasdaq 100 firm up soon after the late-September start and then build gains through the first half of the following year. If this time around the index instead spends the early part of the window making lower lows or failing to hold rallies, that would be an early sign that the historical script is not being followed. For traders who track seasonality, the key tell will be whether pullbacks into the window are bought aggressively, as they often have been in past midterm-year cycles, or whether sellers stay in control despite the usual late-September tailwind.
Sources
About this seasonal analysis
Seasonal pattern data is sourced from TradeWave.ai, which analyzes historical price behavior across annual calendar windows going back up to 30 years. Read the full data methodology or the book The 100-Year Pattern by Afshin Moshrefi (2026 edition). Past performance of seasonal patterns does not guarantee future results. This article is for informational purposes only and does not constitute investment advice.