7-for-7 Midterm Run: S&P 500 SPDR (SPY) Enters a 303-Day Window Averaging 18% Gains
S&P 500 SPDR is hovering just below record territory as it approaches a 303-day midterm-to-pre-election seasonal window that has historically delivered strong gains and sizable swings.

What is the seasonal pattern for S&P 500 SPDR (SPY)?
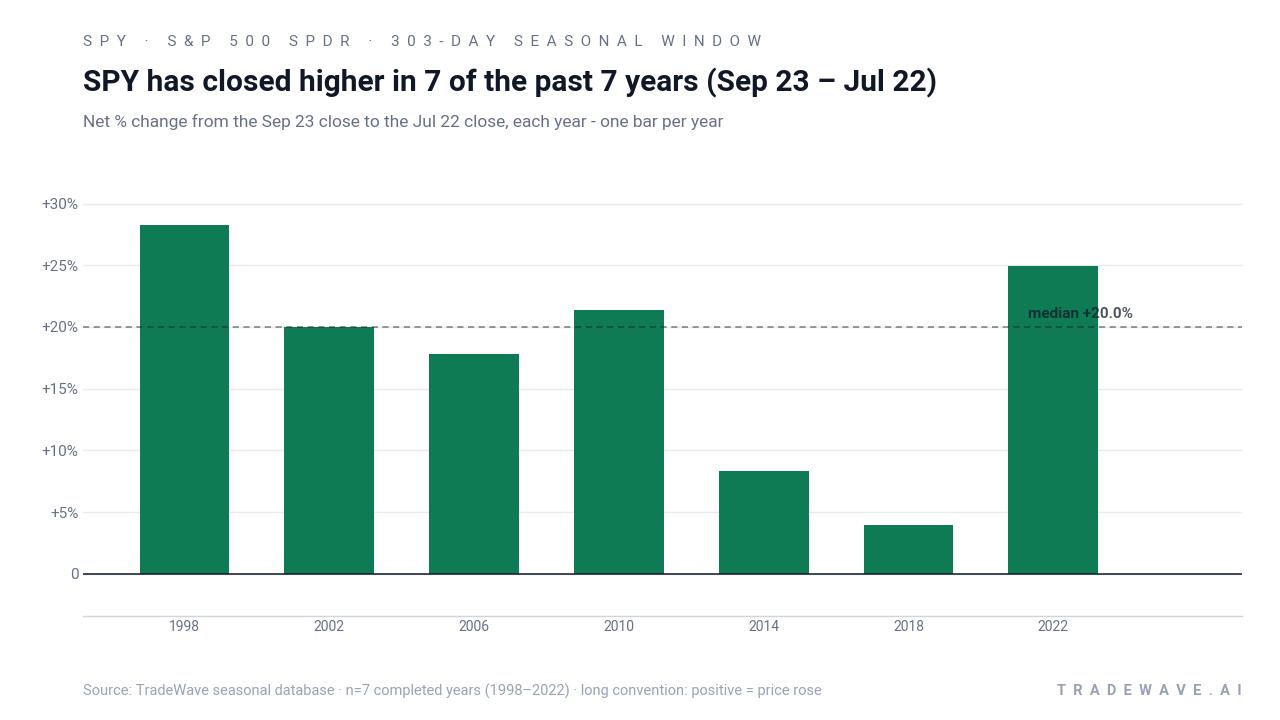
S&P 500 SPDR has risen in 7 of 7 midterm-to-pre-election year windows from Sep 23 to Jul 22, with an average gain of 17.81% in winning years.
- 7 for 7 in this window, with S&P 500 SPDR averaging 17.81% gains across winning years over the 303-day span.
- Percent Profitable is 100%, with 7 winners and 0 losers across the last seven midterm election years captured in this pattern.
- The upcoming window runs from Sep 23, 2026 through Jul 22, 2027, covering the transition from the concluding midterm election year into the pre-election year.
- Average profit across all years matches the winners-only figure at 18%, underscoring how consistently the SPY seasonal trend has skewed higher in this stretch.
- Historical drawdowns inside the window have still been meaningful, with some years seeing double-digit adverse moves before finishing higher.
- Trade Direction is long, with a TradeWave Ratio of 1.67 and a Sharpe ratio of 1.66, pointing to a historically favorable but volatile S&P 500 SPDR trading window.
According to historical data from TradeWave.ai, this late-September through July stretch has behaved very differently from an average year for SPY, and the next iteration is about to open.
How strong is the upcoming seasonal window for S&P 500 SPDR (SPY)?
The seasonal window that begins on Sep 23 and runs 303 days into late July has produced gains for S&P 500 SPDR in every one of the last seven midterm election years, averaging 17.81% per cycle. SPY last closed at 765.29, leaving it about 1.8% below its 52-week high of 779.37 and well above its 52-week low of 626.05.[4][9] That combination of a powerful historical seasonality and a market sitting near the top of its range is why this window matters for anyone watching the S&P 500’s next leg.
Grouping the data by the presidential election cycle matters here because this window straddles the end of the midterm election year and the start of the year before the presidential election, a phase that has often coincided with friendlier policy tone and stronger risk appetite. In this case, the 303-day span from Sep 23 to Jul 22 sits squarely inside the long midterm-to-pre-election regime often referred to as the “100-Year Pattern,” which has historically been one of the S&P 500’s most reliable bullish stretches.
Trade Direction for this pattern is long, and the track record is unusually clean. Percent Profitable sits at 100%, with 7 winners and 0 losers across the last seven midterm election years that match this phase. Average profit across all years is 18%, very close to the 17.81% average gain in winning years, which tells you there has not been a hidden tail of small losses offsetting a few big rallies.
The per-year table shows how that plays out in practice. The strongest cycle in this sample was 1998, when SPY gained 28.23% between late September and late July, with a maximum favorable move of 34.11% and a maximum adverse move of 13.81% from the entry. The softest outcome was 2018, which still finished up 3.92% but saw a worst intraperiod drawdown of 19.21%, a reminder that even “all green” windows can feel rough in real time.
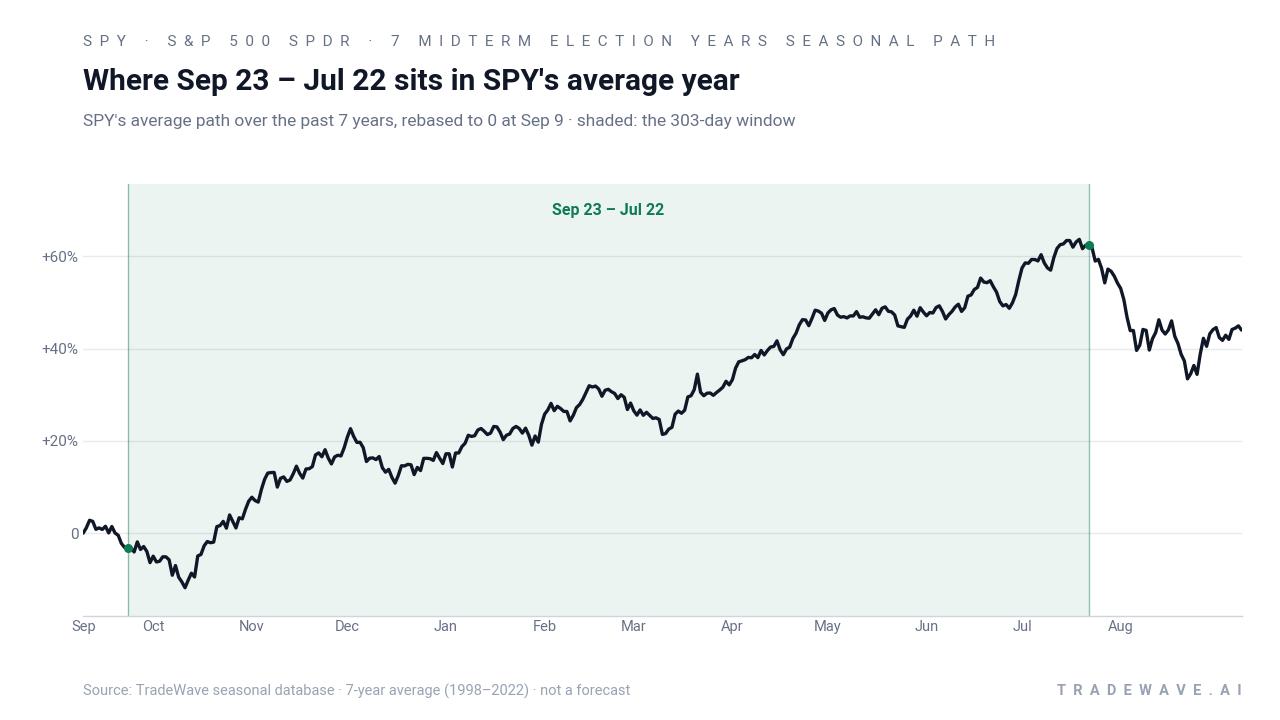
The historical seasonal average suggests that gains in this window tend to build steadily rather than arriving in a single burst. The shaded 303-day span in the trend chart climbs almost monotonically higher, with only modest pauses, which is unusual for an index that often chops sideways for long stretches.
A second view shows how each year’s upside and downside swings have stacked up inside the window.
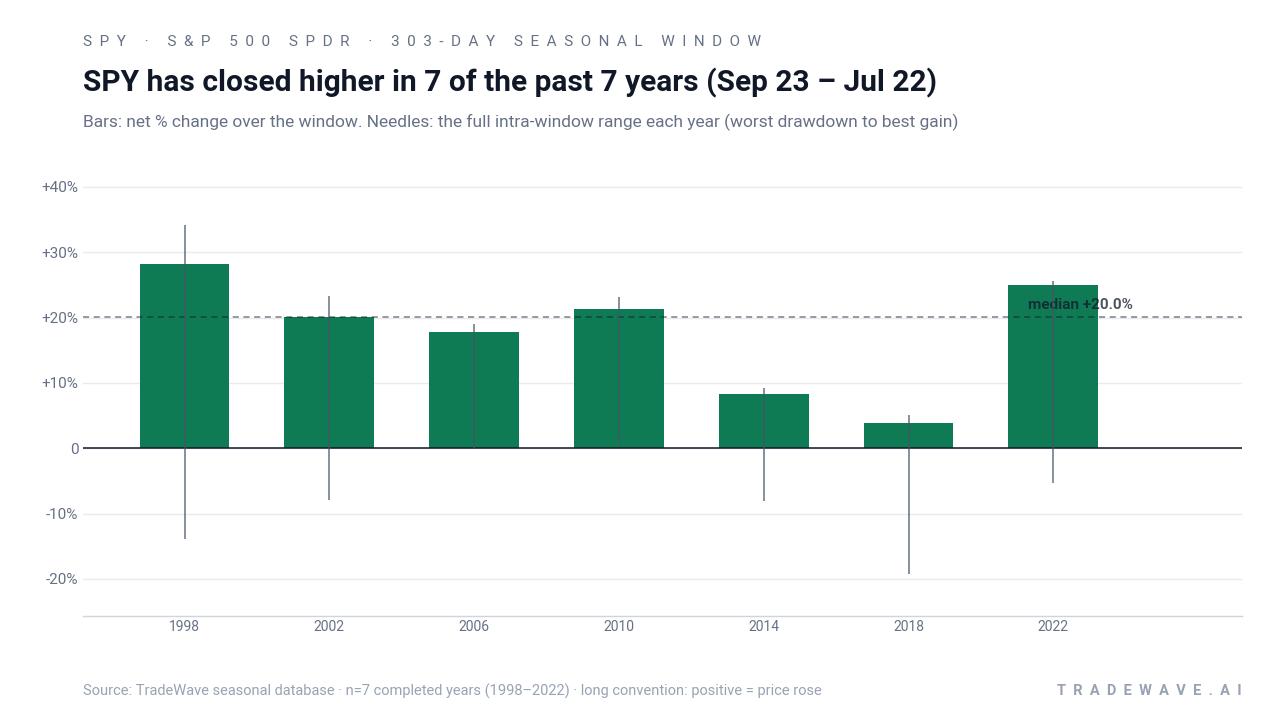
The stacked net, best-case and worst-case excursions show a clear pattern. Maximum favorable moves have often run into the low- to mid-20% range, while maximum adverse moves have typically stayed in single digits, with 2018 the main outlier on the downside. That profile lines up with the 1.67 TradeWave Ratio and 1.66 Sharpe ratio, which together describe a window where upside has historically dominated but where volatility can still bite along the way.
History does not guarantee future results; adverse excursions can be large even in winning windows, and a 100% hit rate over seven cycles does not eliminate the risk of a different outcome this time.
Why does S&P 500 SPDR (SPY) follow this seasonal pattern?
One likely driver is the way the policy and earnings calendar lines up between the back half of a midterm election year and the following pre-election year. Analysts often point to a combination of reduced policy uncertainty after midterms, fiscal support that ramps ahead of presidential campaigns, and stronger earnings breadth as companies guide into the next cycle.[1][2][5] This pattern may also reflect institutional portfolio repositioning, as large allocators add equity risk once the early midterm volatility phase has passed and the macro backdrop looks more predictable.
What is driving S&P 500 SPDR (SPY) today?
SPY finished the prior session at 765.29, up 0.46% on the day and sitting about 1.8% below its 52-week high of 779.37, after a modest pullback over the past month that has left the ETF roughly flat on a 30-day view.[3][4][9] The move comes as traders digest a firm message on price stability from Jackson Hole and brace for an August labor market report that could cement expectations for another Federal Reserve rate hike in September, a combination that keeps macro volatility in play even with the index near record levels.[2]
Macro commentary in late August has focused on whether sticky core inflation and a still-tight jobs market will force the Fed to keep policy restrictive for longer, a backdrop that can pressure valuations even when earnings growth from mega-cap leaders remains solid.[1][2][5] At the same time, breadth indicators show that SPY’s strength has increasingly leaned on a narrow group of large-cap winners, while many other sectors lag, a divergence that leaves the ETF vulnerable if leadership stumbles.[4]
The chart below situates the latest move in its recent multi-month context alongside the median seasonal path for the next 60 days.
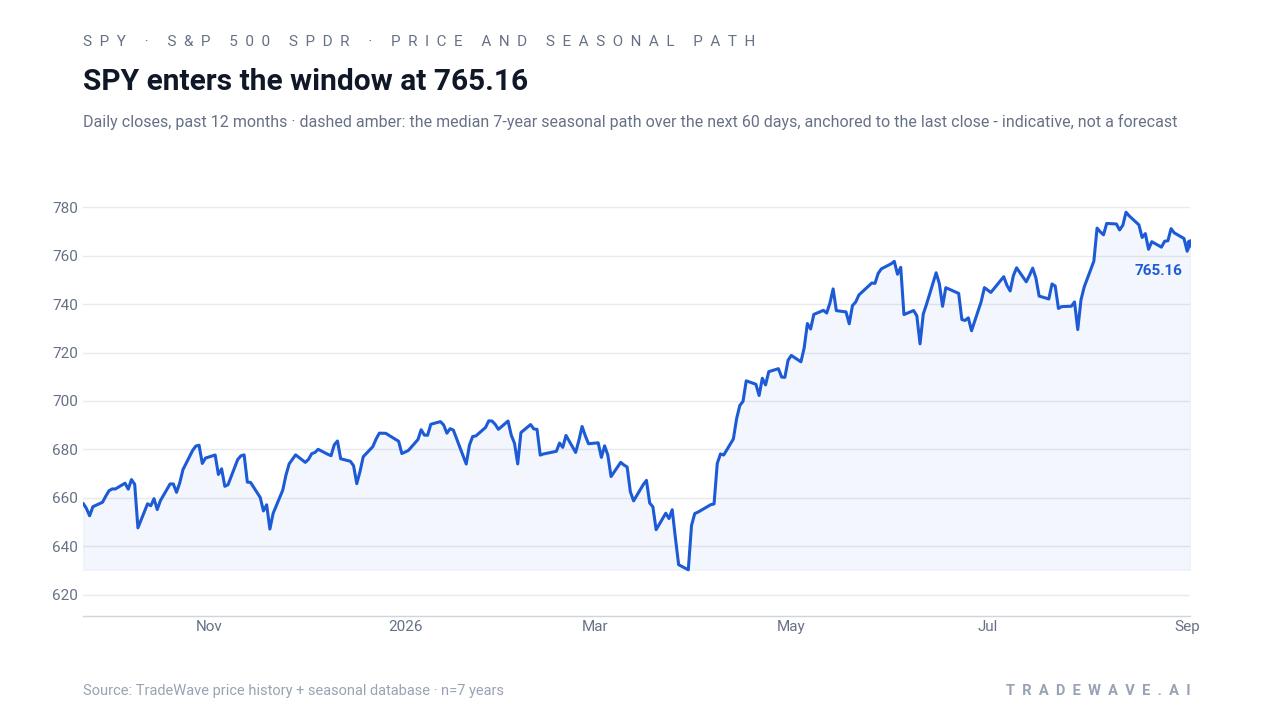
For context, SPY’s 20-day average volume sits around 36.5 million shares, and the ETF continues to trade comfortably above its 50-day moving average near 755.34, a sign that the prevailing uptrend remains intact despite intermittent pullbacks.[4] Options data show active put and call positioning but no single, clearly documented spike in unusual activity, suggesting that hedging and speculation are elevated but not extreme by recent standards.[8]
What should traders watch as this SPY seasonal window opens?
The first checkpoint is the calendar itself. The 303-day window kicks off on Sep 23, just as the market moves from the concluding midterm election year into the pre-election year, a phase that has historically been friendlier for equities. How SPY behaves around that handoff, especially through the early Fed meetings and key inflation prints of the fall, will show whether this cycle is tracking the historical midterm-to-pre-election script or breaking away from it.[1][2]
Second, levels matter. On the upside, traders will be watching whether SPY can sustain a break above its 52-week high near 779, which would keep the current bull trend aligned with the long-term seasonal bias. On the downside, any pullback that drives the ETF back through its 50-day moving average and toward the low 700s with expanding volume would signal that this iteration of the window may feature a deeper early drawdown, similar to 2018’s path.
Third, the macro and policy calendar will be critical. A hotter-than-expected labor report or renewed inflation surprise that forces the Fed into a more aggressive stance could compress valuations and test the resilience of this historically strong window.[2] Conversely, evidence that inflation is cooling without a sharp deterioration in growth would fit the pattern of prior cycles, where policy uncertainty faded and risk appetite improved as the pre-election year approached.
Finally, breadth and leadership inside SPY will be a tell. If gains during the window broaden beyond the current handful of mega-cap drivers and sector participation improves, that would echo prior midterm-to-pre-election rallies where the S&P 500’s advance was both strong and durable.[4][5] If instead leadership narrows further or begins to crack while the index grinds sideways, it would be an early sign that this cycle may diverge from the 7-for-7 record, even if the long-term seasonal tendency still points higher.
Sources
- Seeking Alpha - State Street SPDR S&P 500 ETF Trust (SPY) Latest Stock Analysis | Seeking Alpha
- Seeking Alpha - SPY Analysis - State Street SPDR S&P 500 ETF Trust - Seeking Alpha
- Seeking Alpha - State Street SPDR S&P 500 ETF Trust (SPY) Latest Stock News
- ChartMill - SPY Stock Price, Quote & Chart | ChartMill.com
- Seeking Alpha - Top 10 contributors to S&P 500 earnings growth (SPY:NYSEARCA)
- U.S. Securities and Exchange Commission (SEC) - SPDR ® S&P 500 ® ETF Trust (Form N-30D) Annual Report
- Zacks - Should State Street SPDR S&P 500 ETF Trust (SPY) Be on Your Investing Radar?
- Barchart - SPY Put/Call Ratio for SPDR S&P 500 ETF
- Yahoo Finance - State Street SPDR S&P 500 ETF Trust (SPY)
- Barchart - SPY’s 50-Day Moving Average Streak is Going Strong. The Rest of the Market is Sending Up Flares.
About this seasonal analysis
Seasonal pattern data is sourced from TradeWave.ai, which analyzes historical price behavior across annual calendar windows going back up to 30 years. Read the full data methodology or the book The 100-Year Pattern by Afshin Moshrefi (2026 edition). Past performance of seasonal patterns does not guarantee future results. This article is for informational purposes only and does not constitute investment advice.