S&P 500 (SPX) Has Rallied in 10 of 10 Midterm Sep-Jul Windows, Averaging 19% Gains
S&P 500 is heading toward a 293-day midterm-to-pre-election seasonal window that has never been negative in the past dataset, just as Wall Street leans hard on aggressive earnings growth forecasts.

What is the seasonal pattern for S&P 500 (SPX)?
S&P 500 has risen in 10 of 10 midterm-year windows starting around Sep 23, with an average gain of 19.27% in winning years.
Key seasonal stats for the Sep 23 – Jul 12 window
- 10 for 10 in this window, with S&P 500 posting gains in every midterm-year sample and averaging 19.27% in winning years.
- Percent Profitable is 100%, with 10 winners and 0 losers across the last 10 midterm election years in this pattern.
- The trade direction is long, with a cumulative return of 466% when stacking the window across all 10 historical cycles.
- Median profit of 20.75% suggests the typical outcome has been a strong double-digit advance rather than a marginal drift higher.
- A Sharpe ratio of 1.75 and a TradeWave Ratio of 1.85 point to historically favorable risk-adjusted returns in this specific trading window.
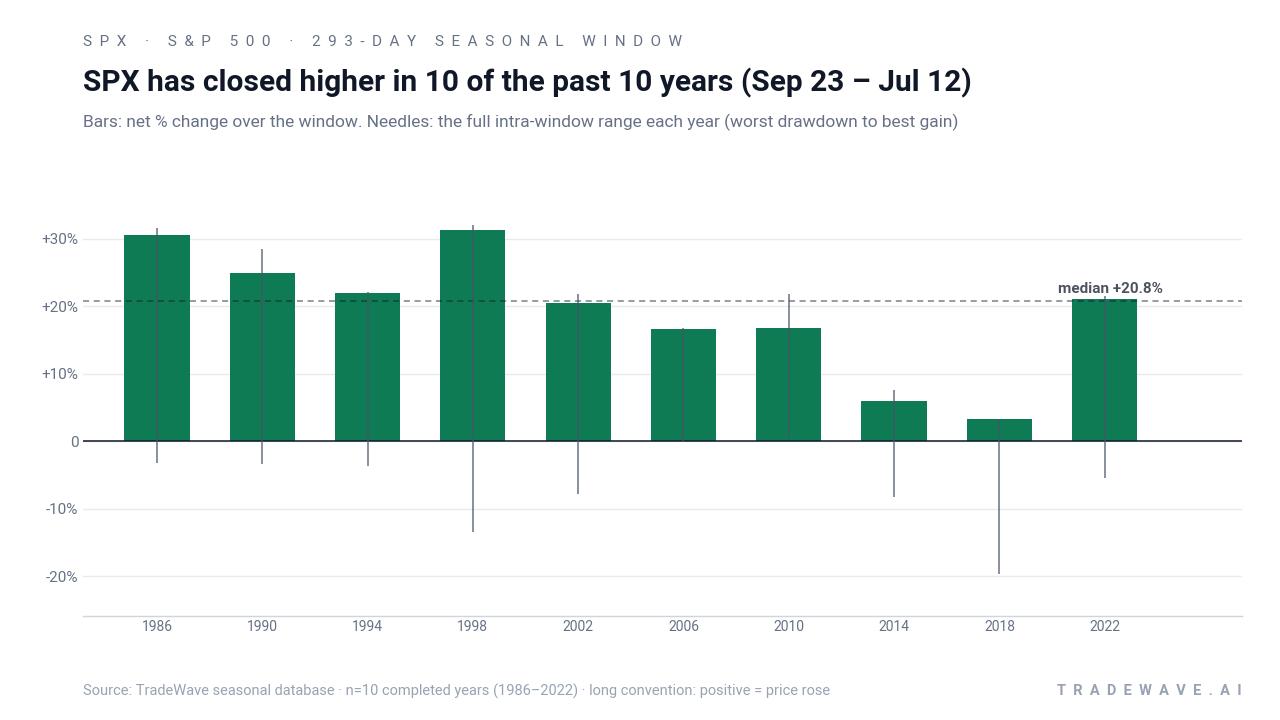
- Intraperiod swings have still mattered, with some years seeing drawdowns in the mid-teens before finishing higher, so timing and risk controls have remained important.
According to historical data from TradeWave.ai, this upcoming stretch behaves very differently from an average year for the index, and the next iteration is only weeks away.
How has S&P 500 (SPX) traded in the Sep 23 – Jul 12 midterm window?
S&P 500 has not logged a single losing midterm-year cycle in the 293-day window that runs from roughly Sep 23 through mid-July, rising in 10 of 10 historical samples with an average gain of 19.27%. That window opens again on Sep 23, 2026, with the index coming off a solid one-month advance of 3.35% and trading between a 52-week low near 6,316.91 and a high around 7,816.70. This combination of a powerful historical tailwind and a market already leaning bullishly into the midterm-to-pre-election handoff gives the next few weeks outsized importance for portfolio positioning.
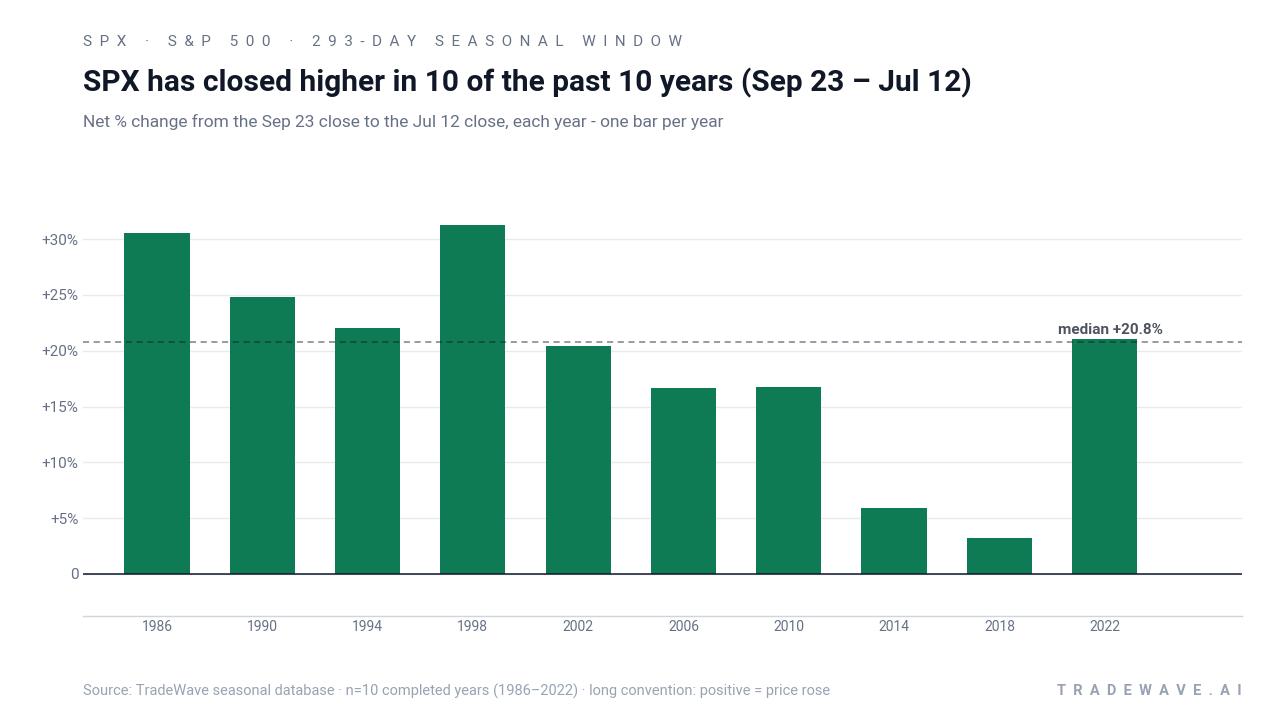
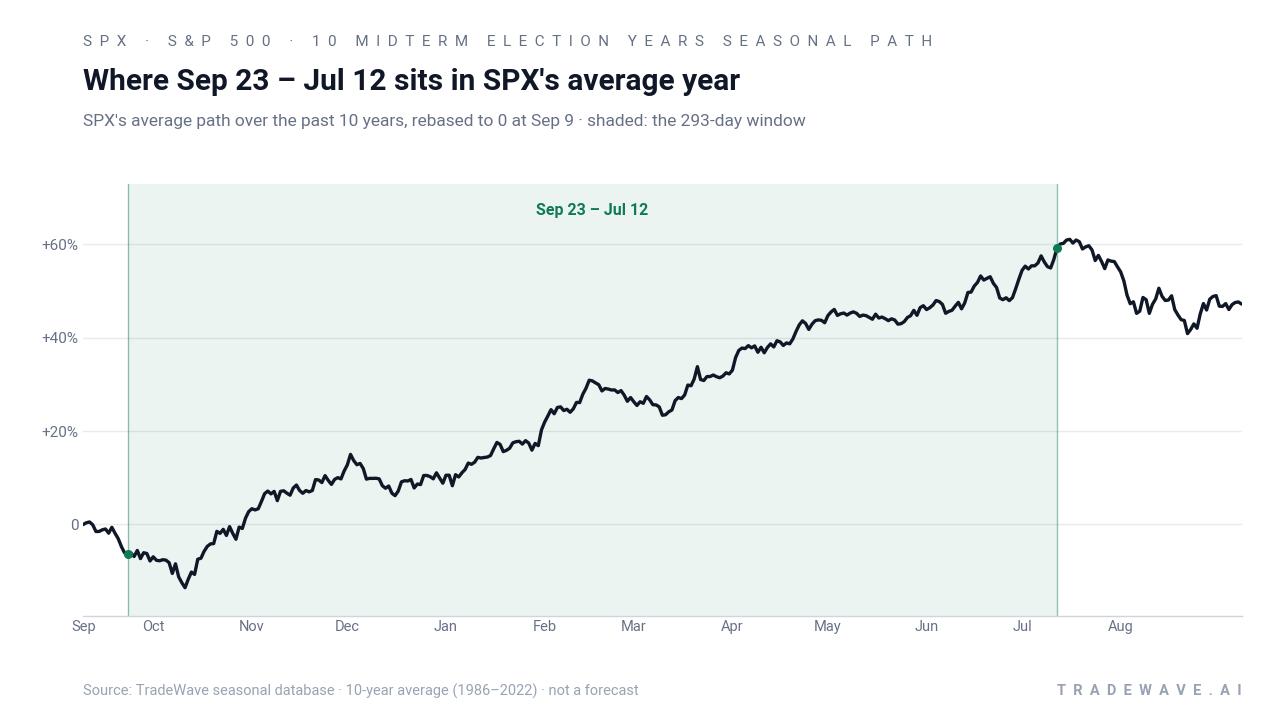
The presidential election cycle matters here because this window sits squarely in the handoff from the midterm election year into the year before the presidential election, a phase that has often coincided with friendlier policy tone, clearer fiscal plans and a more supportive liquidity backdrop for equities.[1] Grouping only the last 10 midterm election years isolates that regime and strips out noise from other parts of the four-year cycle, which is why the pattern looks so different from a generic “buy in the fall” rule of thumb.
A second view shows how far the index has typically swung up and down inside each of those winning windows.
Across the 10 midterm-year samples, the long trade direction has been rewarded consistently, with every window finishing in the green and several years delivering gains north of 20%. Average profit of 19.27% and a median outcome of 20.75% show that the typical result has not been a marginal edge but a sizable move, while a Sharpe ratio of 1.75 points to a historically strong risk-adjusted profile for this specific S&P 500 trading window.
The per-year breakdown shows how that strength has played out. In 1998, the index gained 31.24% over the window, with a best intraperiod run-up of 31.96% and a worst drawdown of 13.39% from the entry, a textbook example of a powerful bull leg that still tested nerves along the way. At the other end of the spectrum, 2018 delivered a modest 3.23% net gain, but that came with a maximum adverse move of 19.62%, underscoring that even “winning” years in this pattern have included deep air pockets.
The maximum favorable move and maximum adverse move profile across years reinforces that message. Large positive excursions in strong years, such as 30.53% in 1986 and 24.84% in 1990, show how far the index has tended to travel in the trade direction when the window is working. At the same time, MAE readings in the mid- to high-single digits in several cycles, and near 20% in 2018, highlight that intraperiod downside has often been meaningful even when the final outcome was positive.
The cumulative chart for this pattern compounds those windows into a single line that climbs to a 466% total gain across the 10 completed cycles, a reflection of how stacking the same seasonal regime has historically amplified returns. Add it up: 10 straight winning windows, double-digit average gains and a smooth cumulative curve make this one of the cleanest long-biased seasonal regimes in the S&P 500 dataset.
This upcoming window also overlaps the long midterm-to-pre-election seasonal regime often referred to as the 100-Year Pattern, a roughly 295-day stretch that has historically delivered unusually strong S&P 500 performance across data going back to 1930. In that framework, the early part of midterm years has often been choppy and risk-heavy, while the late-September turn into the following summer has marked a more persistent climb.
History does not guarantee future results; adverse excursions can be large even in winning windows, and past MAE readings show that drawdowns of 10% to 20% have occurred inside this pattern before final gains were locked in.
Why does S&P 500 (SPX) follow this seasonal pattern?
One likely driver is the way the policy and earnings calendar line up in the midterm-to-pre-election stretch, with political uncertainty fading after midterm votes and companies issuing guidance that extends into the presidential election year. Analysts have pointed to fiscal clarity, reduced regulatory overhang and renewed risk appetite from institutions as reasons the year before the presidential election has often been strong for equities.[1] This pattern may also reflect portfolio rebalancing and sector rotation as investors position for the next administration’s priorities well before the actual election year begins.
What is driving S&P 500 (SPX) today?
S&P 500 heads into late August with a one-month gain of 3.35%, trading between its 52-week low near 6,316.91 and high around 7,816.70 as investors weigh stretched valuations against still-bullish earnings hopes. Wall Street analysts are modeling aggregate S&P 500 earnings per share growth of roughly 25% over the next year, one of the most optimistic outlooks in decades and a stance that leaves little room for disappointment if margins or revenue growth slip.[1] Nearly 60% of index constituents carry Buy ratings, a concentration of optimism that can amplify downside risk if macro data or guidance undercuts the rosy narrative.[1]
The chart below shows the index’s past year of trading alongside a 60-day seasonal projection, giving a sense of how the historical pattern compares with the recent trend.
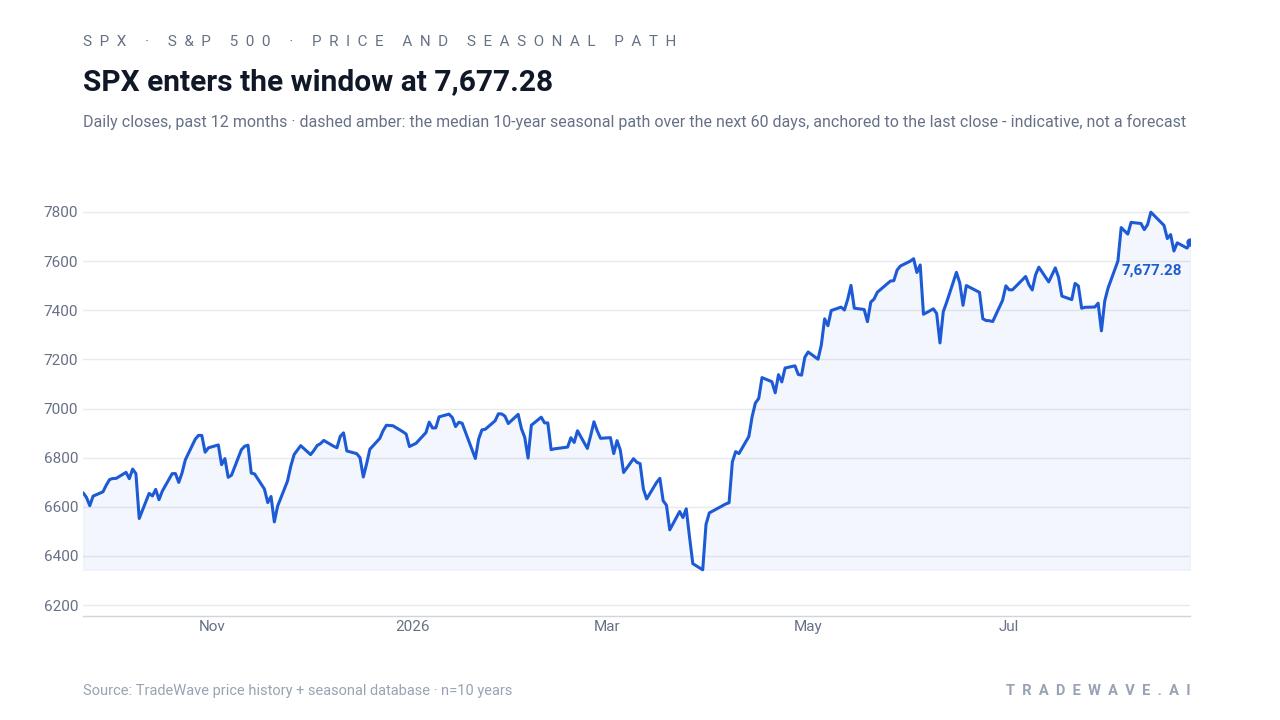
Macro and policy expectations sit at the center of this tug-of-war. With consensus earnings growth already aggressive, any shift in rate expectations, tax policy or regulatory tone could matter more than usual for index-level performance.[1] That is why the approaching Sep 23 seasonal window is so notable: it arrives just as the market’s fundamental story is stretched, yet the historical seasonality for this phase of the presidential cycle has been unusually supportive.
What should traders watch as the Sep 23 window approaches?
First, watch how S&P 500 behaves on pullbacks between now and late September. In prior midterm cycles, the strongest windows often began after a period of consolidation or modest weakness, not at the peak of a euphoric run, and intraperiod drawdowns of 10% or more have been common even in winning years.
Second, track the evolution of earnings expectations and analyst sentiment into the next reporting season. If the current ~25% forward EPS growth assumption starts to be revised lower while the index holds near the upper half of its 52-week range, that would mark a clear divergence between fundamentals and price that could test the durability of the historical seasonal pattern.[1]
Third, focus on key policy and macro dates that land inside the upcoming 293-day window, including central bank meetings, fiscal negotiations and any shifts in regulatory priorities that could reshape sector leadership. Behavior around those catalysts will help confirm whether this cycle is tracking the historical midterm-to-pre-election template or breaking away from it.
Finally, monitor volatility and intraday ranges once the window opens. In past cycles, some of the best-performing years in this pattern still featured sharp, fast drawdowns before the longer-term uptrend reasserted itself, so whether MAE-style downside excursions remain contained or start to widen will be an important tell for how closely 2026–27 is echoing the prior 10 midterm-year windows.
Sources
About this seasonal analysis
Seasonal pattern data is sourced from TradeWave.ai, which analyzes historical price behavior across annual calendar windows going back up to 30 years. Read the full data methodology or the book The 100-Year Pattern by Afshin Moshrefi (2026 edition). Past performance of seasonal patterns does not guarantee future results. This article is for informational purposes only and does not constitute investment advice.