MRVL Faces Risk After Six Straight Midterm Autumn Declines
MRVL has surged in 2026, but a midterm-year seasonal window that has produced six straight declines into early October is about to test the stock’s AI momentum.
Price as of Aug 27, 2026: $241.45 (last close).

What is the seasonal pattern for MRVL (MRVL)?
MRVL has fallen in 6 of 6 midterm-year Sep 24–Oct 9 windows, with an average gain of 7.62% in winning years for a short trade.
- 6 for 6 in this window, with short trades averaging 7.62% profit across the last six midterm election years.
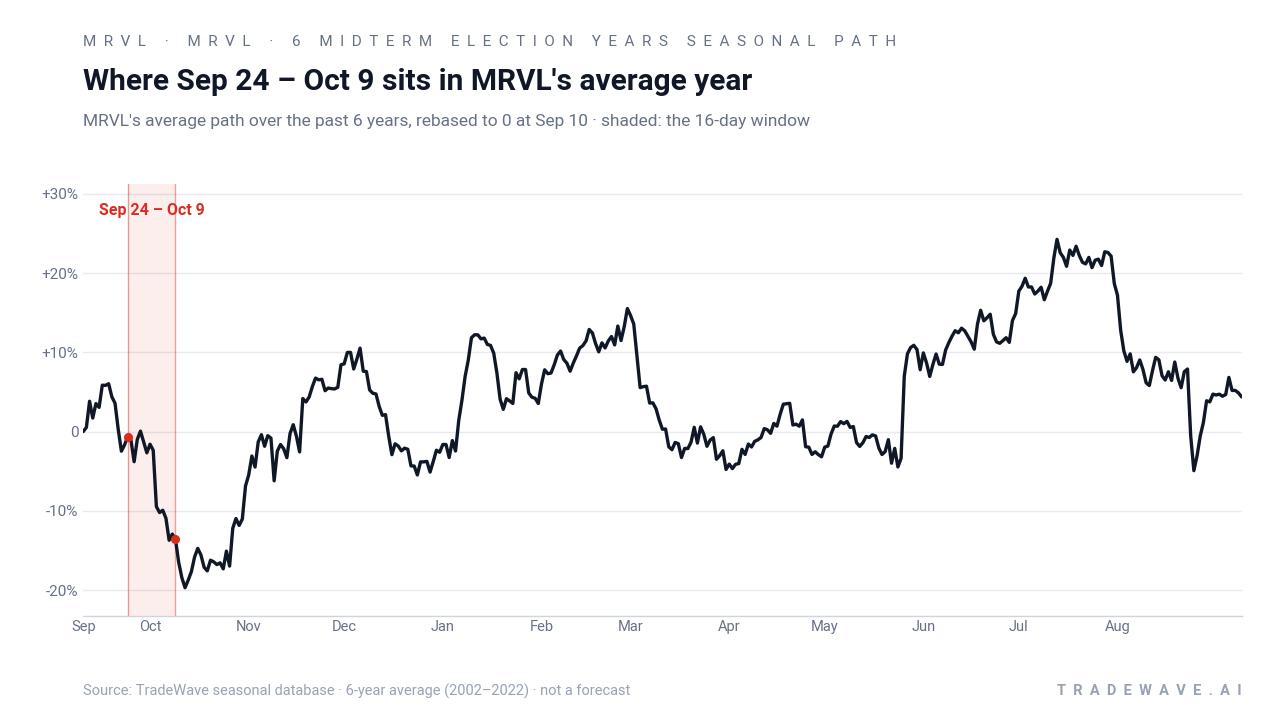
- The 16-day trading window runs from Sep 24 to Oct 9, clustering in the late part of the midterm election year.
- Percent Profitable is 100%, with 6 winners and 0 losers for the short-side seasonal setup.
- Cumulative return from repeating the window across all six cycles is 54%, highlighting how the MRVL seasonal trend has stacked over time.
- Individual years have seen sizable intraperiod swings, with best point-to-peak moves and worst drawdowns both reaching double digits.
- The pattern aligns with a broader semiconductor seasonal outlook in midterm years, where late-September has often marked a cooling phase after strong runs.
According to historical data from TradeWave.ai, this specific late-September window has behaved very differently from an average month for MRVL. The next section walks through how that pattern has played out across the last six midterm election years without making any prediction about what comes next.
How has MRVL (MRVL) traded in the late-September midterm window?
MRVL has dropped in every single Sep 24–Oct 9 midterm-year window across the last six cycles, with short trades averaging 7.62% profit. Today the stock closed at 241.45, leaving it about 26.8% below its 52-week high of roughly 329.72 but still up 169.8% year to date. Heavy put-option activity flagged earlier in 2026, including large trades around the 70 and 110 strikes, shows that some traders have already been leaning into downside hedges and speculation in this name.[5]
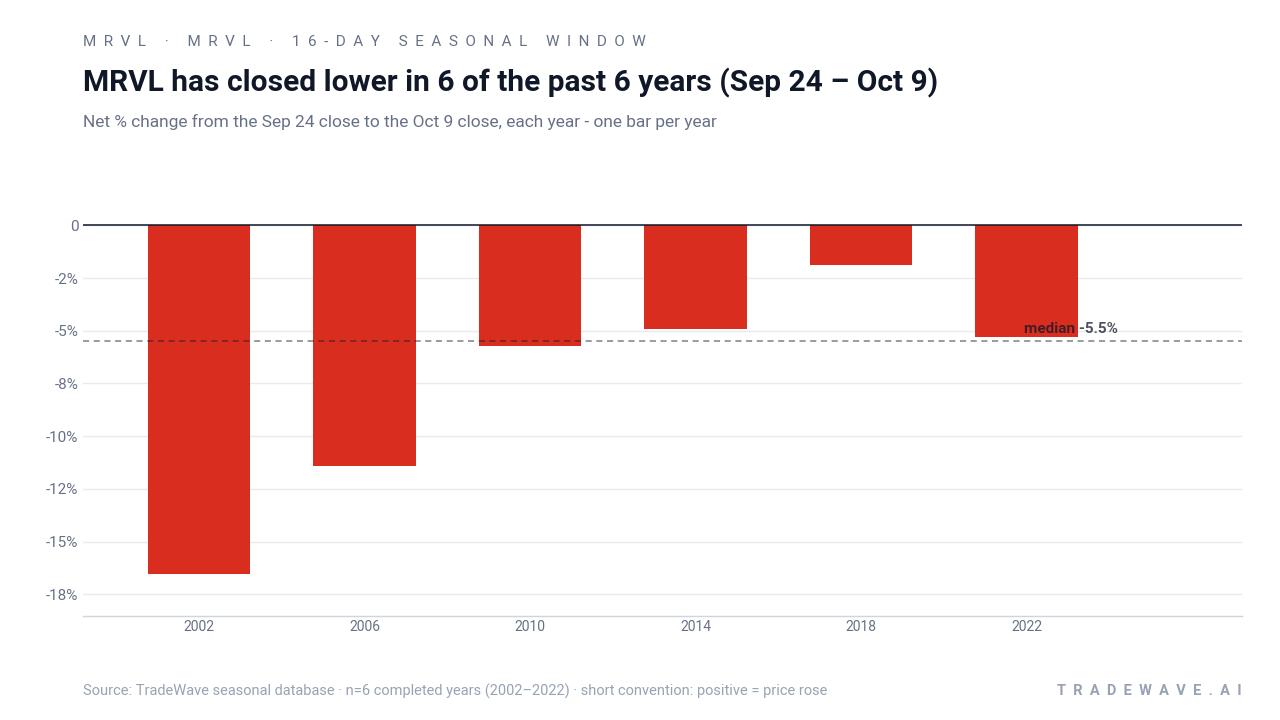
Grouping the data by presidential election cycle matters here because all six samples come from midterm election years, a phase that often brings policy uncertainty, spending debates and sector rotation in high-beta tech. In this context, MRVL’s late-September seasonal pattern reflects how investors have historically repositioned around fiscal and regulatory headlines while managing exposure to AI and data-center chip names.
This seasonal window begins on Sep 24 and spans 16 days. Historically, during this period in midterm election years, MRVL has favored the short side, with every instance from 2002 through 2022 finishing lower over the window. The trade direction is explicitly short, so negative returns in the stock price have been favorable outcomes for the pattern, while any sharp rallies have represented losing years for that setup.
Across those six midterm-year windows, Percent Profitable is 100%, with 6 winners and 0 losers for the short trade. Average profit per winning year is 7.62%, while the median profit is 5.5%, showing that even the more modest years have still delivered meaningful downside for the stock within this slice of the calendar. The cumulative return from stacking the window across all six cycles is 54%, which is what you get if you hypothetically repeated the same short-only MRVL trading window every midterm year.
The per-year table shows 2002 as the strongest outcome for shorts, with MRVL falling 16.53% from entry to exit, while 2018 was the mildest at a 1.87% decline. In 2022, the stock dropped 5.3% over the window, but the best point-to-peak move in favor of the short trade reached 15.84% before some of that move retraced. Even the softer years like 2014 and 2018 still finished in the red for the stock, which is why the win-loss record is clean despite varied magnitudes.
The MFE/MAE profile shows that intraperiod swings have been meaningful. In 2002, the worst drawdown from the short entry, or maximum adverse excursion, was 24.62%, meaning the stock rallied sharply against the trade before ultimately rolling over. In 2006, the worst drawdown was 17.52%, and in 2022 it was 7.89%, underscoring that even winning short windows have required sitting through sizable countertrend rallies at times. On the favorable side, maximum favorable excursions have ranged from low single digits in quieter years to mid-teens in more volatile ones.
The TradeWave Ratio of 1.42 captures how far MRVL has typically traveled in the trade direction within the window, independent of where it closed. Combined with a Sharpe ratio of 1.39 based on end-of-window outcomes, the pattern has historically offered a relatively strong risk-adjusted profile for shorts, albeit with the caveat that the sample is only six midterm years. Trend statistics show 52 days of favorable trend versus zero unfavorable across the aggregated window, which lines up with the clean win record.
Year-by-year ranges highlight how far MRVL has swung in both directions inside this 16-day trading window.
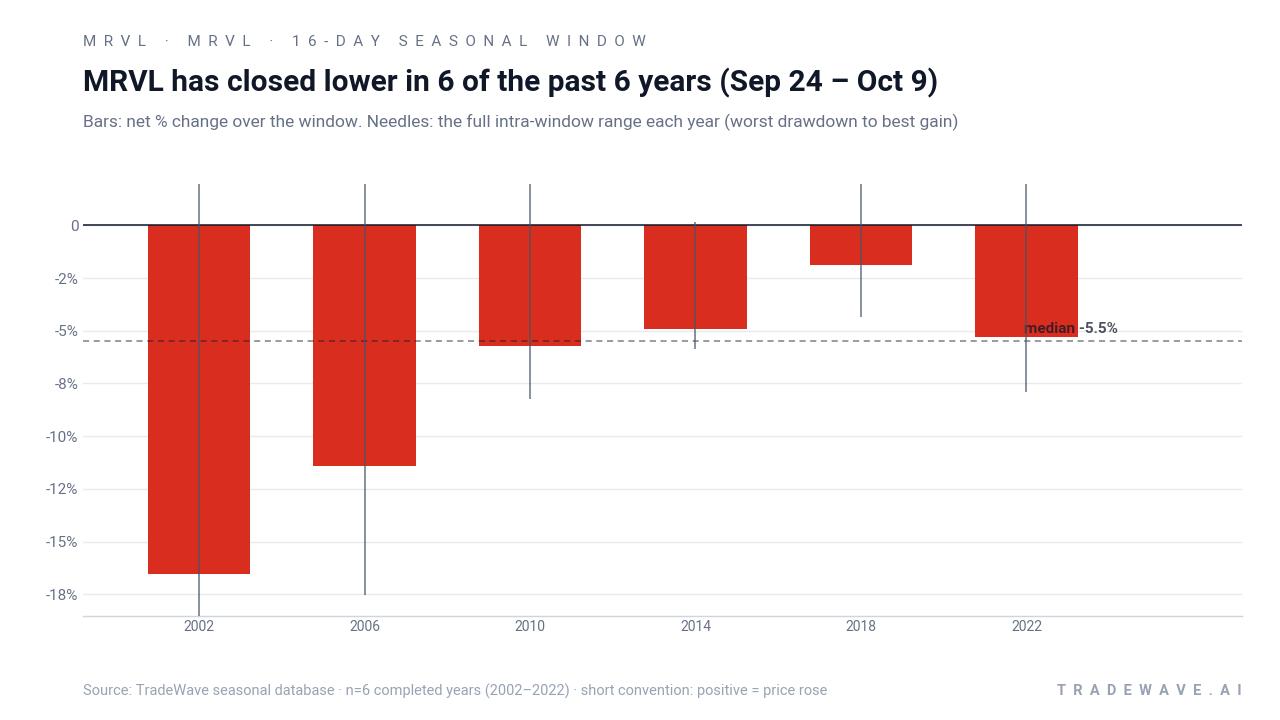
History does not guarantee future results; adverse excursions can be large even in winning windows, and MRVL’s AI story and macro backdrop in 2026 are different from prior midterm years.
Why does MRVL (MRVL) follow this seasonal pattern?
One likely driver is the clustering of earnings and guidance updates around this part of the calendar, which can prompt institutional portfolio repositioning in high-beta semiconductor names. Analysts have also pointed to sector rotation around fiscal debates and policy headlines in midterm election years, which can lead investors to trim winners like MRVL after strong runs.[1] The pattern may also reflect options expiration dynamics and hedging flows, as traders adjust AI and data-center exposure heading into the final quarter of the year.
What is driving MRVL (MRVL) today?
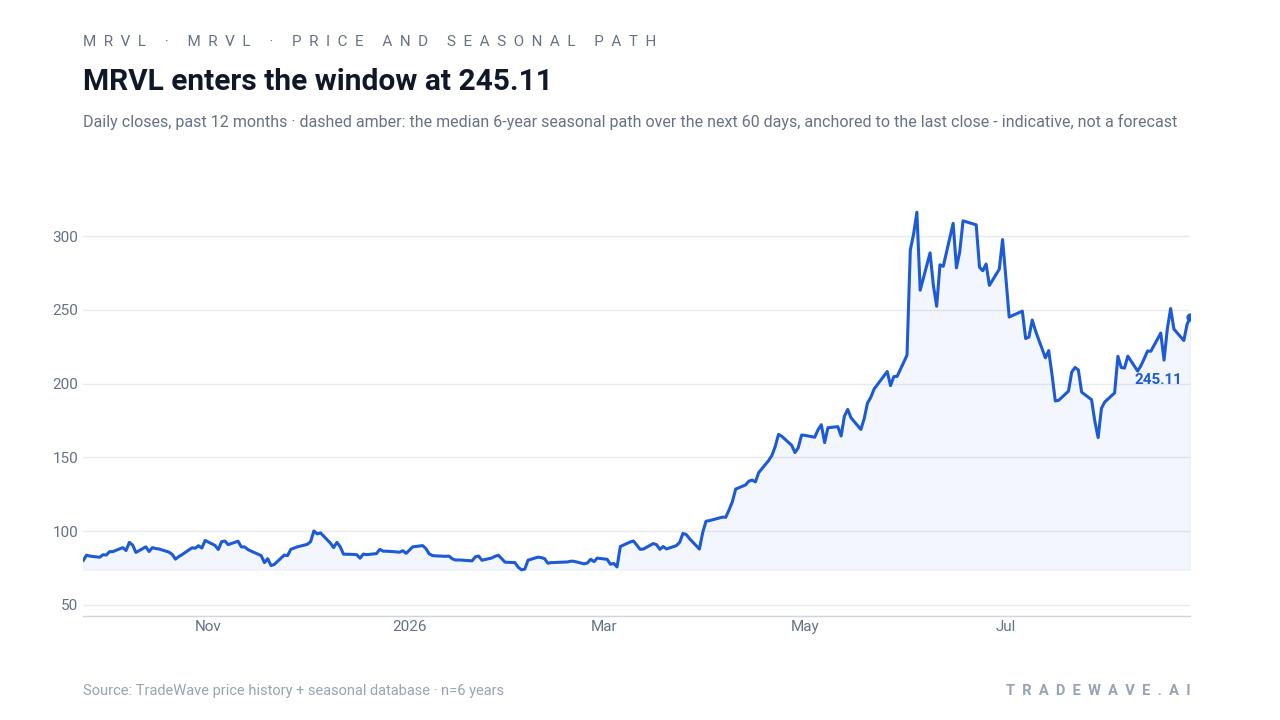
MRVL slipped 1.5% in the latest session to 241.45, extending a pullback from its 52-week high near 329.72 but leaving the stock still up 169.8% for 2026. That move comes a day after the company’s latest earnings report, where Q1 2027 EPS of $0.80 and revenue around the mid-$2 billion range broadly met or beat expectations depending on the source, reinforcing a constructive fundamental backdrop for its AI and data-center franchises.[1][3] MarketBeat’s consensus rating sits at “Moderate Buy,” reflecting a supportive analyst stance even after the stock’s big run.[1]
Back on May 27, 2026, MRVL’s Q1 2027 release showed revenue growth in the low-20s to high-20s % range year over year, with guidance calling for Q2 EPS between $240.38 and $254.60, which helped cement the AI-driven growth narrative around the name.[1][4] Public.com’s coverage has echoed that story, highlighting MRVL’s role in the broader semiconductor and AI investment theme that has dominated tech flows this year.[3] At the same time, MarketBeat’s short-interest data through late August shows that bearish positioning remains active, giving the stock a mix of momentum buyers and skeptics heading into the fall.[6]
In January 2026, Barchart flagged unusually heavy put-option volume in MRVL, including large trades at the 70 strike and significant in-the-money put selling around 110, a sign that some traders were either hedging or speculating on downside even as the AI story gained traction.[5] In April 2026, another Barchart piece noted that insider David Casper sold nearly 18,000 shares, a modest but visible data point for investors tracking executive behavior.[7] Those flows and insider moves do not dictate price, but they add texture to a stock that has become a high-conviction AI play for many institutions.
The chart below situates the latest pullback against MRVL’s powerful 12-month rally and the historical seasonal projection into the upcoming window.
What should traders watch as MRVL (MRVL) approaches this window?
First, watch how MRVL trades as Sep 24 approaches relative to its recent high and the 230–250 zone that has acted as a consolidation band. If the stock continues to cool from its 52-week peak while staying above its 50-day moving average, the upcoming midterm-year window will test whether the historical pattern of late-September weakness still has bite in an AI-driven tape.[3]
Second, keep an eye on earnings follow-through and guidance commentary from management, especially around AI infrastructure demand and data-center spending, which have been central to the bull case.[1][3] Any shift in tone on growth, margins or capital intensity could interact with the historical seasonality to either amplify or blunt typical late-September volatility.
Third, monitor options flow and short interest as the window opens. If heavy put activity and elevated short positioning build again, similar to what Barchart highlighted in January, that would suggest traders are leaning into the same downside window that has worked in prior midterm years.[5][6] On the other hand, a fade in bearish flow or a squeeze in shorts would be one way the market could break from the six-for-six pattern.
Finally, place MRVL’s behavior in the broader semiconductor and AI sector context. The midterm election year is moving into its late phase, and policy debates around spending, regulation and industrial strategy can all influence flows into high-beta chip names.[1] If MRVL shrugs off the historical seasonal drag and holds firm or grinds higher through Oct 9, that would be a strong signal that the current AI cycle is overpowering the usual midterm-year trading playbook for this stock.
Sources
- MarketBeat - Marvell Technology, Inc. (NASDAQ:MRVL) Given Average Recommendation of "Moderate Buy" by Analysts
- MarketBeat - Marvell Technology (NASDAQ:MRVL) Stock Price Up 2.1% on Analyst Upgrade
- Public.com - Buy Marvell Technology Stock – MRVL Stock Quote Today ...
- Public.com (Earnings page) - Marvell Technology (MRVL) Earnings: Latest Report, Earnings Call & Financials
- Barchart - Unusual Volume in Marvell Technology Put Options - Is MRVL Stock Undervalued?
- MarketBeat (Short Interest) - Marvell Technology (MRVL) Short Interest & Short Float | Updated Aug 2026
- Barchart - Marvell Insider David Casper Just Sold Nearly 18,000 Shares of MRVL Stock. Should You Sell Too?
About this seasonal analysis
Seasonal pattern data is sourced from TradeWave.ai, which analyzes historical price behavior across annual calendar windows going back up to 30 years. Read the full data methodology or the book The 100-Year Pattern by Afshin Moshrefi (2026 edition). Past performance of seasonal patterns does not guarantee future results. This article is for informational purposes only and does not constitute investment advice.