Nasdaq QQQ Invesco ETF (QQQ) Has Never Closed Lower in This 313-Day Midterm-Year Stretch
Nasdaq QQQ Invesco ETF is nearing a long midterm-year seasonal window that has never been negative in the data, even as tech concentration, Fed policy and heavy trading volumes shape the current risk-reward profile.

What is the seasonal pattern for Nasdaq QQQ Invesco ETF (QQQ)?
Nasdaq QQQ Invesco ETF has risen in 6 of 6 midterm-year Sep 10–Jul 19 windows, with an average gain of 22.26% in winning years.
- 6 for 6 in this window, with Nasdaq QQQ Invesco ETF averaging 22.26% gains across all winning years.
- The upcoming 313-day window runs from Sep 10, 2026 through Jul 19, 2027 and is aligned with a long trade direction.
- Percent Profitable is 100%, with 6 winners and 0 losers across the last six midterm election years.
- Average profit in winning years is 22.26%, with a median gain of 26.14% and cumulative return of 228% when stacking the windows.
- Intraperiod swings have been meaningful, with individual years showing double-digit peak run-ups and double-digit drawdowns before finishing higher.
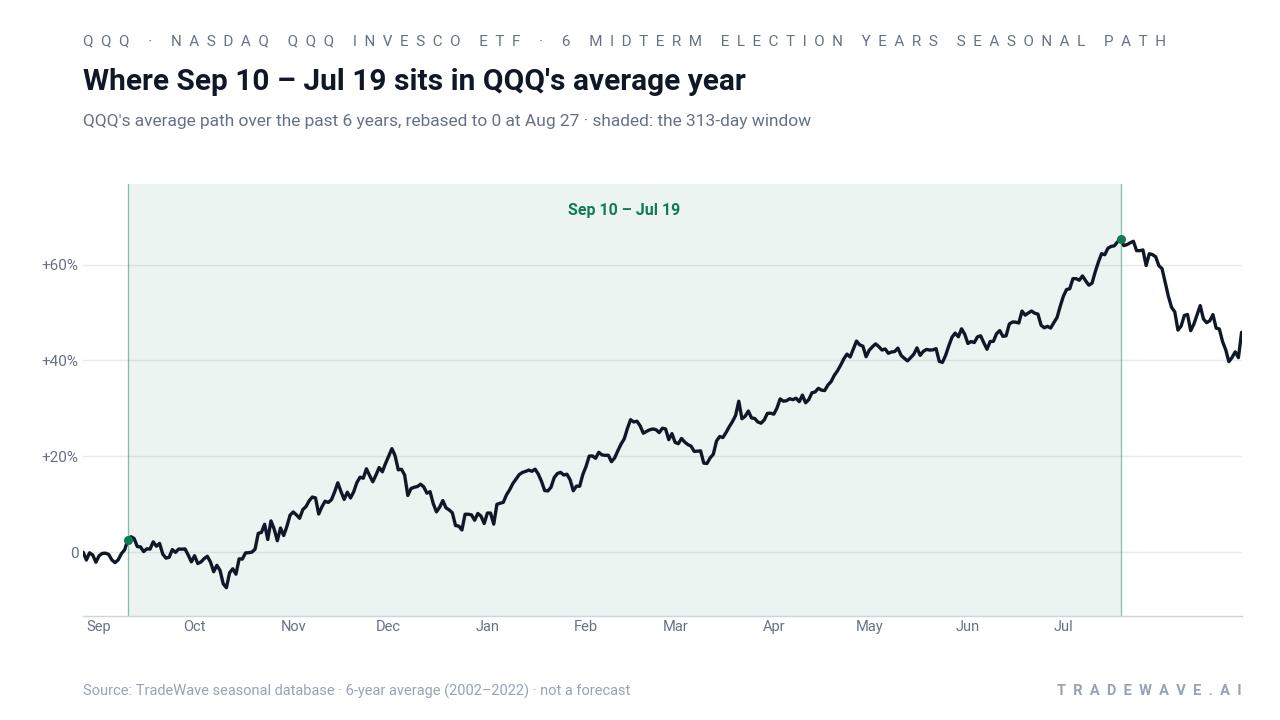
- The pattern sits in the midterm election year phase, a part of the presidential cycle that has historically seen distinct behavior for growth-heavy benchmarks like QQQ.
According to historical data from TradeWave.ai, this midterm-year stretch for QQQ has behaved very differently from an average calendar year. The next section walks through that election-cycle pattern in detail before turning back to today’s drivers.
How has Nasdaq QQQ Invesco ETF (QQQ) traded in the midterm-year Sep 10–Jul 19 window?
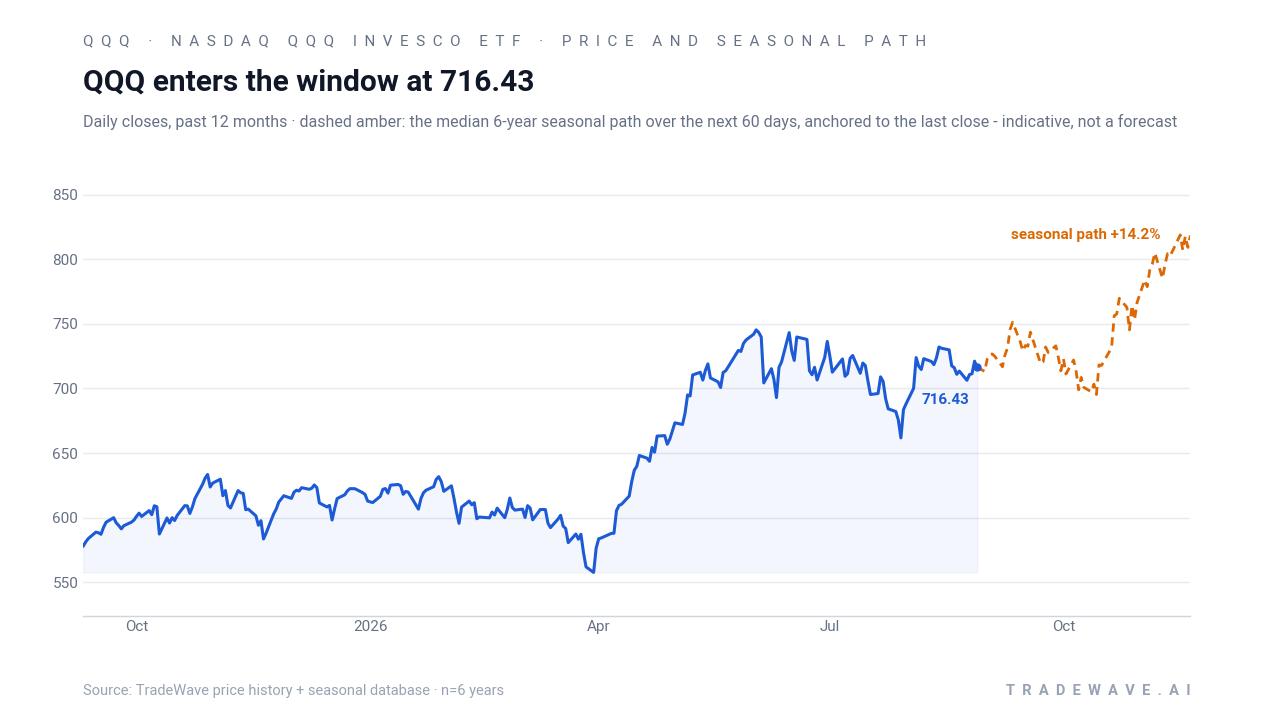
Nasdaq QQQ Invesco ETF has closed higher in every single Sep 10–Jul 19 midterm-year window in the database, posting gains in 6 of 6 cycles and averaging 22.26% across those years. The upcoming 313-day stretch begins on Sep 10, 2026, with QQQ trading near the top of its 52-week range between about 554 and 747, leaving only a small gap to the high. That combination of a clean historical win streak and a market already pressing the upper band of its range makes this window one of the more closely watched QQQ seasonal trends on the calendar.
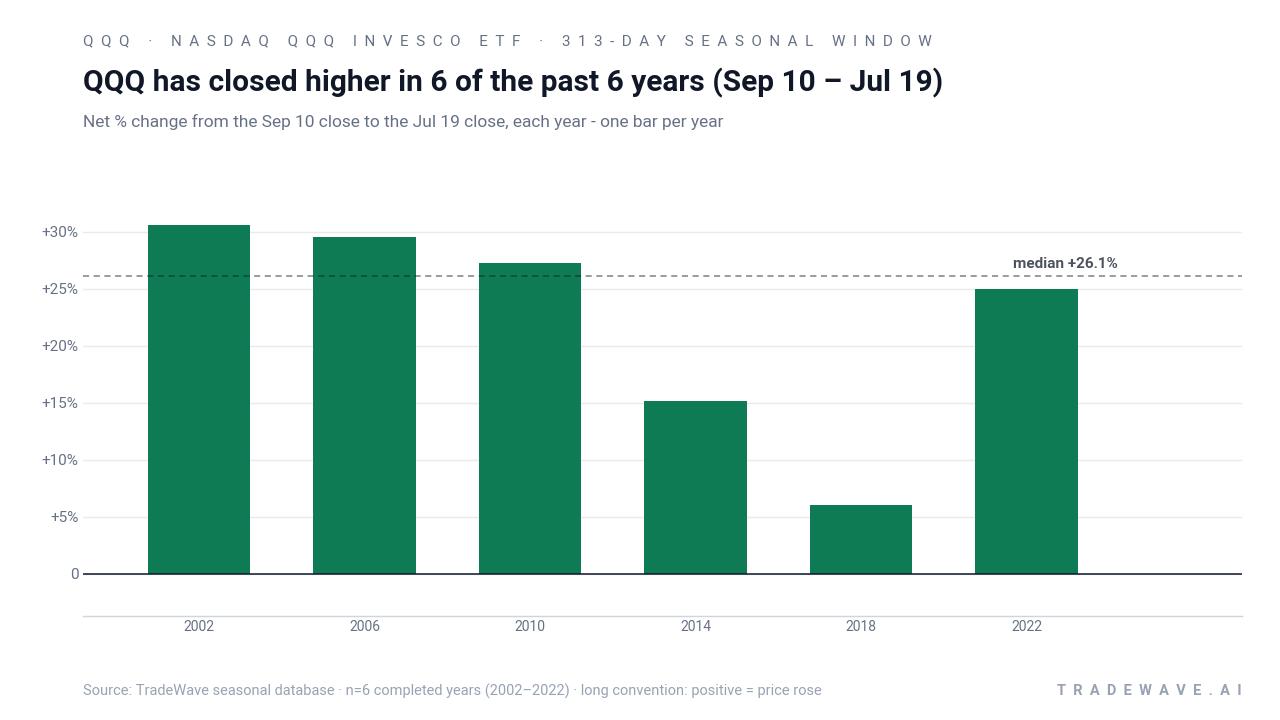
Grouping the data by presidential election cycle matters here because this window always spans the back half of a midterm election year and most of the following pre-election year. That is the part of the policy calendar when Washington often shifts from tightening and uncertainty toward more market-friendly messaging, while corporate earnings visibility tends to improve. For a growth-heavy vehicle like QQQ, that combination has historically lined up with a more supportive backdrop than the early midterm months.
Across the six completed midterm-year samples, QQQ’s annualized return in this window clocks in at 21.93%, with a cumulative gain of 228% when the windows are stacked. The median outcome is a 26.14% rise, which is slightly higher than the average, reflecting a couple of softer years but no outright losses. The trade direction is long, so those positive returns line up with the intended side of the pattern rather than coming from short squeezes or one-off reversals.
The strongest year in the sample was 2002, when QQQ gained 30.57% between the Sep 10 entry and the Jul 19 exit, after a maximum favorable move of 38.48% and a worst drawdown of 16.45% from the starting level. At the other end of the spectrum, 2018 still finished up 6.03% but saw a maximum adverse move of 20.69% inside the window, underscoring how bumpy the ride can be even in a winning year. The most recent midterm sample in 2022 delivered a 24.99% gain, with a peak run-up of 25.75% and an intraperiod drawdown of 18.03%.
A second view combines yearly net results with both peak gains and worst drawdowns to show the full intraperiod range.
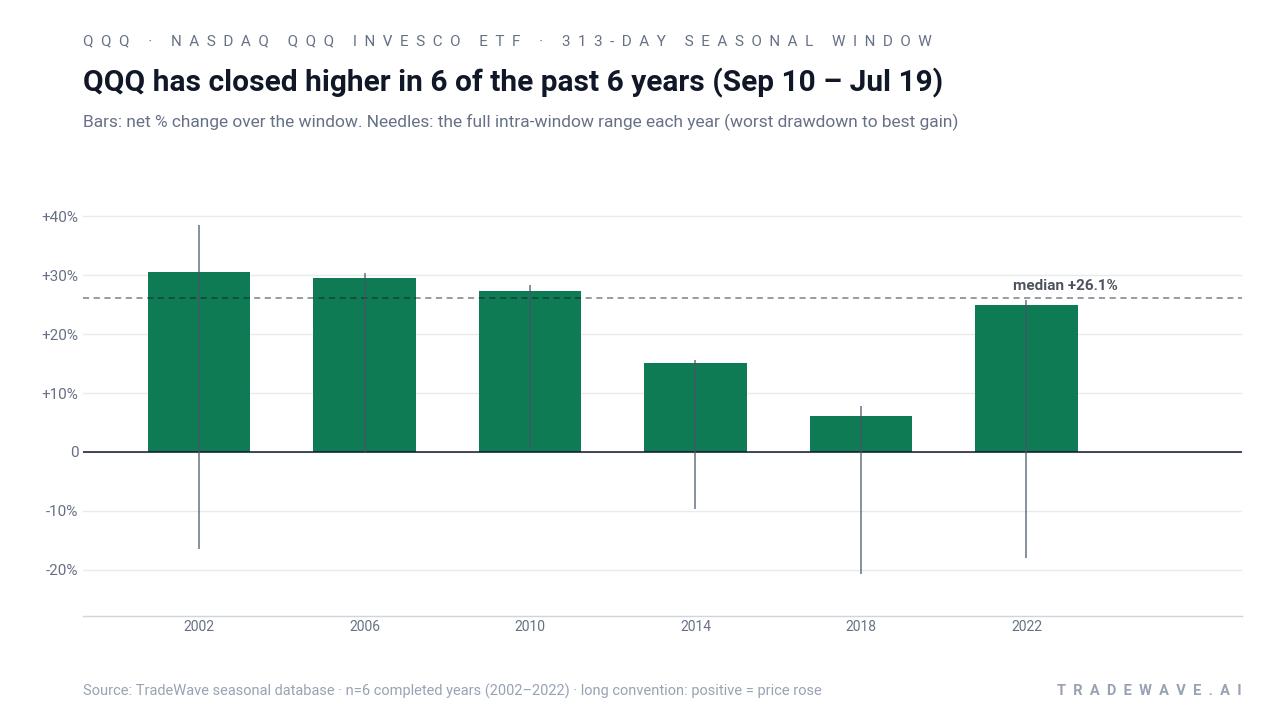
The bar-and-needle profile shows a consistent pattern: every bar is positive, but the needles extend meaningfully in both directions. Maximum favorable excursions have often pushed into the high teens or 20% range, while maximum adverse excursions have at times matched that magnitude on the downside before the window closed higher. That mix of strong average gains, a 1.94 Sharpe ratio and a 1.9 TradeWave Ratio points to a historically rewarding but volatile long window rather than a smooth climb.
History does not guarantee future results; adverse excursions can be large even in winning windows, and traders need to be prepared for sizable drawdowns inside a historically positive pattern.
Why does Nasdaq QQQ Invesco ETF (QQQ) follow this seasonal pattern?
One likely driver is the way the tech-heavy Nasdaq-100 earnings calendar clusters around this period, with big-cap growth names often guiding for the coming year as the pre-election phase approaches.[3] Analysts have also pointed to institutional portfolio repositioning around midterm elections, as investors shift from defensive stances earlier in the cycle toward higher-beta exposure once policy paths look clearer.[1] For QQQ specifically, that may combine with recurring flows into large-cap technology and communication services as investors lean back into secular growth stories after midterm volatility fades.[3]
What is driving Nasdaq QQQ Invesco ETF (QQQ) today?
QQQ tracks the Nasdaq-100, giving investors concentrated exposure to mega-cap technology and growth stocks that have dominated index performance in recent years.[2] Fresh analysis from Seeking Alpha and ETFdb highlights how earnings growth expectations for those top holdings remain a key pillar of the bull case, even as valuations look stretched in some names.[1][3] At the same time, commentary from Barchart and other trading platforms notes elevated average volumes in QQQ, reflecting heavy use of the ETF as a vehicle for both bullish positioning and short-term hedging.[5]
Macro remains the other major swing factor. Recent coverage has tied QQQ’s day-to-day moves closely to shifting expectations around the Federal Reserve, with labor market data and rate-cut odds driving swings in growth-stock sentiment.[1] Short sellers have been active in the Nasdaq complex as well, with analysis pointing to periods where bears have covered positions into rallies, adding fuel to upside squeezes in QQQ.[4] On the competitive front, BlackRock and State Street launched rival Nasdaq-100 ETFs earlier in 2026, a development that in April was flagged as a potential long-term headwind for QQQ’s asset share even if the immediate impact on trading dynamics has been limited so far.[6]
The chart below situates the latest moves in QQQ against its past year of trading and a historical 60-day seasonal projection.
What should traders watch as the Sep 10 seasonal window approaches?
First, watch how QQQ behaves as Sep 10 approaches relative to its 52-week band. A push decisively through the prior high before the window opens would mean the next cycle starts from uncharted territory, while a pullback into the middle of the range would echo several past midterm setups. Either way, the historical pattern suggests that large intraperiod swings are normal, so traders may want to focus on how QQQ handles 10–20% drawdowns if they emerge inside the window.
Second, keep an eye on the macro calendar, especially labor market reports and Federal Reserve communications that could reset the path for policy rates.[1] Growth-heavy benchmarks like QQQ have been particularly sensitive to shifts in real yields, and prior midterm-to-pre-election stretches have often seen sentiment flip quickly as the policy narrative evolves. Stronger-than-expected earnings from QQQ’s top holdings would reinforce the historical seasonal tailwind, while a string of disappointments could be the catalyst that finally breaks the 6-for-6 streak.[3]
Third, monitor trading activity and positioning. Elevated volumes and the use of QQQ as a hedging tool mean that options flows and short-interest dynamics can amplify moves in both directions.[4][5] If heavy volume persists into the window and short sellers again start covering into strength, that would rhyme with prior cycles where rallies extended further than fundamentals alone might justify.[4][5] If, instead, liquidity thins out or flows migrate more aggressively into competing Nasdaq-100 products, the seasonal pattern could face a different structural backdrop than in earlier years.[2][6]
Sources
- Seeking Alpha - Invesco QQQ Trust, Series 1 ETF
- Public.com - Buy Invesco QQQ ETF - Stocks - Public app
- Seeking Alpha - QQQ And Tech Earnings: They Can't All Win The CapEx Arms Race (NASDAQ:QQQ)
- Seeking Alpha - Invesco QQQ Trust, Series 1 ETF (QQQ) Latest Stock Analysis
- Barchart - QQQ Barchart Opinion for Invesco QQQ Trust ETF
- Yahoo Finance - BLK & STT Enter Nasdaq 100 Index ETFs, Challenge Invesco QQQ Fund
About this seasonal analysis
Seasonal pattern data is sourced from TradeWave.ai, which analyzes historical price behavior across annual calendar windows going back up to 30 years. Read the full data methodology or the book The 100-Year Pattern by Afshin Moshrefi (2026 edition). Past performance of seasonal patterns does not guarantee future results. This article is for informational purposes only and does not constitute investment advice.