S&P 500 Technology Sector SPDR (XLK) Has Gained in Every Sep 17-Apr 24 Midterm Stretch
S&P 500 Technology Sector SPDR is heading toward a 220-day midterm-year seasonal window that has never been negative in this dataset, even as the ETF trades about 6.6% below its 52-week high.

What is the seasonal pattern for S&P 500 Technology Sector SPDR (XLK)?
S&P 500 Technology Sector SPDR has risen in 6 of 6 midterm-year Sep 17–Apr 24 windows, with an average gain of 12.8% in winning years.
- 6 for 6 in this window, with XLK posting gains every midterm-year Sep 17–Apr 24 stretch in the sample.
- Percent Profitable is 100%, with 6 winners and 0 losers across the last six midterm election years.
- Average profit in winning years is 12.8%, contributing to a cumulative return of 105% when the window is stacked over the sample.
- The trade direction is long, supported by a Sharpe ratio of 2.56 and a TradeWave Ratio of 1.61, indicating strong risk-adjusted and directional travel.
- Individual years have seen sizable swings inside the window, with best point-to-peak moves reaching up to 31.85% and worst drawdowns as deep as 21.6% before recovering.
- The 220-day window opens on Sep 17, 2026 and runs into the pre-election year, aligning with a historically supportive phase for technology-heavy benchmarks.
According to historical data from TradeWave.ai, this upcoming midterm-to-pre-election stretch has behaved very differently from an average year for XLK. The next section walks through how that pattern has played out in prior cycles and what it implies for the calendar ahead.
How has S&P 500 Technology Sector SPDR (XLK) traded in this midterm-year window?
S&P 500 Technology Sector SPDR has booked gains in every single Sep 17–Apr 24 midterm-year window in this dataset, averaging a 12.8% rise across six cycles. At 185.69, XLK sits about 6.6% below its 52-week high of 198.26 and roughly 192.7% above its 52-week low, leaving it elevated on a one-year view but off the peak.
The presidential election cycle matters here because this pattern only looks at the last six midterm election years, then follows XLK from mid-September into the following spring. That means the window not only captures late-year positioning in a politically noisy period, it also runs into the year before the presidential election, which has often been a supportive backdrop for risk assets.
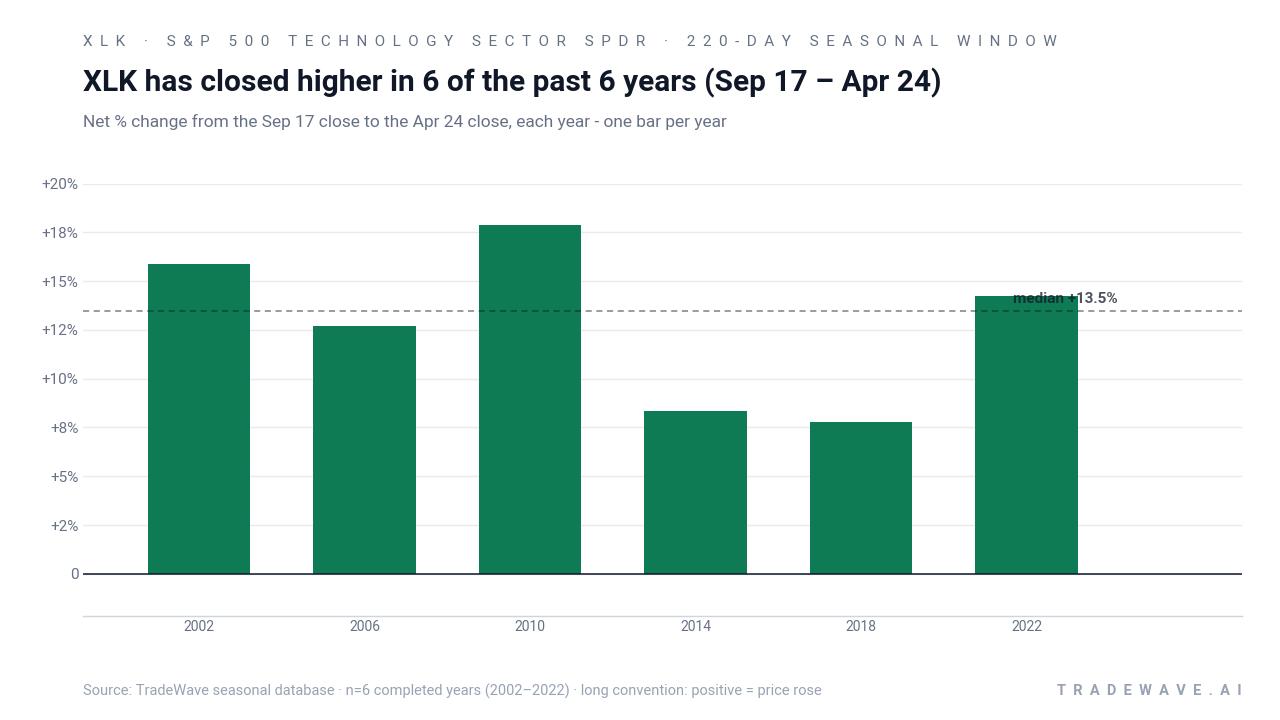
Historically, the trade direction for this XLK seasonal trend is long. Percent Profitable is 100%, with 6 winners and 0 losers, so every midterm-year Sep 17–Apr 24 stretch in the sample ended with the ETF higher than where it started. Average profit across those winning years is 12.8%, with a median gain of 13.48%, which lines up with a cumulative return of 105% when the window is compounded across the six cycles.
The per-year record shows how that played out in practice. The strongest outcome came in 2010, when XLK gained 17.86% over the window, while 2002 and 2022 also delivered double-digit net returns of 15.87% and 14.23% respectively. Even the softer years, such as 2014 and 2018, still finished positive at 8.32% and 7.77%, which is why there are no losing entries in this particular midterm-year slice.
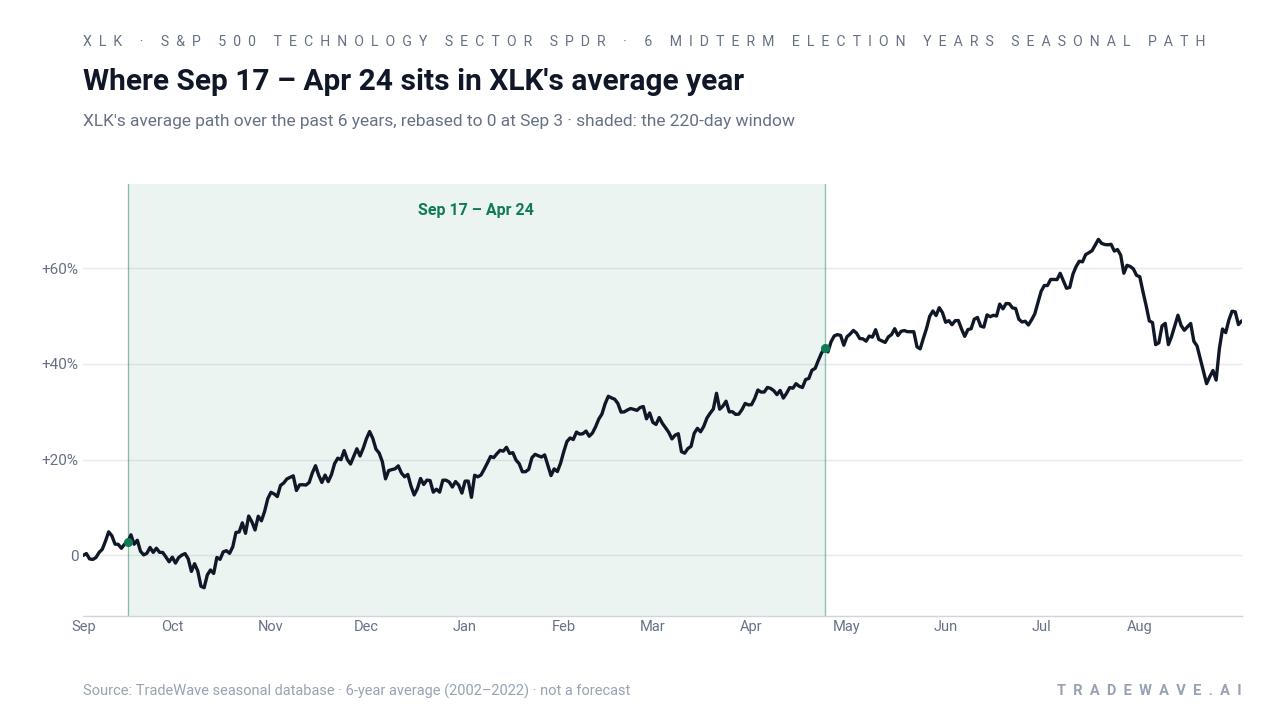
The historical seasonal average path suggests that gains have tended to build steadily rather than in a single burst. In prior midterm cycles, XLK has usually pushed higher through the fall, absorbed volatility around year-end, then extended the move into the early part of the year before flattening out toward the end of the window.
Yearly net and intraperiod swings show how much XLK has typically traveled in both directions before the window closes.
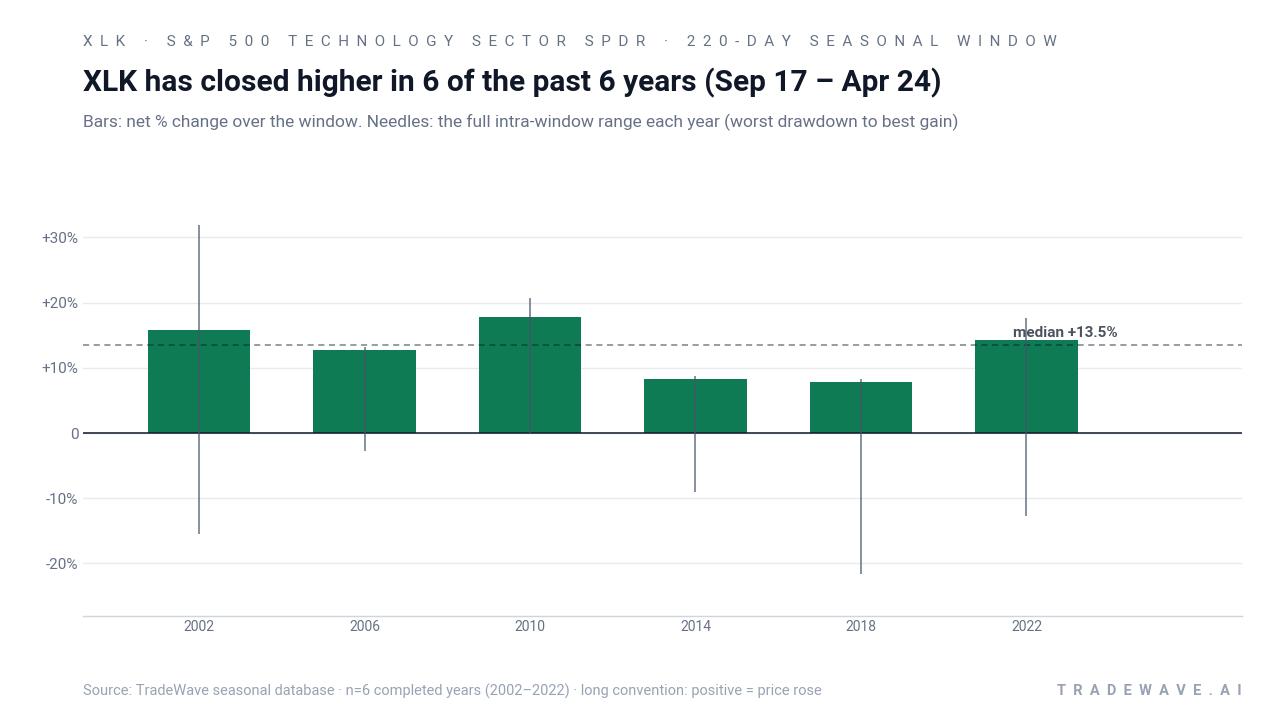
The maximum favorable move, or best point-to-peak gain within the window, has been sizable in several years, reaching 31.85% in 2002 and 20.67% in 2010. At the same time, the maximum adverse move, or worst drawdown from the entry, has occasionally been sharp, including a 21.6% slide in 2018 and a 15.55% drop in 2002 before the ETF recovered to finish higher. That mix of strong MFE and sometimes deep MAE is consistent with a long pattern that has rewarded patience but demanded a high tolerance for volatility.
Put together, the record is clean: six for six, double-digit average gains, and a long bias that has persisted across very different macro backdrops. The pattern is clear enough that this 220-day stretch stands out as one of XLK’s most consistently positive midterm-year windows in the TradeWave dataset.
Why does S&P 500 Technology Sector SPDR (XLK) follow this seasonal pattern?
One likely driver is the way technology earnings and guidance cluster from late Q3 through Q1, which often sets the tone for growth expectations into the year before the presidential election. Analysts have also pointed to institutional portfolio repositioning around fiscal year-end and sector rotation into higher-beta tech as policy uncertainty from the midterm election fades. This XLK seasonal trend may reflect that combination of earnings leadership, improving policy visibility, and renewed risk appetite as markets pivot toward the pre-election year.
History does not guarantee future results; adverse excursions can be large even in winning windows, and past seasonal strength does not ensure similar outcomes in future cycles.
What is driving S&P 500 Technology Sector SPDR (XLK) today?
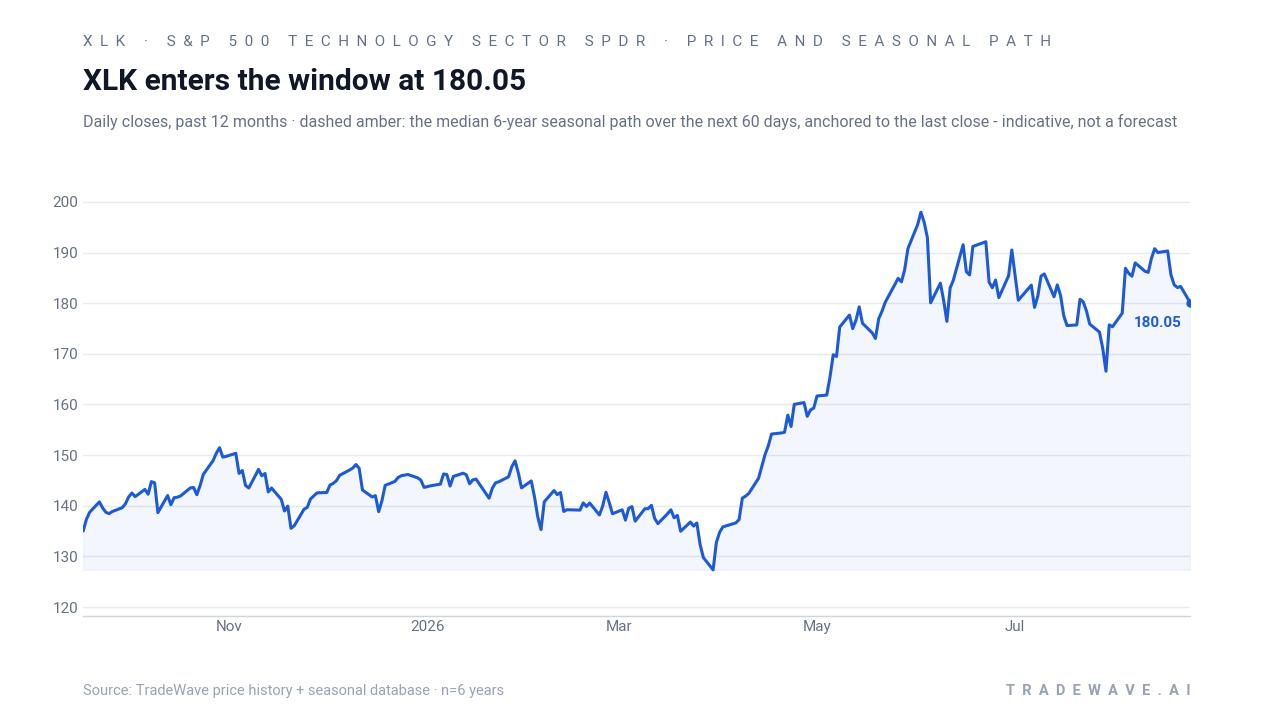
S&P 500 Technology Sector SPDR last traded at 185.69, down 1.55% on the day and sitting about 6.6% below its 52-week high of 198.26 while far above its 52-week low of 63.40. The ETF remains tightly focused on information technology, with roughly 100% of its portfolio in the sector and its top 10 holdings accounting for about 61.04% of assets, which keeps XLK highly sensitive to moves in a handful of mega-cap names.[2]
Macro drivers remain centered on artificial intelligence and data center demand, with AI-focused memory and logic chips cited as key supports for technology earnings and, by extension, XLK’s performance.[1] In June 2026, Zacks highlighted the ETF’s concentrated exposure to large-cap tech as a way to capture that theme, while also noting the risks that come with such a narrow sector bet.[2] GuruFocus in July 2026 pointed out that there has been no reported insider buying or selling activity for XLK over the prior 12 months, which removes one potential signal but also suggests a relatively stable ownership base.[3]
The chart below shows how XLK’s recent pullback fits against its 12-month trend and the median seasonal path over the next 60 days.
What should traders watch as this XLK seasonal window approaches?
First, the calendar: the 220-day window opens on Sep 17, 2026, so price action in the next couple of weeks will determine whether XLK enters the historical pattern from a position of strength or after a deeper consolidation. Second, levels: traders will be watching how the ETF behaves around the 52-week high near 198, since prior midterm-year windows have often seen strong follow-through when XLK has broken to new highs early in the stretch.
Third, macro and earnings catalysts: Q1 2026 technology earnings were flagged earlier this year as a potential trigger for a breakout in XLK, and the next earnings season will again test whether AI and data center demand can keep driving sector profits.[1] Finally, sector concentration and flows matter. With information technology making up essentially the entire ETF and a majority of assets sitting in a small group of mega-caps, any shift in sentiment toward those names can quickly amplify or blunt the historical seasonal tendency.[2] If XLK respects support on pullbacks and leadership stocks continue to attract capital as the window opens, that would be consistent with the past six midterm-year patterns; a failure to hold key levels or a rotation out of tech would mark a clear break from the historical script.
Sources
About this seasonal analysis
Seasonal pattern data is sourced from TradeWave.ai, which analyzes historical price behavior across annual calendar windows going back up to 30 years. Read the full data methodology or the book The 100-Year Pattern by Afshin Moshrefi (2026 edition). Past performance of seasonal patterns does not guarantee future results. This article is for informational purposes only and does not constitute investment advice.