Nasdaq 100 (NDX) Has Rallied in 9 of 9 Midterm Windows, Averaging 33.25% Gains
Nasdaq 100 is hovering just below its 52-week high as it heads toward a 300-day midterm-year seasonal window that has never closed lower in the past nine cycles, sharpening the focus on tech-led volatility into 2027.
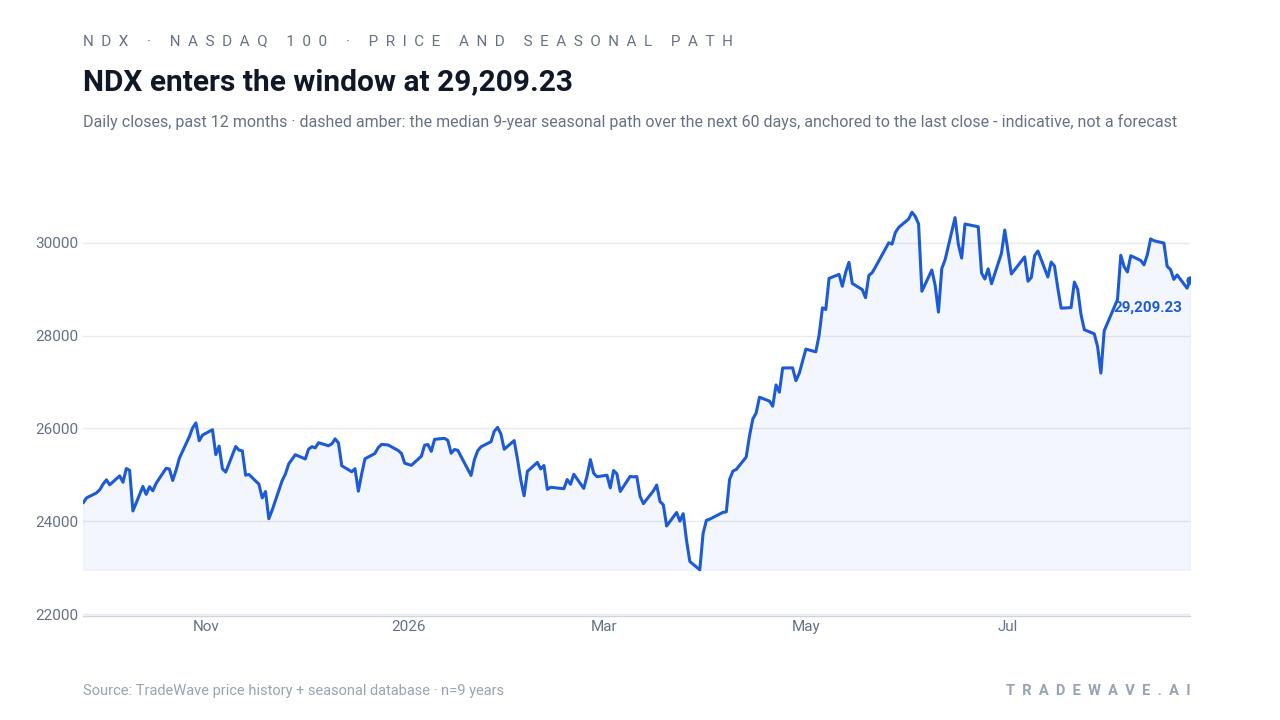
Price as of Aug 26, 2026: $29,224.52 (last close).

What is the seasonal pattern for Nasdaq 100 (NDX)?
Nasdaq 100 has risen in 9 of 9 midterm-year Sep 25 to Jul 21 windows, with an average gain of 33.25% in winning years.
- 9 for 9 in this window, averaging 33.25% gains in winning years across the last nine midterm election cycles.
- Seasonal window runs from Sep 25 for 300 days, covering the late midterm election year into the following pre-election year.
- Percent Profitable is 100%, with 9 winners and 0 losers over the full lookback sample.
- Annualized return of 32.0% and a Sharpe ratio of 1.54 point to unusually strong risk‑adjusted performance.
- TradeWave Ratio of 1.52 indicates that price has typically traveled meaningfully in the long direction within the window, not just at the close.
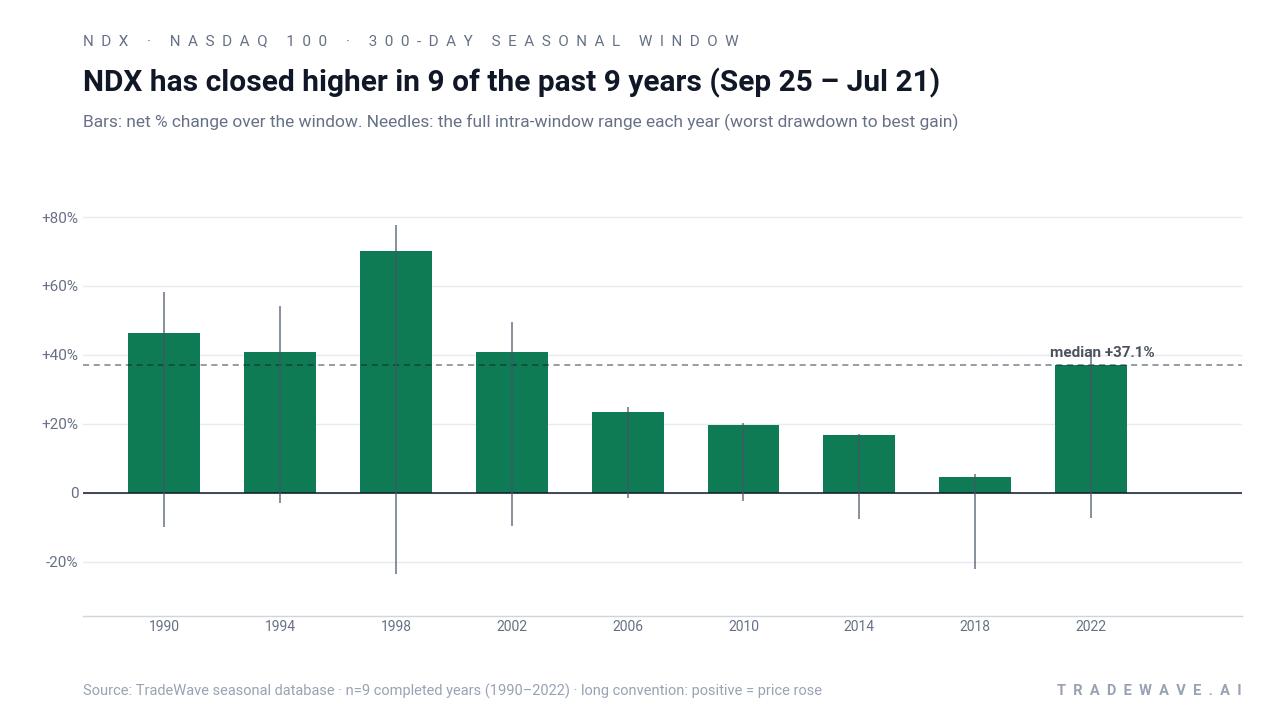
- Individual years have still seen sizeable drawdowns inside the window, with adverse moves exceeding 20% in some cycles before recovering.
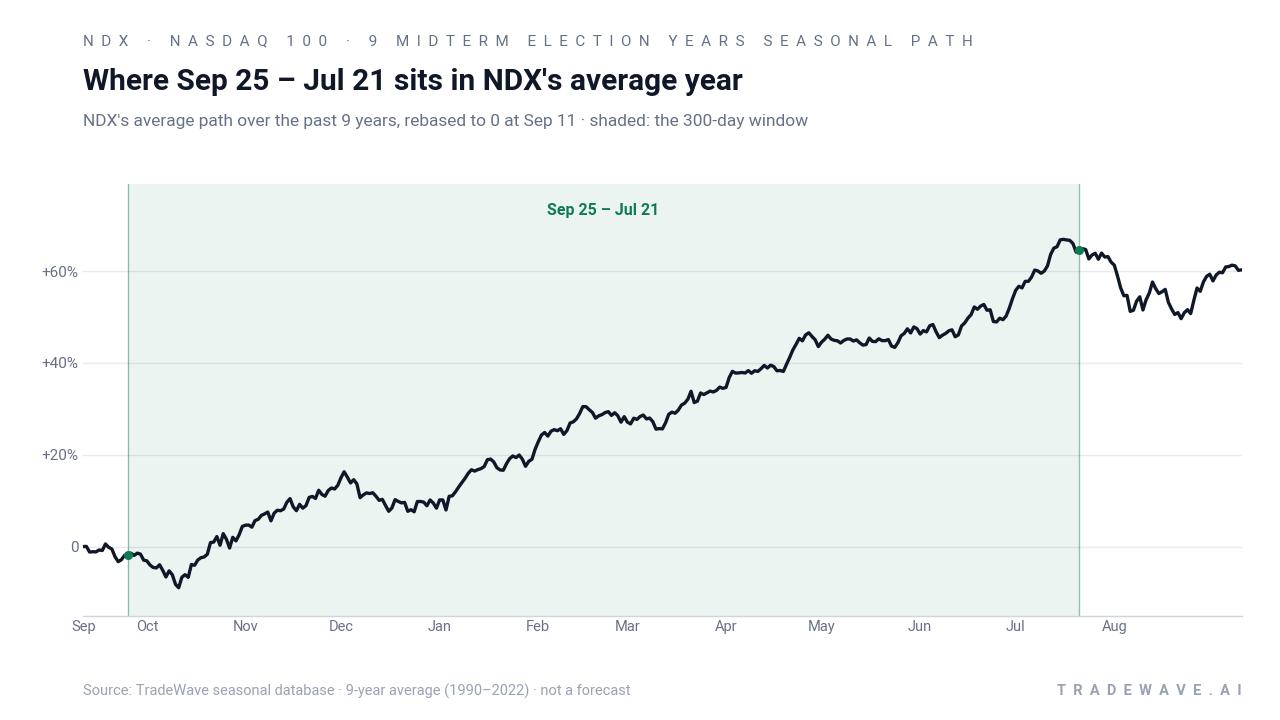
According to historical data from TradeWave.ai, this midterm-to-pre-election stretch has behaved very differently from an average year for the Nasdaq 100. The next section walks through how that pattern has played out in prior cycles and what it means for the coming 300-day window.
How has Nasdaq 100 (NDX) traded in the midterm-to-pre-election seasonal window?
Nasdaq 100 has closed higher in every single Sep 25 to Jul 21 window across the last nine midterm election years, posting an average gain of 33.25% for long positions. The index finished the prior session at 29,224.52, leaving it about 4.8% below its 52-week high and roughly 28.0% above its 52-week low. With NDX options increasingly used as a primary vehicle for tech risk and short-dated contracts growing in popularity, the way traders lean into this historically powerful window could amplify volatility around key macro and earnings events.[3]
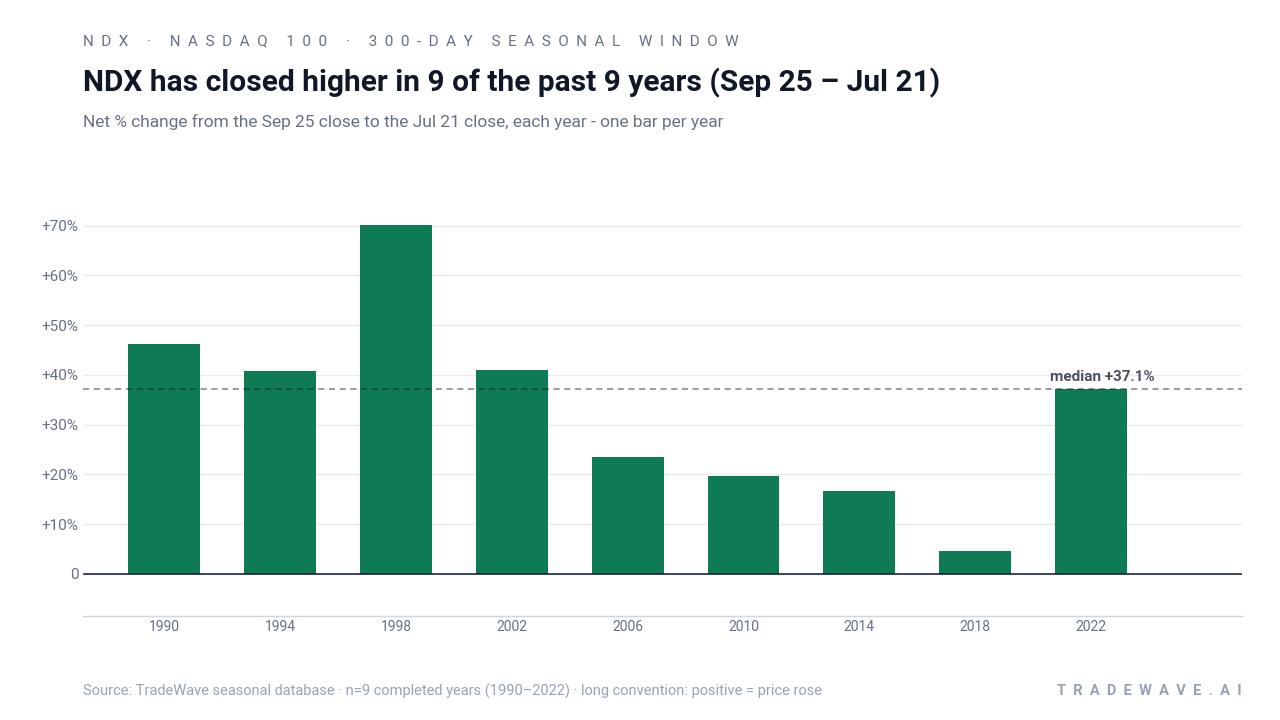
The presidential election cycle matters here because this 300-day stretch sits squarely in the handoff from the midterm election year to the year before the presidential election, a phase that has often coincided with friendlier policy tone and stronger risk appetite. In this sample, the trade direction is explicitly long, and every completed midterm-year iteration from 1990 through 2022 finished in positive territory for NDX. The median profit of 37.07% shows that the typical outcome has been even stronger than the simple average, with several cycles delivering outsized gains.
Looking at individual years, 1998 stands out as the strongest example, with a net return of 70.03% between the Sep 25 entry and the Jul 21 exit. That year also saw a maximum favorable move of 77.57% inside the window before giving back a small portion into the close, while the worst drawdown from entry was a sizable 23.51%. At the other end of the spectrum, 2018 still finished higher by 4.52%, but the path was rougher, with an intraperiod drawdown of 22.06% before the index clawed back into positive territory by the end of the window.
The maximum favorable excursions show how far NDX has tended to run when this pattern works. Across the nine years, peak gains inside the window often exceeded the final net return, which is what the TradeWave Ratio of 1.52 is capturing: price has typically traveled materially in the long direction during the window, not just drifted higher into the close. At the same time, maximum adverse moves have at times been deep, with several cycles experiencing double-digit drawdowns before recovering, underscoring that even a strong seasonal bias has come with real volatility.
A second view of yearly ranges highlights how upside and downside swings have coexisted inside this bullish window.
The cumulative return profile is equally striking. Compounding this 300-day window across the nine midterm election years in the sample produces a cumulative gain of 1,116%, reflecting how repeatedly capturing this slice of the calendar would have stacked returns over time. Add it up: nine straight winning windows, a median gain north of 37%, and a risk-adjusted profile that stands out even in a tech-heavy index known for big swings.
History does not guarantee future results; adverse excursions (MAE) can be large even in winning windows.
Why does Nasdaq 100 (NDX) follow this seasonal pattern?
One likely driver is the way the policy and earnings calendar lines up in the midterm-to-pre-election phase, when Washington uncertainty often fades and corporate guidance tends to firm up. Analysts have pointed to institutional portfolio rebalancing, tech-sector capital spending cycles, and index inclusion flows as additional forces that can funnel money into growth stocks during this stretch.[3] The pattern may also reflect how options hedging and positioning around major tech names concentrate into this part of the cycle, reinforcing rallies once they get underway.
What is driving Nasdaq 100 (NDX) today?
Nasdaq 100 ended the prior session at 29,224.52, up 0.05% on the day, leaving it about 4.8% below its 52-week high of 30,762.20 and roughly 28.0% above its 52-week low of 22,841.42. The index has been led by mega-cap technology names, with NDX outperformance this summer tied to a tech-led recovery and options markets pricing higher correlation than the S&P complex as traders lean on index options for both hedging and speculation.[1][3] NDX is also absorbing structural shifts such as the planned inclusion of SpaceX, which is expected to pull additional passive capital into the benchmark and could add another layer of liquidity and volatility as index funds adjust.[4]
The chart below shows NDX’s past year of trading alongside a 60-day seasonal projection based on prior midterm-year windows.
In Feb 2026, Nasdaq highlighted how Nvidia’s earnings have become a central volatility event for NDX, with index options used to express views on both the stock and the broader tech complex.[2] More recently, commentary in Jul 2026 pointed to a “summer rally” dynamic, where NDX outperformance has gone hand in hand with richer index option pricing and growing use of short-dated contracts to trade around macro data and policy headlines.[3] That backdrop means the upcoming seasonal window will not play out in a vacuum: options-driven flows, mega-cap earnings, and index inclusion changes are likely to shape how closely this cycle tracks the historical pattern.
What should traders watch as this NDX seasonal window approaches?
First, the calendar. The 300-day window opens on Sep 25 and runs deep into the year before the presidential election, a phase that has historically aligned with friendlier policy tone and stronger risk appetite for growth assets. Traders will be watching how NDX behaves around that date relative to the historical script, especially if the index is still trading near the upper end of its 52-week range.
Second, key levels. On the upside, the 52-week high near 30,762 is the obvious reference point; a decisive break into new highs early in the window would be consistent with prior strong years. On the downside, the 50-day moving average around 29,307 and the 22,841 area that marked the 52-week low are the main markers for whether any pullback remains a routine drawdown or starts to challenge the bullish seasonal tendency.
Third, options behavior. NDX options have become a preferred tool for expressing tech views, with growth in short-dated contracts and richer implied correlation versus the S&P complex.[3] If the seasonal window kicks off with heavy call buying and elevated implied volatility, that would signal traders leaning into the historical upside bias; a shift toward put-heavy hedging or compressed implied volatility would suggest more skepticism about a repeat of past cycles.
Finally, the macro and policy calendar. Major central bank meetings, inflation prints, and flagship tech earnings, including Nvidia’s next results, will all land inside this 300-day stretch.[2][3] The historical pattern has been strong enough to overcome shocks in prior cycles, but the path has rarely been smooth, and intraperiod drawdowns north of 20% in some years are a reminder that even a nine-for-nine window can be a rough ride.
Sources
- Yahoo Finance (NZ) - NASDAQ-100 (^NDX) charts, data and news – Yahoo Finance
- Nasdaq - Purgatory of the Markets: Navigating NDX Volatility Amidst NVDA Earnings
- Nasdaq - Summer Rally Signals: Why NDX Outperformance Points to ...
- Yahoo Finance - SpaceX (SPCX) Joins The Nasdaq 100 In A Big Test For Passive Funds
About this seasonal analysis
Seasonal pattern data is sourced from TradeWave.ai, which analyzes historical price behavior across annual calendar windows going back up to 30 years. Read the full data methodology or the book The 100-Year Pattern by Afshin Moshrefi (2026 edition). Past performance of seasonal patterns does not guarantee future results. This article is for informational purposes only and does not constitute investment advice.