IBM Nears New Midterm Window After Rallying in 7 of Last 8
IBM is trading around $231 as it heads toward a long midterm-to-pre-election seasonal window that has usually rewarded the bulls.
Price as of Sep 1, 2026: $231.40 (last close).

What is the seasonal pattern for IBM (IBM)?
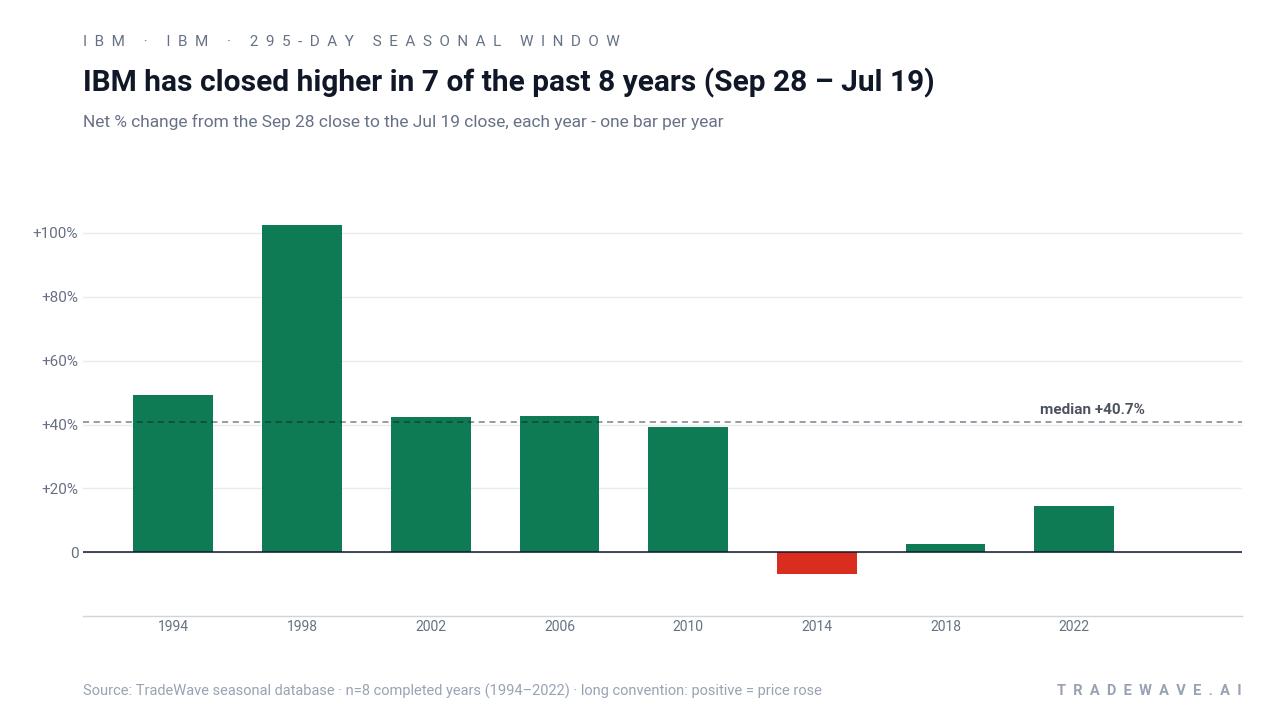
IBM has risen in 7 of 8 years during this Sep 28 to Jul 19 midterm-year window, with an average gain of 41.83% in winning years.
- 7 wins and 1 loss in this 295-day window across the last 8 midterm election years, with winning years averaging 41.83% gains.
- Percent Profitable sits at 88%, with 7 winners and 1 loser, while the all-years average return is still a hefty 36%.
- The trade direction is long, and the pattern runs from Sep 28 through Jul 19, spanning the handoff from the midterm election year into the pre-election year.
- The worst losing year in the sample dropped 6.69%, but several winning years posted net gains above 40%, including one above 100%.
- Intraperiod swings have been meaningful, with some years seeing double-digit drawdowns even as the window ultimately finished higher.
- A TradeWave Ratio of 1.13 and a Sharpe ratio of 0.96 point to historically strong, but not risk-free, upside in this IBM trading window.
According to historical data from TradeWave.ai, this is not just another calendar stretch for IBM but a distinct midterm-to-pre-election regime that has behaved differently from the rest of the year.
How has IBM (IBM) traded in the upcoming Sep 28 to Jul 19 window?
IBM has closed higher in 7 of the last 8 midterm election cycles during the 295-day window that runs from Sep 28 to Jul 19, with cumulative gains of 835% when those slices are stacked. Shares finished the prior session at $231.40, down 1.1% on the day and sitting about 29.4% below their 52-week high near $327.74, leaving plenty of room above if the historical seasonal trend reasserts itself.
The presidential election cycle matters here because this IBM seasonal pattern is built only from midterm election years, then carried through into the following pre-election year. That aligns the window with a policy backdrop that has often featured a shift from mid-cycle uncertainty to a more supportive fiscal and regulatory tone as Washington gears up for the next presidential race.
This seasonal window begins on Sep 28 and spans 295 days. Historically, during this period, IBM has shown a strong bullish tendency when traded long, with 88% of the sampled midterm cycles finishing in the green and only one losing year in the dataset.
The average gain in winning years is 41.83%, while including the lone loser still leaves an all-years average of 36%. The median outcome, at 40.68%, sits close to those averages, which suggests the wins have been consistently large rather than driven by a single outlier.
Looking at individual years, 1998 stands out with a net return of 102.29% between the Sep 28 entry and the Jul 19 exit, while 2014 is the one clear miss, with a 6.69% loss over the same span. Even the softer 2018 window still finished up 2.62% despite a deep intraperiod drawdown.
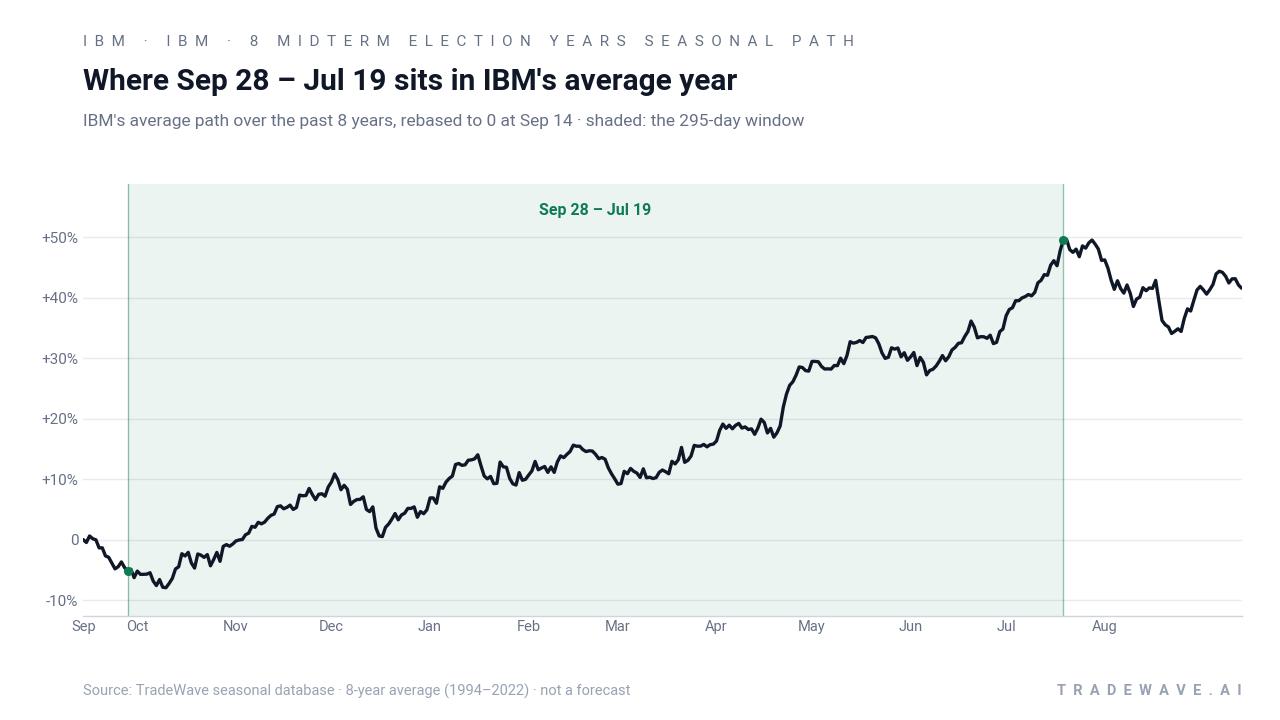
The historical seasonal average suggests IBM tends to build gains steadily through this stretch rather than spiking early and fading. The path is not a forecast, but it shows that in prior midterm cycles, the stock has usually trended higher across much of the window, with only modest soft spots.
Yearly net and intraperiod ranges show how upside and downside have coexisted inside this bullish pattern.
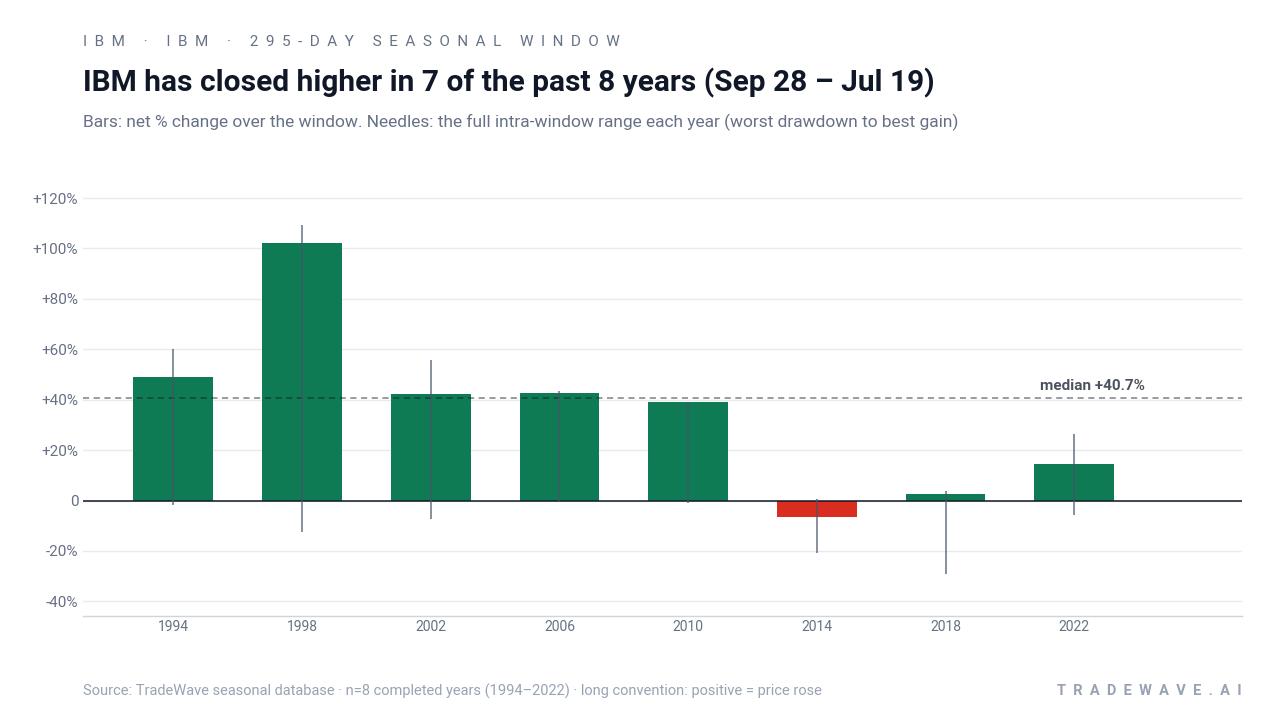
The combined net-return and range chart shows that maximum favorable moves have often been very large, with several years posting peak gains north of 40% and one above 100%, while maximum adverse moves have at times reached into the mid- to high-teens on a percentage basis. In other words, the window has historically rewarded long exposure but has not been a smooth ride, with sizable drawdowns occurring even in years that ultimately finished higher.
History does not guarantee future results; adverse excursions (MAE) can be large even in winning windows.
Why does IBM (IBM) follow this seasonal pattern?
One likely driver is the way IBM’s earnings calendar and enterprise spending cycles line up with the midterm-to-pre-election policy backdrop. Corporate IT budgets often loosen as macro visibility improves and fiscal policy turns more supportive heading into a presidential race, which can favor large-cap tech and software names. Analysts have also pointed to institutional portfolio rebalancing and sector rotation into quality tech during these phases, which may help explain why this specific IBM seasonal window has been so consistently strong.
What is driving IBM (IBM) today?
IBM ended the prior session at $231.40, down 1.1% on the day, after trading between $229.90 and $233.09 on volume of about 3.2 million shares. That leaves the stock well below its 50-day moving average around $241.07 and roughly 29.4% under its 52-week high near $327.74, even after a 4.83% gain over the past month, while 20-day average volume sits closer to 5.2 million shares.
The chart below situates the latest move in its recent multi-month context and overlays the median 60-day seasonal path.
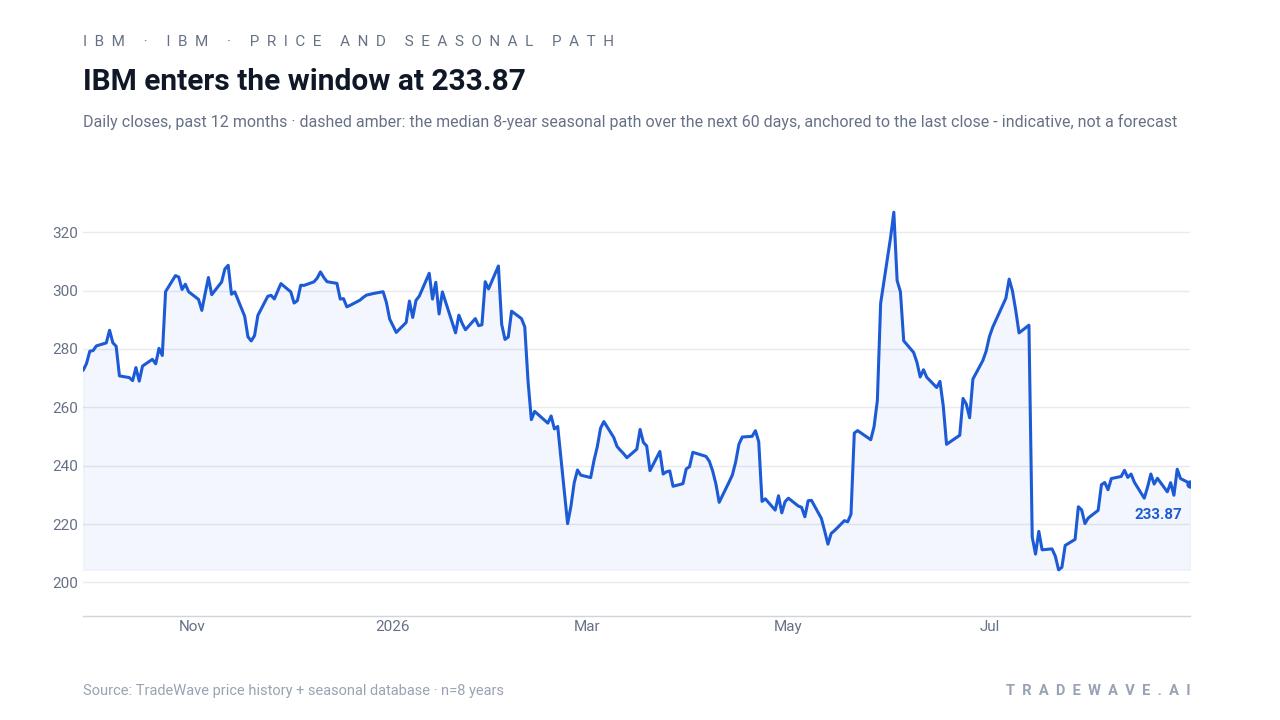
With no major company-specific catalysts on the immediate calendar and the next earnings date still to be confirmed, the near-term story is more about positioning than headlines. The stock is consolidating after a strong run earlier in the year, and the gap between price and the upcoming seasonal window gives traders a clean line of sight into how IBM behaves as the market wraps up the midterm election year and moves into the historically stronger pre-election phase.
What should traders watch as IBM approaches this seasonal window?
First, the calendar: the 295-day window opens on Sep 28 and runs through Jul 19, so any sustained trend that develops in late September and October will be the first real test of whether the historical IBM seasonal trend is repeating. A firming tape that holds above the recent $230 area and starts to reclaim the 50-day moving average would be more in line with the long-biased pattern, while a break back toward the 52-week low zone would argue that this cycle is diverging from history.
Second, watch the policy and macro backdrop as the United States concludes the midterm election year and pivots toward the presidential campaign. If fiscal and regulatory signals tilt more supportive for enterprise tech spending, that would rhyme with prior cycles in which IBM’s midterm-to-pre-election window has been strong. Conversely, a surprise tightening in financial conditions or a slowdown in corporate IT budgets could blunt the historical tailwind.
Finally, monitor volatility inside the window, not just the end-point result. Past cycles show that even winning years have seen double-digit drawdowns along the way, so sharp pullbacks would not automatically invalidate the pattern. What would matter more is whether those dips are bought and whether IBM can ultimately sustain a trend of higher highs and higher lows through the bulk of the Sep 28 to Jul 19 stretch.
Sources
About this seasonal analysis
Seasonal pattern data is sourced from TradeWave.ai, which analyzes historical price behavior across annual calendar windows going back up to 30 years. Read the full data methodology or the book The 100-Year Pattern by Afshin Moshrefi (2026 edition). Past performance of seasonal patterns does not guarantee future results. This article is for informational purposes only and does not constitute investment advice.