Medtronic (MDT) Has Risen in 12 of 12 Midterm Sep 30-Jul 10 Windows, Averaging 23.48% Gains
Medtronic is heading toward a long midterm-election-year seasonal window that has never been negative in this sample, even as the stock trades well off its highs.
Price as of Sep 1, 2026: $92.04 (last close).

What is the seasonal pattern for Medtronic (MDT)?
Medtronic has risen in 12 of 12 midterm-election-year windows starting Sep 30 and lasting 284 days, with an average gain of 23.48% in winning years.
- 12 for 12 in this window, with Medtronic averaging 23.48% gains in winning years across the last 12 midterm election cycles.
- Percent Profitable is 100%, with 12 winners and 0 losers in the Sep 30 to Jul 10 trading window.
- The trade direction is long, with a Sharpe ratio of 1.45 and a TradeWave Ratio of 1.68, pointing to strong risk-adjusted upside in this slice of the calendar.
- Average annualized return across these windows is 22.76%, compounding to a cumulative 1,070% when the pattern is stacked over all 12 years.
- Intraperiod swings have been meaningful, with some years showing double-digit drawdowns before finishing higher, so the ride has not been smooth even in winning seasons.
- The window is tied to the midterm election year and runs 284 days from Sep 30, bridging into the historically supportive year before the presidential election.
According to historical data from TradeWave.ai, this specific midterm-year stretch has behaved very differently from an average calendar year for Medtronic. The next section walks through how that pattern has played out and what it could mean for the coming cycle.
How has Medtronic (MDT) traded in the Sep 30 to Jul 10 midterm-year window?
Medtronic has posted gains in every one of the last 12 midterm-election-year windows starting Sep 30 and running 284 days, with average profits of 23.48% for long positions. Shares finished the prior session at 92.04, up 1.5% on the day and sitting between a 52-week low near 72.00 and a high just under 102, roughly the middle of the recent range. That combination of a clean historical seasonal trend and a stock that is not stretched to new highs gives this upcoming Medtronic trading window unusual weight for investors watching the medical-technology sector’s seasonal outlook.
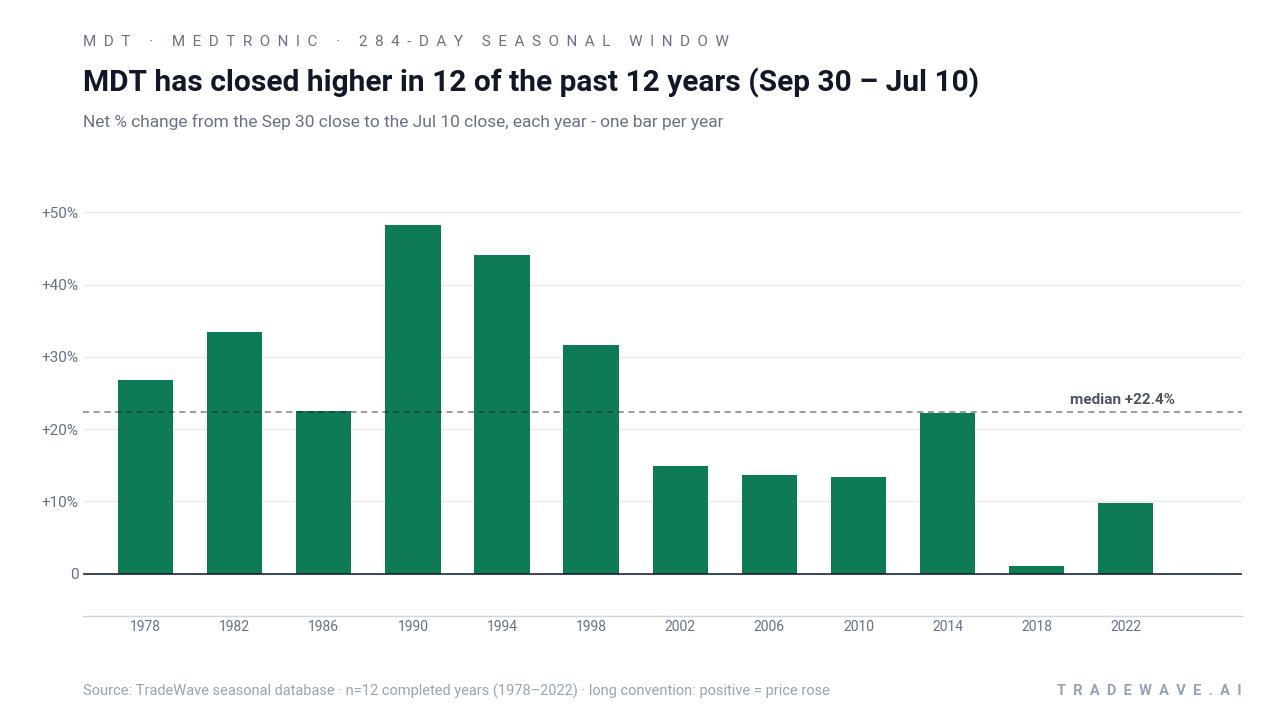
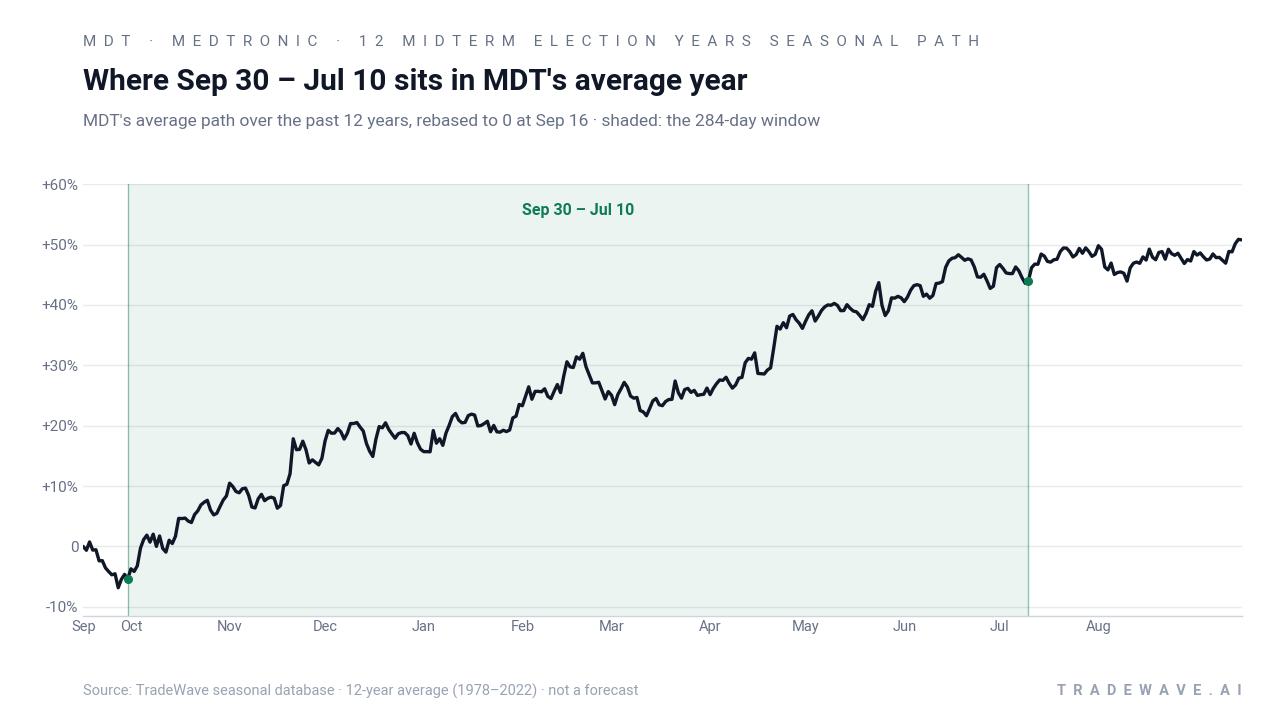
The window itself is long, stretching from Sep 30 of the midterm election year through Jul 10 of the following year, and it sits squarely in the part of the presidential cycle that has often favored risk assets. Grouping by the election cycle matters here because policy, regulation and reimbursement expectations for health care tend to cluster around midterms and the run-up to the presidential election, which can shape how large-cap medical-technology names like Medtronic trade across these months.
Across the 12 completed midterm-year samples, the trade direction is firmly long. Percent Profitable is 100%, with 12 winners and 0 losers, and the annualized return for the window clocks in at 22.76%. Average profit per window is 23.48%, while the median outcome is close at 22.35%, a sign that results have been consistently strong rather than skewed by a single outlier year.
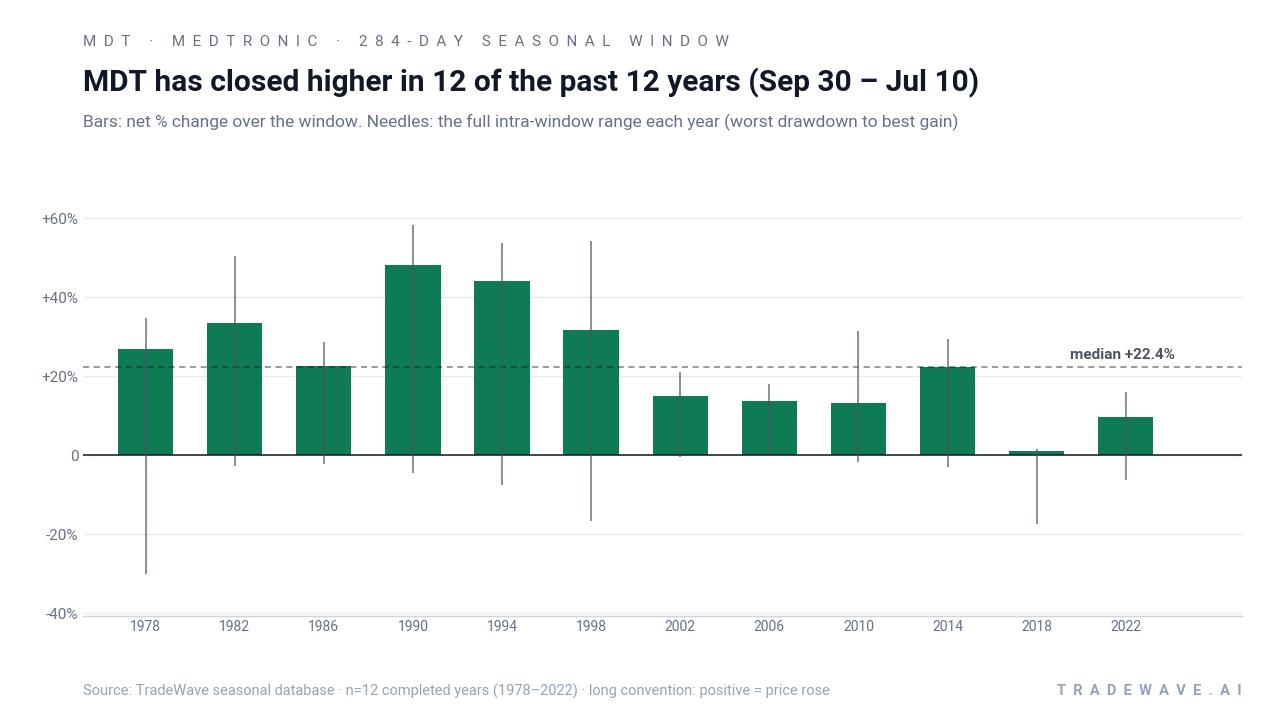
Individual years show a range of outcomes but all positive closes. In 1990, Medtronic gained 48.19% from entry to exit, with a best intraperiod run-up of 58.15% and a worst drawdown of 4.47% from the starting level. In 2018, the stock barely finished higher, up just 1.02% over the window, yet it still experienced a maximum adverse move of 17.46% at one point, underscoring how choppy the path can be even when the final print is green.
Those intraperiod swings are captured in the MFE/MAE profile. Maximum favorable excursions have reached as high as 58.15% in strong years, while maximum adverse excursions have stretched into the mid-teens in weaker ones. That mix of large upside potential and meaningful downside risk inside the window is what drives the TradeWave Ratio of 1.68 and a Sharpe ratio of 1.45, both elevated for a single-stock seasonal pattern.
A second view shows how each year’s net result sits inside its full intraperiod range of gains and drawdowns.
The cumulative view is just as striking. Stacking the 284-day windows back-to-back across the 12 midterm-election-year samples compounds to a 1,070% gain, reflecting how a steady seasonal bias can add up over multiple cycles when it repeats. Add it up: 12 for 12, double-digit average gains, and a long regime that bridges from the late midterm year into the historically supportive year before the presidential election.
History does not guarantee future results; adverse excursions can be large even in winning windows, and traders need to respect the drawdowns that have appeared inside this pattern.
Why does Medtronic (MDT) follow this seasonal pattern?
One likely driver is the way health-care policy and reimbursement debates cluster around midterm elections and the following legislative sessions, which can clear overhangs for large device makers once the political path is clearer. Analysts have also pointed to institutional portfolio rebalancing into defensive growth sectors like medical technology as the cycle shifts from midterm uncertainty into the year before the presidential election. This pattern may reflect that combination of policy clarity and steady demand for Medtronic’s products, which together have historically supported the stock across this long Sep 30 to Jul 10 trading window.
What is driving Medtronic (MDT) today?
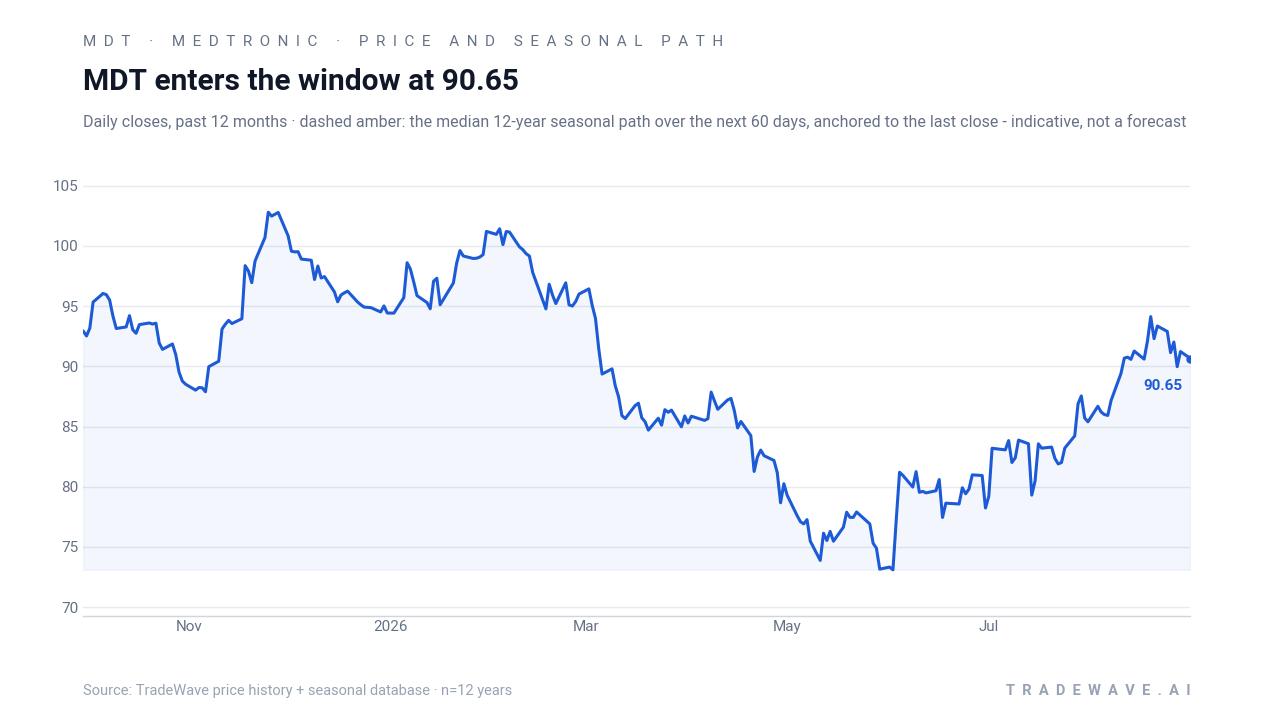
Medtronic closed the prior session at 92.04, up 1.39 points or 1.5% on the day, after trading between 90.80 and 95.41 on volume of about 17.6 million shares. That leaves the stock roughly in the middle of its 52-week band, about 9.7% below its recent high near 101.95 and 27.8% above the low around 72.00, with the 50-day moving average down at 85.60 and 20-day average volume near 6.7 million shares. With no major earnings or guidance updates on the calendar, the move looks more like positioning than a reaction to a single headline, as investors weigh Medtronic’s role as a defensive growth name ahead of the late-September seasonal window.
The chart below situates the latest move in its recent multi-month context and overlays the median 60-day seasonal path.
Sources
About this seasonal analysis
Seasonal pattern data is sourced from TradeWave.ai, which analyzes historical price behavior across annual calendar windows going back up to 30 years. Read the full data methodology or the book The 100-Year Pattern by Afshin Moshrefi (2026 edition). Past performance of seasonal patterns does not guarantee future results. This article is for informational purposes only and does not constitute investment advice.