Nasdaq QQQ Invesco ETF (QQQ) Has Gained in 6 of 6 Midterm Windows, Averaging 20.08% Returns
Nasdaq QQQ Invesco ETF is about to enter a 346-day midterm-year seasonal stretch that has never finished lower in the data, even as tech leadership and macro data keep volatility elevated.

What is the seasonal pattern for Nasdaq QQQ Invesco ETF (QQQ)?
Nasdaq QQQ Invesco ETF has risen in 6 of 6 midterm election years during this Aug 18 to Jul 29 window, with an average gain of 20.08% in winning years.
- 6 for 6 in this window, with Nasdaq QQQ Invesco ETF averaging 20.08% gains across the winning years.
- The upcoming seasonal window starts on Aug 18, 2026 and runs 346 days through Jul 29, spanning the late midterm year into the pre-election year.
- Percent Profitable is 100%, with 6 winners and 0 losers across the last six midterm election years in this pattern.
- Average profit of 20.08% reflects strong upside in each completed window, with a cumulative return of 196% when the windows are stacked.
- Intraperiod swings have been meaningful, with individual years seeing worst drawdowns of up to roughly 22% before finishing higher.
- The pattern is long-directional, with a TradeWave Ratio of 2.13 and a Sharpe ratio of 2.2, pointing to historically favorable risk-adjusted returns in this specific election-cycle slice.
According to historical data from TradeWave.ai, this late midterm-year stretch into the following summer has behaved very differently from an average year for QQQ, and the next iteration begins this week.
How has Nasdaq QQQ Invesco ETF (QQQ) traded in this midterm-year window?
Nasdaq QQQ Invesco ETF has closed higher in every one of the last six midterm election years during the Aug 18 to Jul 29 window, posting an average gain of 20.08% and a cumulative 196% across those cycles. The new 346-day window opens on Aug 18, 2026 with QQQ last changing hands around 731.07, about 2.1% below its 52-week high of roughly 747.00 and well above its 52-week low near 553.49. That combination of a strong historical seasonal trend and a price sitting close to the top of its one-year range gives this regime outsized relevance for traders focused on the Nasdaq-100’s path through the rest of the midterm year and into the pre-election year.
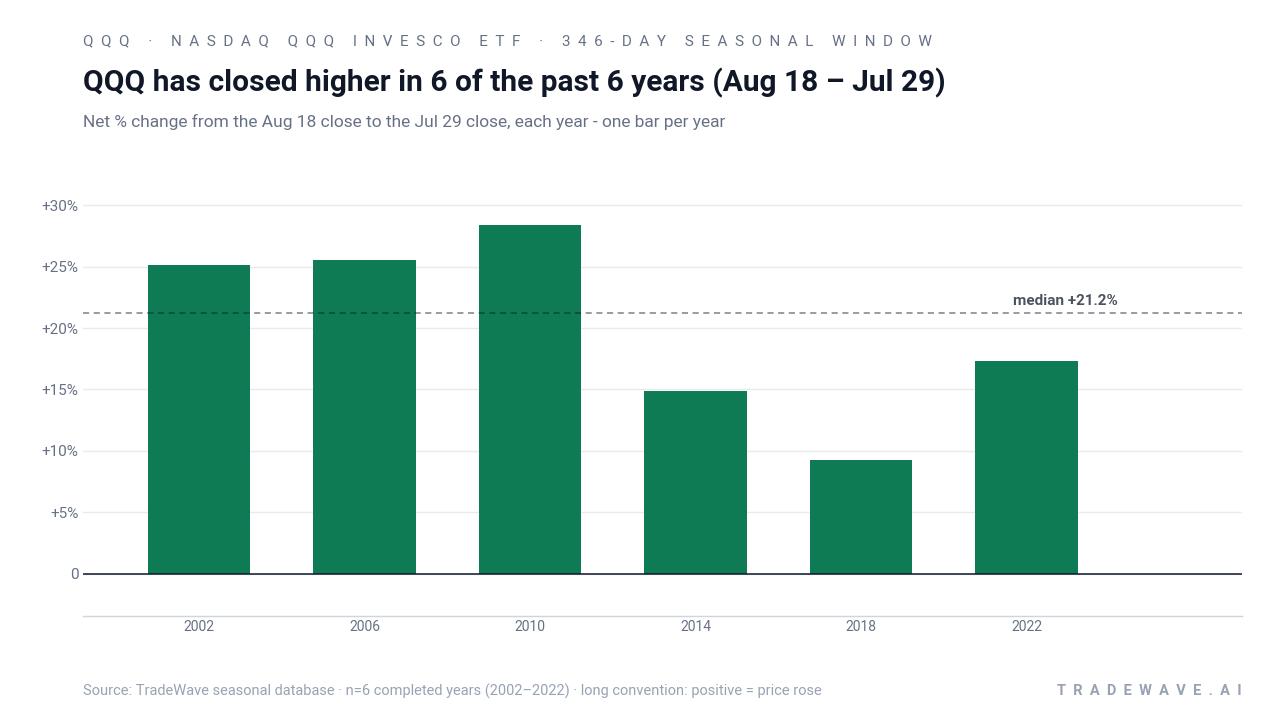
Because this pattern is grouped by the presidential election cycle, it only looks at midterm election years that match the current phase, then follows QQQ from late August of that midterm year into the following summer. That means the six completed samples span 2002, 2006, 2010, 2014, 2018 and 2022, each time capturing the handoff from a midterm election backdrop into the year before the presidential election.
The trade direction for this setup is explicitly long. Across those six midterm-year windows, Percent Profitable is 100%, with 6 winners and 0 losers, and the average profit of 20.08% lines up closely with the 19.89% annualized return and 21.22% median profit. The strongest year in the sample was 2010, when QQQ gained 28.35% between the Aug 18 entry and the Jul 29 exit, while the softest was 2018, which still finished up 9.25% despite a volatile path.
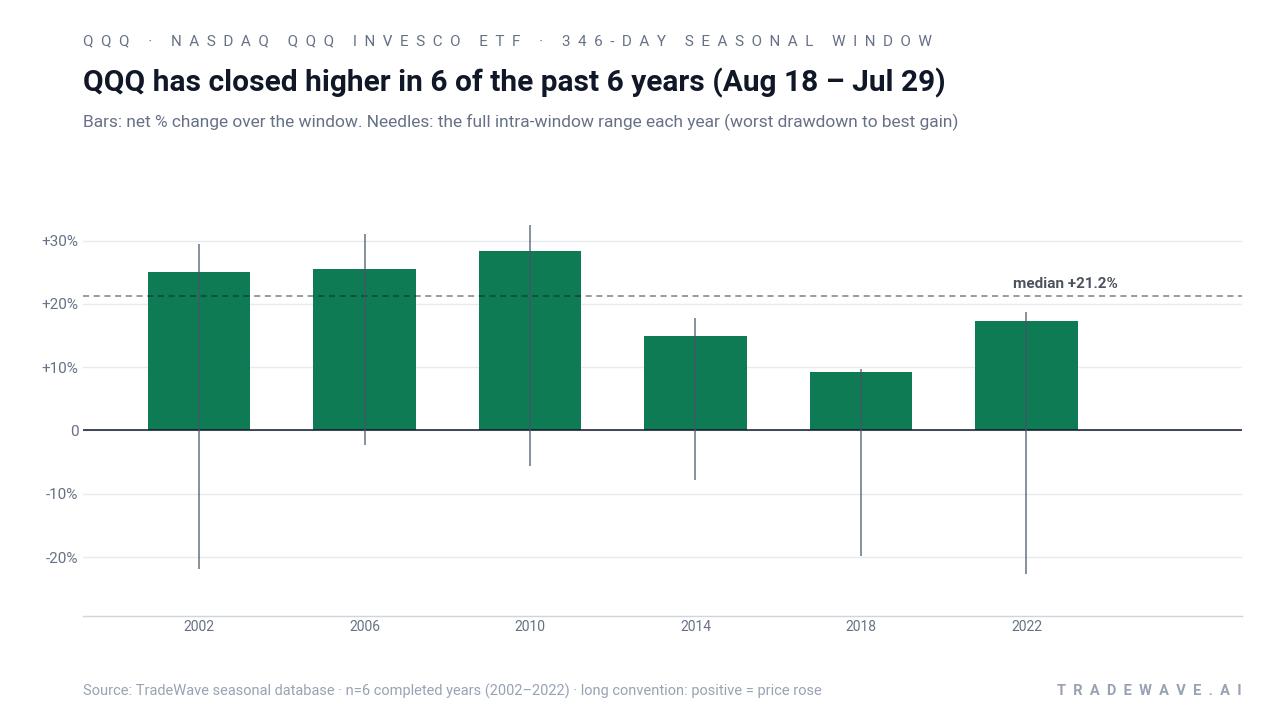
The intraperiod path has not been smooth. In 2002, QQQ’s best point-to-peak move within the window, or maximum favorable excursion, reached 29.45%, but the worst drawdown from entry, or maximum adverse excursion, hit -21.9% before the ETF recovered into the close. In 2022, the pattern again finished higher by 17.35%, yet the worst intraperiod drawdown was -22.64%, underscoring that even “all green” windows can involve deep air pockets along the way.
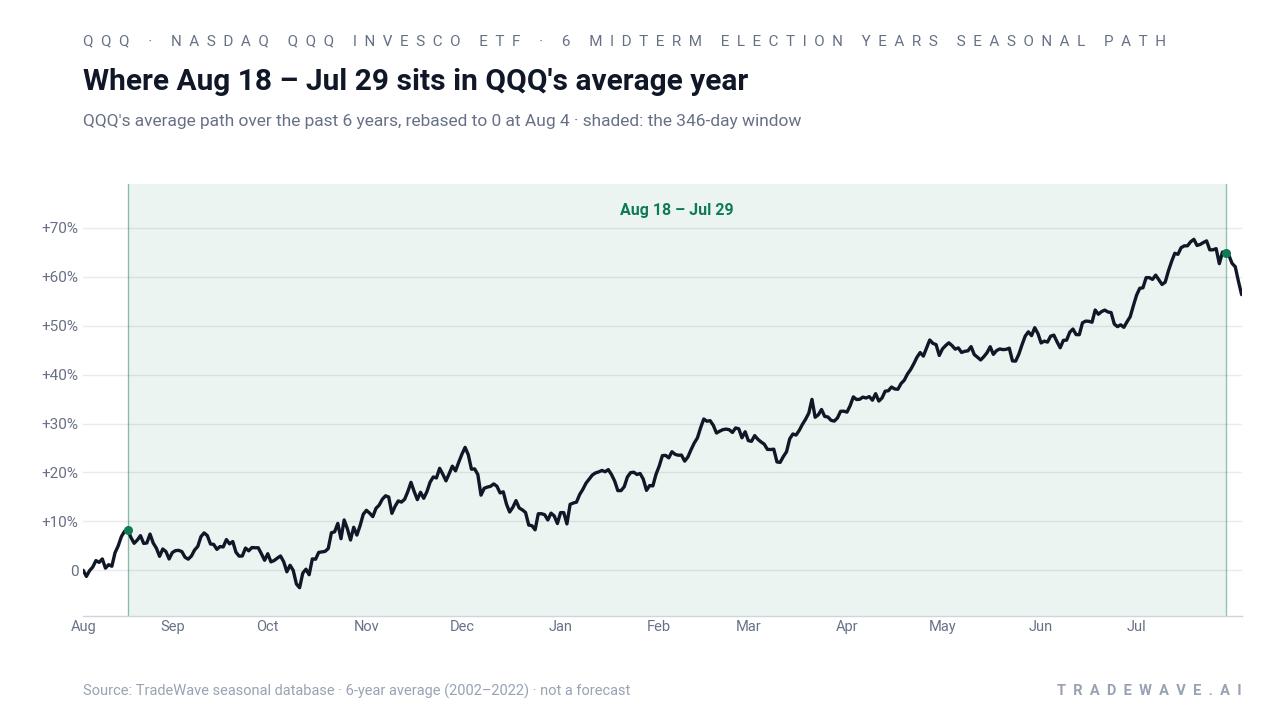
Looking across all six years, the typical QQQ seasonal trend in this window has been to build gains over time rather than spike early and fade. The “Trend Long” and “Trend Long1” metrics, both above 60, point to a consistent upward bias across the days inside the window, with no meaningful short-side trend showing up in the historical profile. That fits the idea of a regime rather than a quick trade: a long stretch where the Nasdaq-100 has tended to grind higher through policy shifts, earnings seasons and year-end portfolio moves.
A second view stacks net returns with both peak run-ups and worst drawdowns to show how wide the yearly trading ranges have been.
The cumulative chart for this pattern compounds each 346-day window on top of the last and reaches 196% across the six completed midterm cycles. Add it up and this specific slice of the calendar has historically delivered nearly a tripling of capital for a long-only approach that only participates in this window.
History does not guarantee future results; adverse excursions can be large even in winning windows, and QQQ has previously seen drawdowns of more than 20% inside this pattern before finishing higher.
Why does Nasdaq QQQ Invesco ETF (QQQ) follow this seasonal pattern?
One likely driver is the way the presidential election cycle shapes policy expectations, liquidity and risk appetite from the midterm election into the year before the presidential vote. Analysts often point to a combination of post-midterm policy clarity, heavy year-end portfolio rebalancing and renewed tech risk-taking in the pre-election year as tailwinds for Nasdaq-100 names. This pattern may also reflect how mega-cap earnings, buybacks and index flows cluster in this stretch, giving QQQ a structural bid that has repeatedly shown up in the historical seasonality.
What is driving Nasdaq QQQ Invesco ETF (QQQ) today?
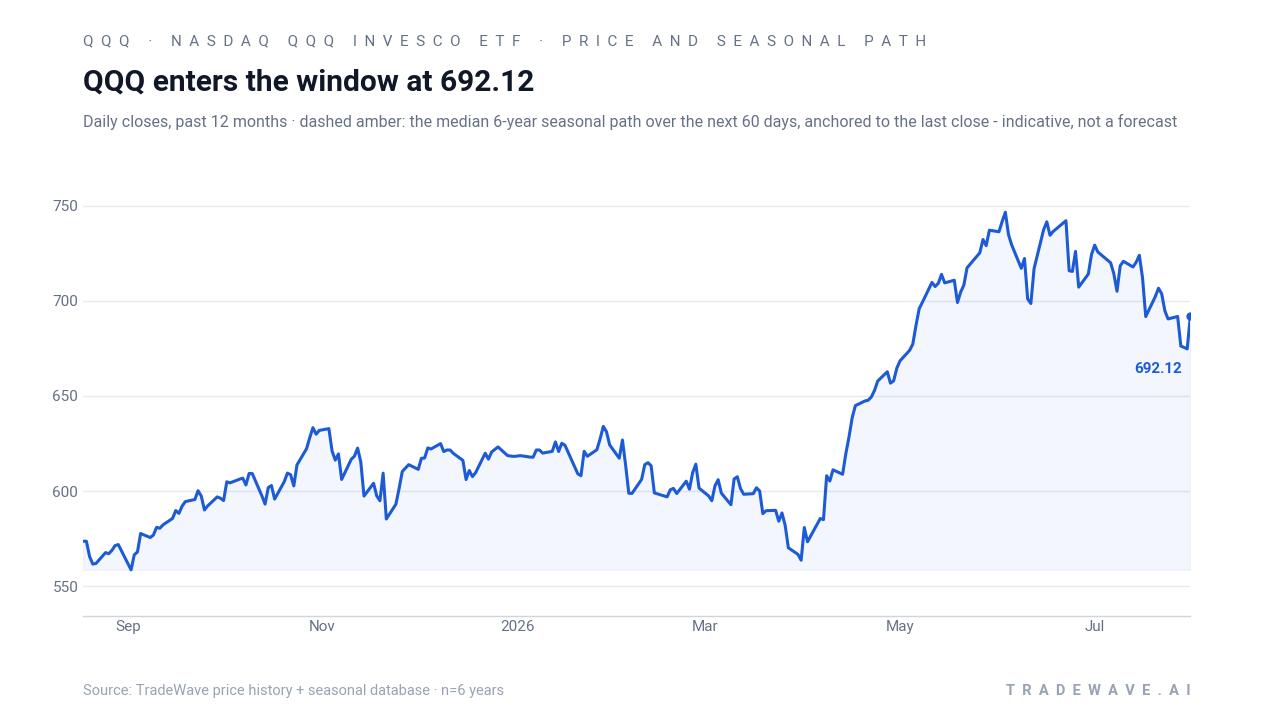
QQQ last traded near 731.07, easing 0.14% in the latest session and sitting about 2.1% below its 52-week high around 747.00 while holding far above its 52-week low near 553.49. The ETF has gained roughly 5.14% over the past month, helped by a favorable producer price report on Aug 13, 2026 that pulled Treasury yields lower and lifted major growth benchmarks.[3] Disappointing consumer data on Aug 14, 2026 then knocked the Nasdaq-100 back from recent highs, reminding traders that softer demand can quickly challenge stretched tech valuations even inside a supportive rate backdrop.[6]
Macro remains the main near-term driver. Softer economic readings have reduced the odds of a Federal Reserve rate hike at the September meeting, and the 10-year Treasury yield has been a key swing factor for QQQ as investors toggle between growth and value exposure.[2] At the same time, technology leadership and semiconductor volatility continue to set the tone for the Nasdaq-100, with upcoming big-tech earnings likely to determine whether the recent advance can broaden or stalls near the top of the range.[1] Institutional interest has stayed active, with recent filings showing firms such as Alpha Zero LLC and Certior Financial Group LLC adding to QQQ positions in mid-August, a sign that some allocators are still leaning into the Nasdaq-100 despite the run-up.[10][11]
The chart below places the latest pullback in the context of QQQ’s past year and overlays the historical 60-day seasonal path as a reference, not a forecast.
What should traders watch as this QQQ seasonal window opens?
First, the calendar. The new window begins on Aug 18, 2026 and runs through Jul 29, 2027, covering the final months of the midterm election year and the bulk of the year before the presidential election. Historically, that transition has been one of the friendliest stretches for risk assets, but the path has included sharp drawdowns along the way, especially around macro data and Fed meetings.
Second, levels. On the upside, traders will be watching whether QQQ can sustain a break above the recent 52-week high near 747.00 and hold that breakout without the kind of 15% to 20% air pockets that marked 2002, 2018 and 2022 inside this same seasonal window. On the downside, any pullback that quickly approaches the 50-day moving average around 712.60 or erases the recent 5.14% one-month gain would signal that this iteration of the pattern is starting with more stress than prior cycles.
Third, the policy and data calendar. Inflation prints, labor-market reports and the Fed’s communications into year-end will shape rate expectations, which in turn drive the valuation math for the Nasdaq-100’s mega-cap growth names.[2][3] If yields drift lower on softer but not recessionary data, the historical QQQ seasonal trend has often had room to play out. A renewed spike in yields or a hawkish surprise would be a clear test of how robust this midterm-to-pre-election pattern really is in the current cycle.
Finally, breadth and sector leadership. The historical window has been kind to QQQ in part because tech and communication-services heavyweights have tended to lead into the pre-election year, supported by strong earnings and buybacks.[1] If this time around the gains narrow to just a handful of names or rotate into more defensive sectors, that would be a sign that the underlying engine behind the past 196% cumulative seasonal return is not fully engaged. Conversely, a broad-based advance with contained drawdowns relative to the prior 20% intraperiod swings would look more like the historical template.
Sources
- MarketWatch, "Invesco QQQ Trust Series I Overview - Investing," Aug 15, 2026
- MarketBeat, "Invesco NASDAQ 100 ETF (QQQM) Short Interest & Short Float | Updated Aug 2026," Aug 12, 2026
- MarketBeat, "Alpha Zero LLC Has $18.54 Million Position in Invesco QQQ $QQQ," Aug 13, 2026
- MarketBeat, "Certior Financial Group LLC Grows Position in Invesco QQQ $QQQ," Aug 13, 2026
About this seasonal analysis
Seasonal pattern data is sourced from TradeWave.ai, which analyzes historical price behavior across annual calendar windows going back up to 30 years. Read the full data methodology or the book The 100-Year Pattern by Afshin Moshrefi (2026 edition). Past performance of seasonal patterns does not guarantee future results. This article is for informational purposes only and does not constitute investment advice.