With VIX at 2026 Lows, CBOE Volatility Index (VIX) Approaches a Historically Bullish Fall Stretch
CBOE Volatility Index is hugging the low end of its 52-week range just weeks before a historically bullish 21-day midterm-year window that has often flipped calm markets into turbulence.
Price as of Aug 21, 2026: $15.13 (last close).

What is the seasonal pattern for CBOE Volatility Index (VIX)?
CBOE Volatility Index has risen in 7 of 8 midterm-year Sep 13–Oct 3 windows, with an average gain of 8.73% in winning years.
- 7 for 8 record in this window, with winning years averaging 8.73% gains for VIX and a 68% cumulative return across cycles.
- The 21-day trading window runs from Sep 13 to Oct 3 in midterm election years and has been a historically bullish VIX seasonal trend.
- Percent Profitable is 88%, with 7 winners and 1 loser across the last 8 midterm election years in this CBOE Volatility Index trading window.
- Avg Profit reflects winners only at 8.73%, while Avg Profit - All, which includes the lone losing year, still comes in at 7%.
- The TradeWave Ratio (TWR) of 3.39 signals that VIX typically travels meaningfully in the long direction inside the window, while a Sharpe ratio of 1.07 points to solid risk-adjusted returns.
- Intraperiod swings have been large, with historical best and worst excursions showing that even winning years can see sharp drawdowns before VIX spikes.
According to historical data from TradeWave.ai, this upcoming stretch of the calendar has behaved very differently from an average month for VIX in past midterm election years.
How has CBOE Volatility Index (VIX) behaved in the Sep 13–Oct 3 midterm window?
CBOE Volatility Index has risen in 7 of the last 8 midterm-year Sep 13–Oct 3 windows, averaging 8.73% gains in the winning years. VIX closed the prior session at 15.13, down 5.5% on the day and sitting about 57.1% below its 52-week high of 35.30 while hovering roughly 13.1% above its 52-week low of 13.38. That combination of a strong historical seasonality and a current level near the bottom of this year’s range sets up a classic calm-before-the-storm backdrop for equity volatility.
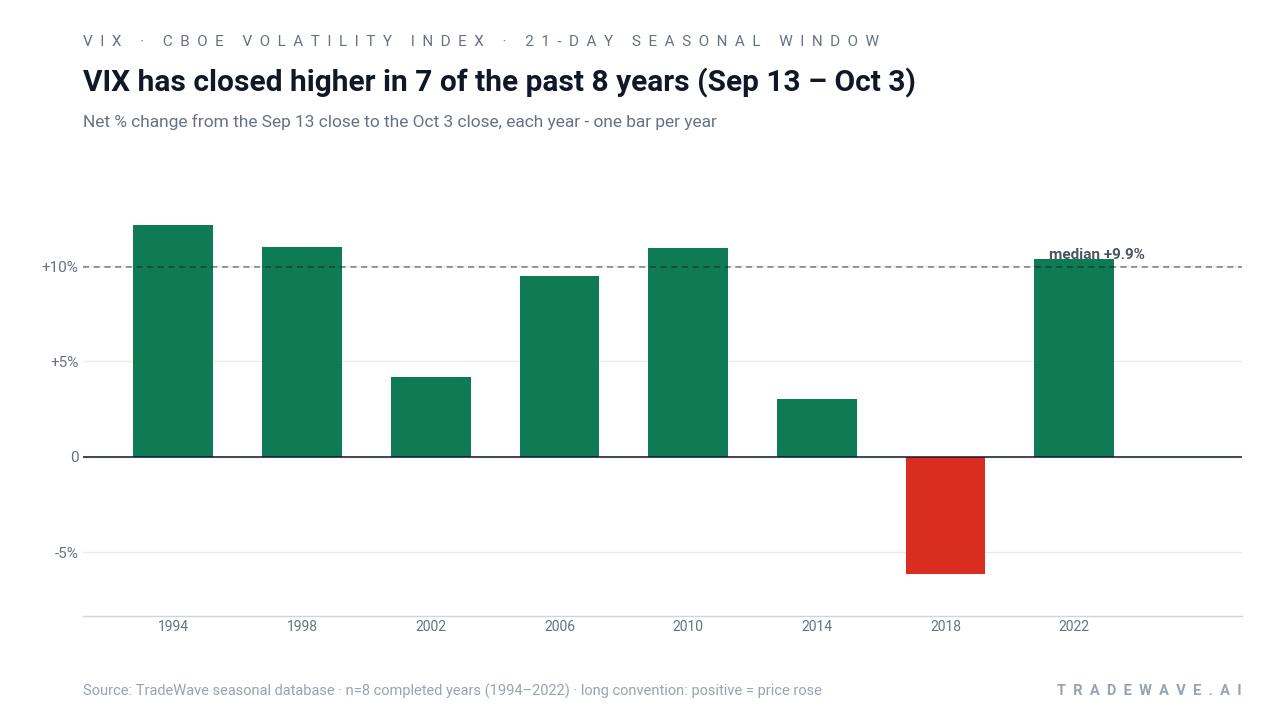
Because this pattern is grouped by presidential election cycle, it reflects how volatility has behaved specifically in the last eight midterm election years rather than in a simple run of consecutive calendar years. Midterm years often bring policy uncertainty, budget fights and shifting expectations for the following pre-election year, and that backdrop has historically lined up with a distinct VIX seasonal trend in late September and early October.
Trade direction for this setup is long, which means the historical pattern has favored higher VIX levels by the end of the 21-day window. Across the eight midterm-year samples, 7 finished higher and only 1 finished lower, giving an 88% Percent Profitable record with 7 winners and 1 loser. Average gains in the winning years came in at 8.73%, while including the lone down year still leaves Avg Profit - All at 7%, a strong result for a volatility index over just three weeks.
The per-year table shows that the strongest net gain came in 1994, when VIX rose 12.13% from entry to exit, while 2018 was the only losing year with a 6.14% decline over the window. In several cycles, such as 2014 and 2022, the maximum favorable move inside the window was far larger than the final close-to-close gain, underscoring how intraperiod spikes can fade before the window ends. That behavior matters for traders who care about path and not just the final print.
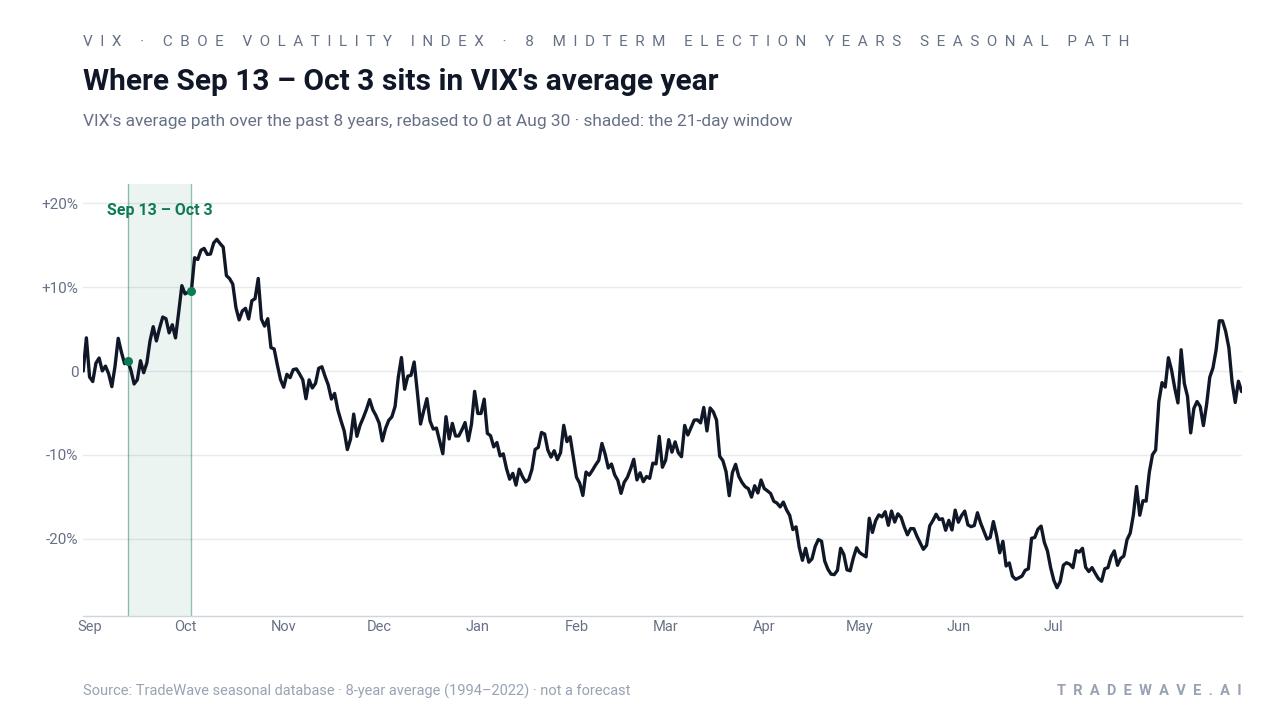
The historical seasonal average chart shows VIX typically grinding sideways into late August before tilting higher through the highlighted Sep 13–Oct 3 stretch. The slope of the average path steepens inside the window, which suggests that when volatility does pick up in midterm years, it often does so in a relatively concentrated burst rather than a slow drift.
A second view of the same window shows how far VIX has tended to swing inside each year, not just where it finished.
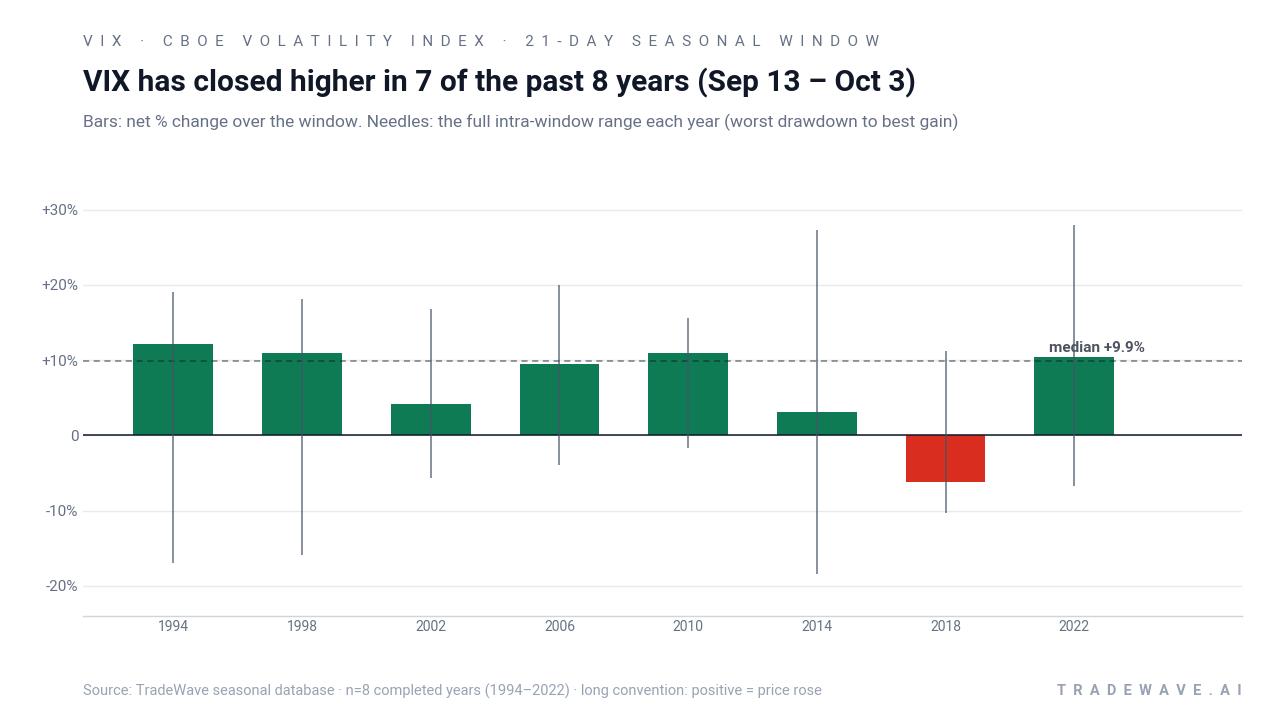
The combined net / maximum favorable / maximum adverse excursion view shows that even in winning years, VIX has often suffered double-digit drawdowns from entry before spiking higher. In 1994 and 1998, for example, the worst intraperiod drops were roughly in the mid-teens in percentage terms, while the best spikes reached into the high teens or above 20%. That mix of large MFE and sizable MAE is consistent with a high-variance window where volatility can whipsaw before settling higher by the close.
History does not guarantee future results; adverse excursions (MAE) can be large even in winning windows.
Why does CBOE Volatility Index (VIX) follow this seasonal pattern?
One likely driver is the clustering of macro and policy catalysts in late September and early October of midterm election years, from budget deadlines to shifting expectations around control of Congress. Analysts have also pointed to institutional portfolio rebalancing and options positioning around quarter-end, which can amplify demand for equity hedges when markets are stretched. For a volatility benchmark like VIX, that combination of political risk and options activity has historically translated into a tendency for implied volatility to lift during this specific fall window.
What is driving CBOE Volatility Index (VIX) today?
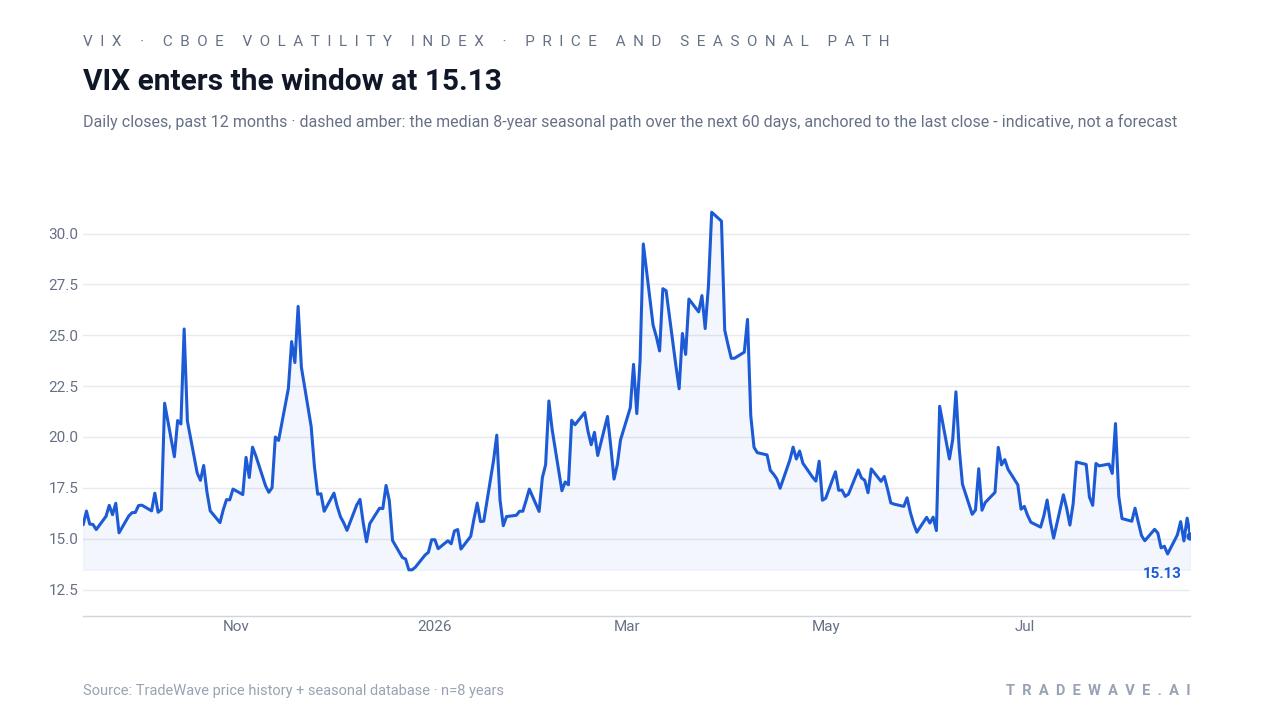
The prior session’s close left CBOE Volatility Index at 15.13, down 0.88 points or 5.5% on the day, after trading between 15.08 and 15.88. That level sits about 57.1% below the 52-week high of 35.30 and roughly 13.1% above the 52-week low of 13.38, keeping VIX near the bottom of a 2026 range that has run from 14.18 to 35.30 so far.[2] In mid-August, VIX briefly touched 14.2, its lowest print of the year, as major equity indices pushed to fresh highs and traders leaned into the idea of a calm summer tape.[1]
Strategists have flagged that combination of low implied volatility and record equity levels as a classic sign of market complacency heading into a historically choppy late-summer and early-fall stretch, especially in a midterm election year.[1] The 2026 VIX range has also been narrower than in 2024 and 2025, which suggests that realized volatility has been compressed even as macro risks around inflation, rates and policy remain unresolved.[2] For equity investors, that matters because VIX tends to spike when stocks finally react to those risks, and the upcoming Sep 13–Oct 3 seasonal window has often been the point where that shift begins.
The chart below situates the latest move in its recent multi-month context and overlays the median seasonal path into the fall.
What should traders watch as the Sep 13–Oct 3 VIX window approaches?
First, the calendar: the 21-day window begins on Sep 13, landing squarely in the heart of the mid-August to mid-October span that many volatility analysts already flag as seasonally risky.[2] If VIX remains pinned near the low teens into that start date while equities hold record territory, the setup would closely resemble prior cycles where volatility spikes emerged from a backdrop of apparent calm.[1]
Second, levels: on the downside, the 13–14 band has marked the floor of the 2026 range so far, while on the upside, the 20–25 zone has been a common first stop in past midterm-year spikes. Behavior inside the window that sees VIX grind higher toward that band without a major equity sell-off would be consistent with the historical pattern of implied volatility repricing before realized volatility fully catches up. A failure to lift at all, by contrast, would mark a clear break from the last eight midterm election years.
Third, macro and policy catalysts: budget negotiations, central bank meetings and any shift in expectations around control of Congress can all change the demand for equity hedges in a hurry. If those events line up with a pickup in options activity and a widening of intraday ranges in major indices, it would fit the historical script of this window as a transition from compressed to more turbulent markets.[1]
Finally, path: traders should monitor not just where VIX finishes the window but how it gets there. Past cycles show that even winning years often included sharp drawdowns from entry before the index spiked, so a brief dip toward or even below the 2026 lows would not, by itself, contradict the seasonal tendency. What would challenge the pattern is a sustained failure to build any upside momentum through late September and early October, especially if macro and policy risks remain in focus.
Sources
About this seasonal analysis
Seasonal pattern data is sourced from TradeWave.ai, which analyzes historical price behavior across annual calendar windows going back up to 30 years. Read the full data methodology or the book The 100-Year Pattern by Afshin Moshrefi (2026 edition). Past performance of seasonal patterns does not guarantee future results. This article is for informational purposes only and does not constitute investment advice.