Nasdaq 100 (NDX) Has Rallied in 9 Straight Midterm 300-Day Windows, Averaging 33.25% Gains
Nasdaq 100 is trading just under its 52-week high as it approaches a 300-day midterm-year seasonal window that has never been negative in the historical sample, raising the stakes for tech-heavy risk sentiment.
Price as of Sep 8, 2026: $29,507.70 (last close).

What is the seasonal pattern for Nasdaq 100 (NDX)?
Nasdaq 100 has risen in 9 of 9 midterm-year windows running from Sep 25 for 300 days, with an average gain of 33.25% in winning years.
- 9 for 9 in this window, with Nasdaq 100 averaging 33.25% gains in winning years across the sample.
- Seasonal window runs from Sep 25 for 300 days, covering the end of the midterm election year into most of the following pre-election year.
- Percent Profitable is 100%, with 9 winners and 0 losers in the historical midterm-year sample.
- Median profit of 37.07% shows that more than half of the cycles delivered gains above that already-strong average.
- Intraperiod swings have been wide, with individual years showing double-digit drawdowns even as they finished positive.
- Trade Direction is long, with a TradeWave Ratio of 1.52 and a Sharpe ratio of 1.54, pointing to historically strong risk-adjusted returns in this specific window.
According to historical data from TradeWave.ai, this upcoming stretch for the Nasdaq 100 behaves very differently from an average year. The next section steps away from headlines and looks at how this midterm-to-pre-election window has actually traded across prior cycles.
How has Nasdaq 100 (NDX) traded in the late midterm-year seasonal window?
Nasdaq 100 has closed higher in every one of the last 9 midterm election years during the 300-day window that starts on Sep 25, averaging gains of 33.25%. The index ended the prior session at 29,507.70, about 4.1% below its 52-week high of 30,762.20 and well above its 52-week low of 22,841.42.
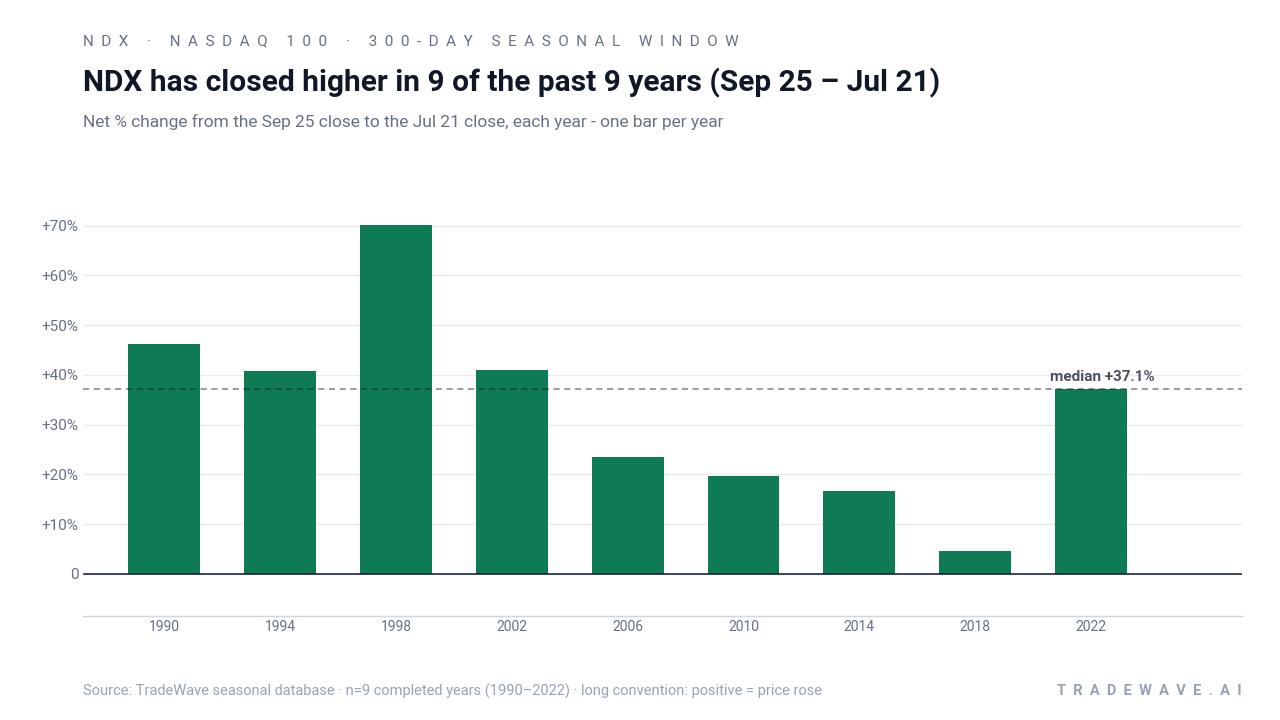
Grouping the data by the presidential election cycle matters here because midterm years often split into two very different playbooks. Early in the year, volatility and policy uncertainty tend to dominate, while the late-year stretch into the following pre-election year has historically lined up with clearer fiscal and regulatory visibility and a more supportive liquidity backdrop for growth stocks.
Across the nine midterm-year samples, the trade direction is firmly long. Percent Profitable is 100%, with 9 winners and 0 losers, and the median profit of 37.07% sits slightly above the already-strong average of 33.25%. That mix suggests the pattern is not just skewed by one outlier year but has delivered sizable gains in most iterations.
The strongest year in the sample was 1998, when the window produced a 70.03% net gain, with a best intraperiod run-up of 77.57% and a worst drawdown of 23.51% from the entry. The softest outcome was 2018, which still finished up 4.52% but saw the index fall as much as 22.06% below the entry level at one point before recovering into the close of the window. That combination of large maximum favorable moves and sometimes deep maximum adverse moves underlines how volatile this Nasdaq 100 trading window can be even when the final result is positive.
A second view stacks each year’s net result with its best and worst intraperiod swings to show how far NDX has tended to travel inside the window.
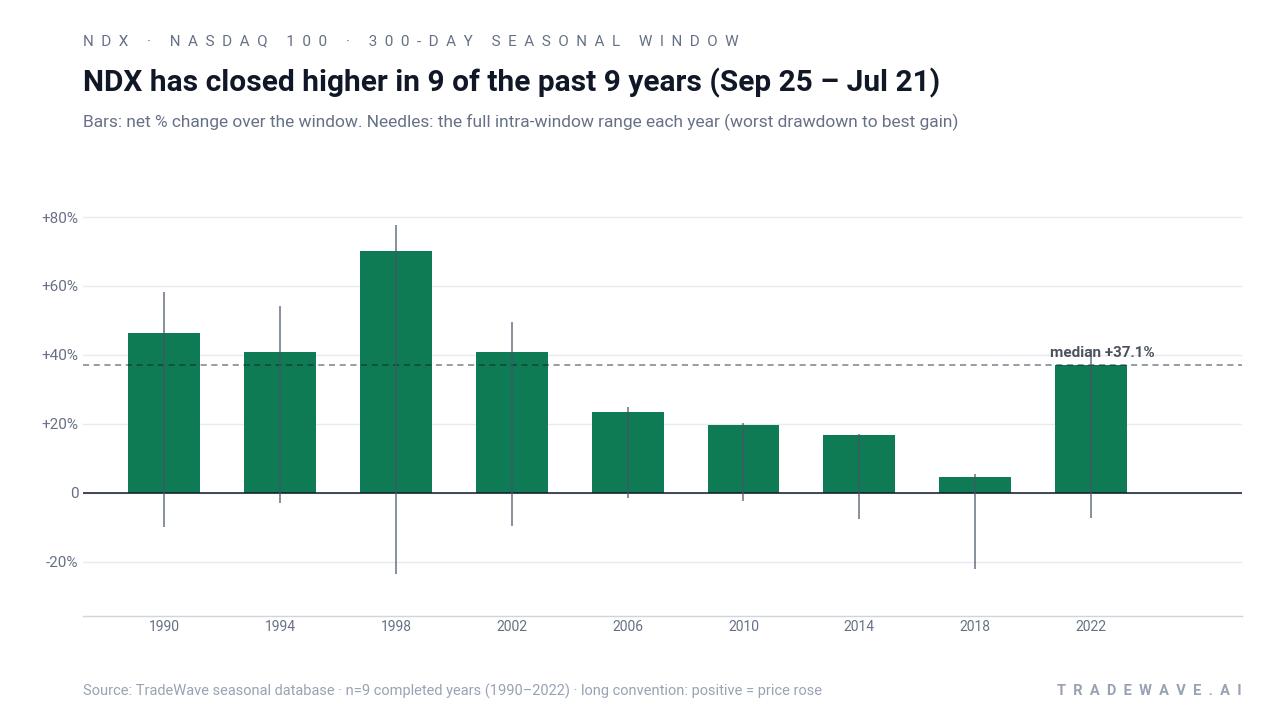
The bars-and-needles profile shows that in most years the maximum favorable move has been significantly larger than the final net gain, which is consistent with a TradeWave Ratio of 1.52 indicating that price typically travels far in the trade direction within the window. At the same time, the maximum adverse excursions have often reached mid-teens to low-20s drawdowns, underscoring that even a historically strong Nasdaq 100 seasonal trend can involve sharp pullbacks before the window closes.
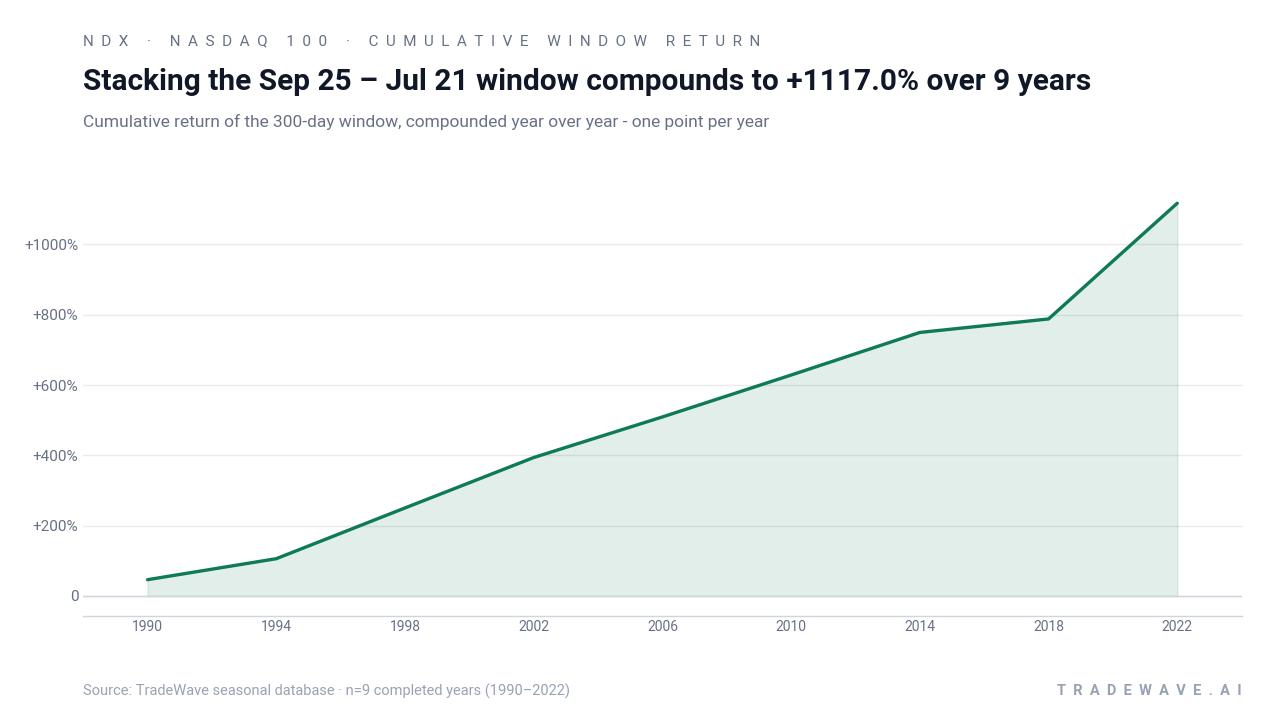
Stack the windows together and the cumulative return reaches 1,116% across the nine midterm-year samples, with an annualized return of 32.0% and a Sharpe ratio of 1.54. The pattern is clear: this long midterm-to-pre-election stretch has historically favored long exposure to the Nasdaq 100, with every sample year finishing in the green despite sometimes heavy turbulence along the way.
History does not guarantee future results; adverse excursions can be large even in winning windows, and past seasonal strength does not ensure similar outcomes in future cycles.
Why does Nasdaq 100 (NDX) follow this seasonal pattern?
One likely driver is the way the earnings calendar and policy cycle line up around midterm elections, with many mega-cap tech and growth companies issuing guidance as political uncertainty begins to clear. Analysts have also pointed to institutional portfolio rebalancing and sector rotation into growth as the pre-election year approaches, which can funnel flows into Nasdaq 100 constituents. The pattern may also reflect a combination of improving visibility on regulation and a tendency for investors to re-risk into technology and growth once the midterm vote is behind them.
What is driving Nasdaq 100 (NDX) today?
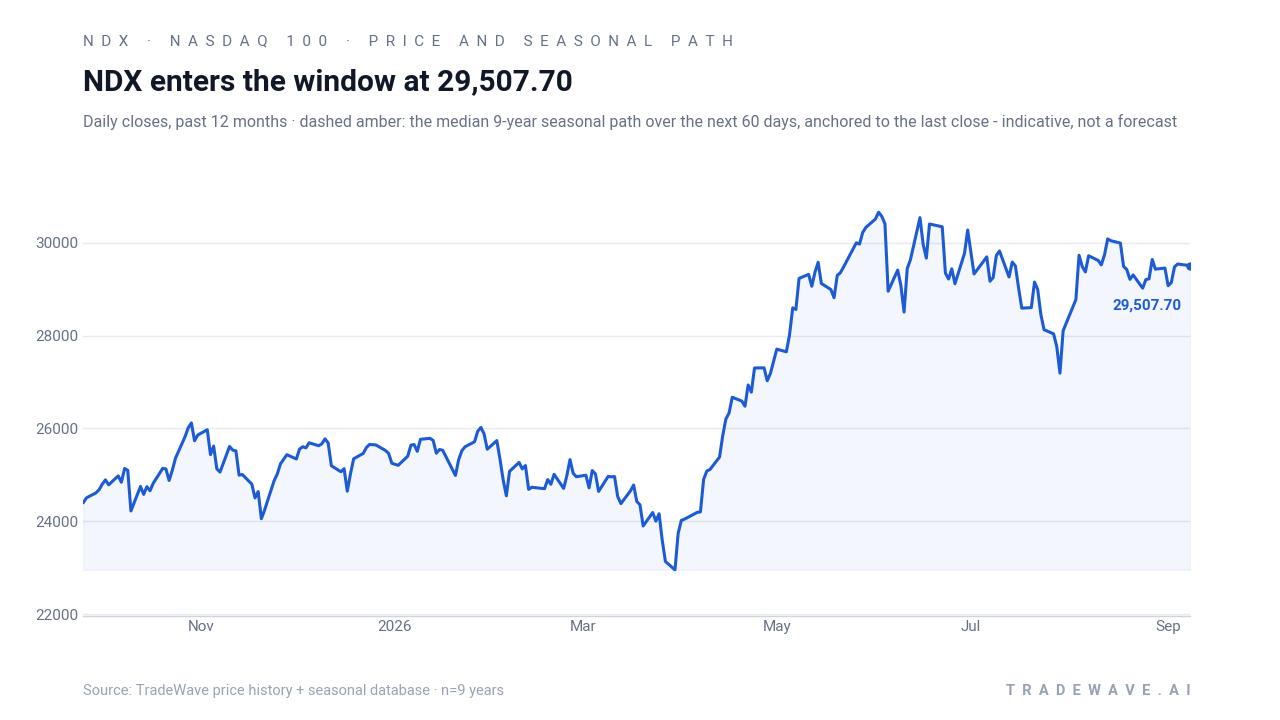
Nasdaq 100 slipped 0.12% in the prior session to 29,507.70, a modest move that leaves the index about 4.1% below its 52-week high and well above its 52-week low, after a flat month that has seen a 0.39% decline. The index continues to act as a barometer for large-cap technology and growth exposure, with sector concentration remaining a key driver of day-to-day swings as investors weigh valuations against earnings power and rate expectations.[2]
In Feb 2026, Nasdaq proposed a “fast entry” rule to speed the inclusion of large new listings into its flagship benchmarks, a change that could affect how quickly mega-cap IPOs or direct listings find their way into the Nasdaq 100 and influence index-level flows.[2] Earlier in Jun 2026, the exchange also announced its quarterly rebalance for the Nasdaq-100, adjusting constituents and sector weights in a way that can subtly shift the index’s sensitivity to themes like cloud computing, artificial intelligence, and consumer internet spending.[1]
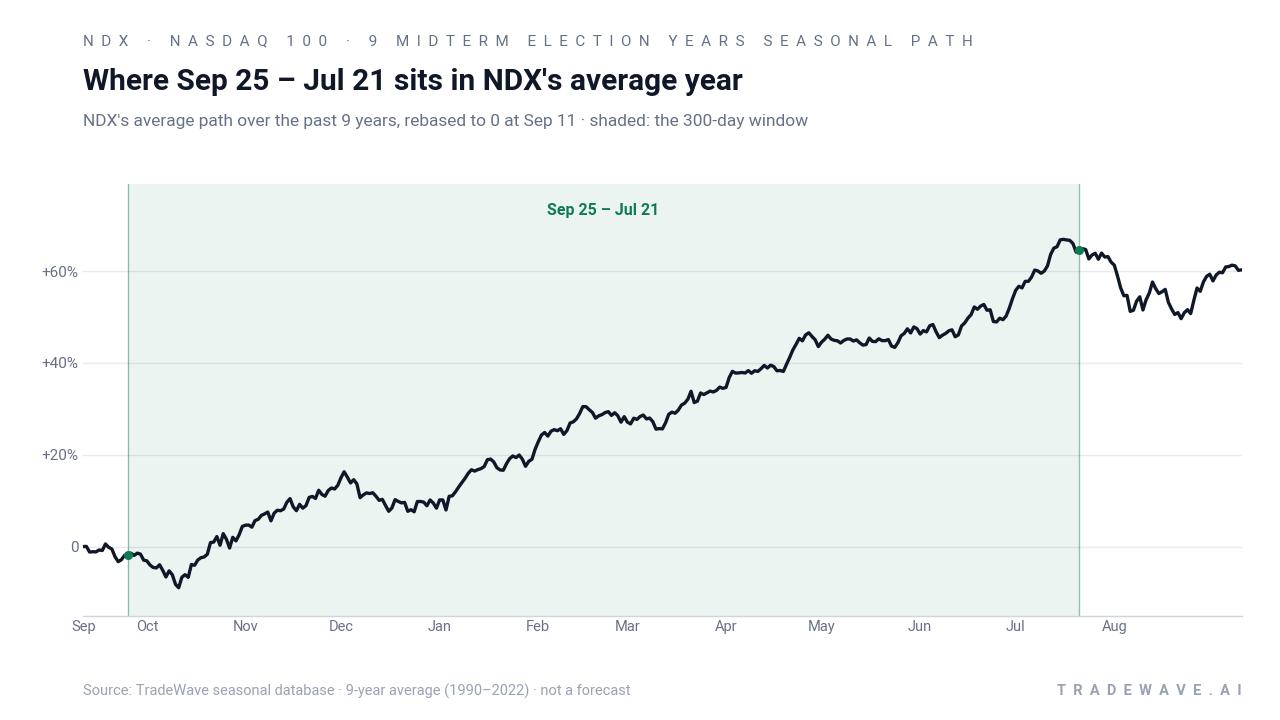
The chart below places the latest pullback in the context of the past year and overlays the median historical seasonal path for the next two months.
What should traders watch as this Nasdaq 100 seasonal window approaches?
With the index sitting close to its 52-week high and the 300-day window set to open on Sep 25, the first thing to watch is whether NDX respects or breaks through the 30,762.20 high as the calendar flips into the historical sweet spot. A sustained move above that level early in the window would be consistent with prior cycles that saw strong maximum favorable moves, while a sharp pullback toward the mid-20,000s would echo years like 2018 that experienced deep drawdowns before recovering.
Policy and macro headlines will matter as well. The late stages of the midterm election year often bring more clarity on fiscal priorities and regulatory direction for large-cap tech and growth companies, which can either reinforce or challenge the historical pattern depending on how investors interpret the policy calendar.[2] Traders will be watching how index-level flows respond to any new listings or constituent changes, especially if the “fast entry” framework accelerates the inclusion of fresh mega-caps into the Nasdaq 100 universe.[1][2]
Finally, behavior inside the window will be the real test of this historical seasonality. If NDX continues to show strong upside bursts with contained follow-through drawdowns, it would line up with the long-biased pattern seen across the last nine midterm-year cycles. A choppier tape with repeated failures near the highs or unusually shallow maximum favorable moves would signal that this iteration of the window is diverging from the historical script, reminding traders that even a 9-for-9 record is a tendency, not a guarantee.
Sources
About this seasonal analysis
Seasonal pattern data is sourced from TradeWave.ai, which analyzes historical price behavior across annual calendar windows going back up to 30 years. Read the full data methodology or the book The 100-Year Pattern by Afshin Moshrefi (2026 edition). Past performance of seasonal patterns does not guarantee future results. This article is for informational purposes only and does not constitute investment advice.