10-for-10 Midterm Run: S&P 500 (SPX) Has Averaged 19.27% Gains From Sep 23 to Jul 12
S&P 500 is nearing a historically powerful midterm-to-pre-election seasonal window, just as strong earnings and a friendlier Fed backdrop keep the index in focus.

What is the seasonal pattern for S&P 500 (SPX)?
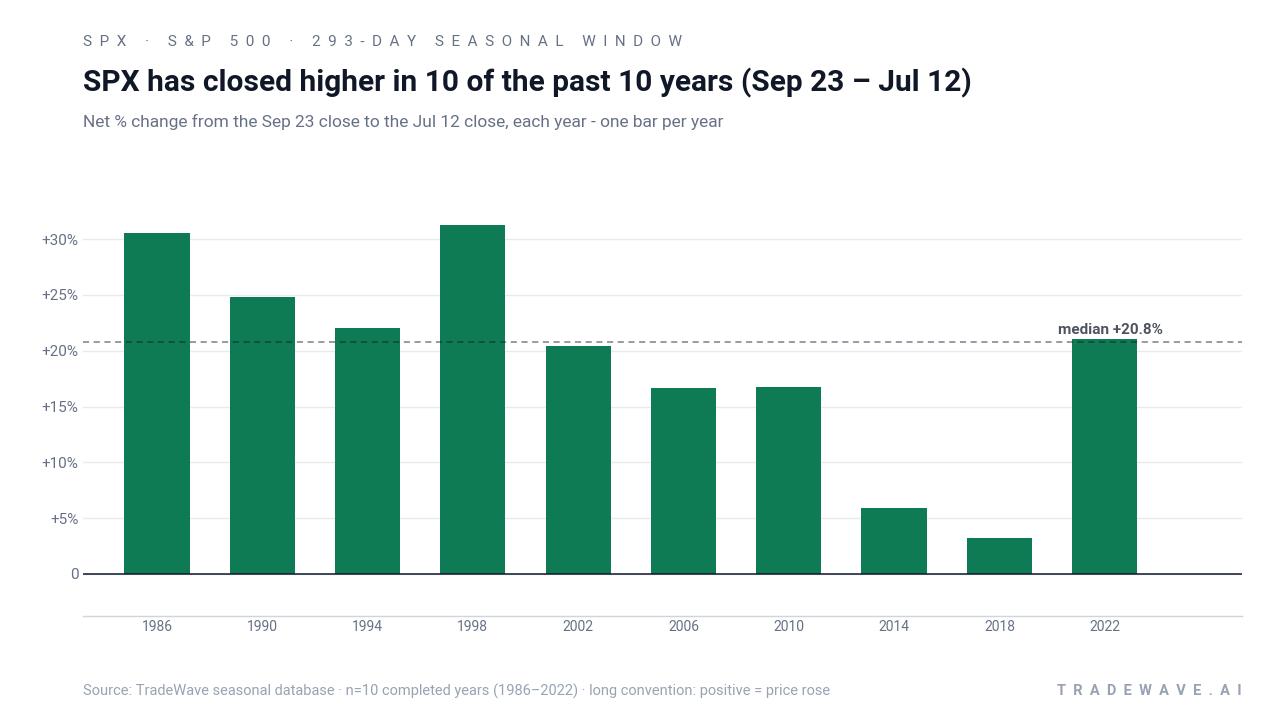
S&P 500 has risen in 10 of 10 midterm-year windows starting around Sep 23, with an average gain of 19.27% in winning years.
- 10 for 10 in this window, with S&P 500 averaging 19.27% gains across all winning years.
- Seasonal window runs roughly Sep 23 through Jul 12, spanning 293 days across the last 10 midterm election years.
- Percent Profitable is 100%, with 10 winners and 0 losers in the historical sample.
- Average winner gains of 19.27% stack to a 466% cumulative return when the window is repeated across cycles.
- TradeWave Ratio of 1.85 signals that price has typically traveled meaningfully in the long direction within the window.
- Sharpe ratio of 1.75 points to a strong risk-adjusted profile for this long seasonal regime.
According to historical data from TradeWave.ai, this late-September stretch has behaved very differently from an average year for the S&P 500. The next section walks through what that midterm-to-pre-election pattern has looked like in past cycles.
How has S&P 500 (SPX) traded in the Sep 23 to Jul 12 midterm window?
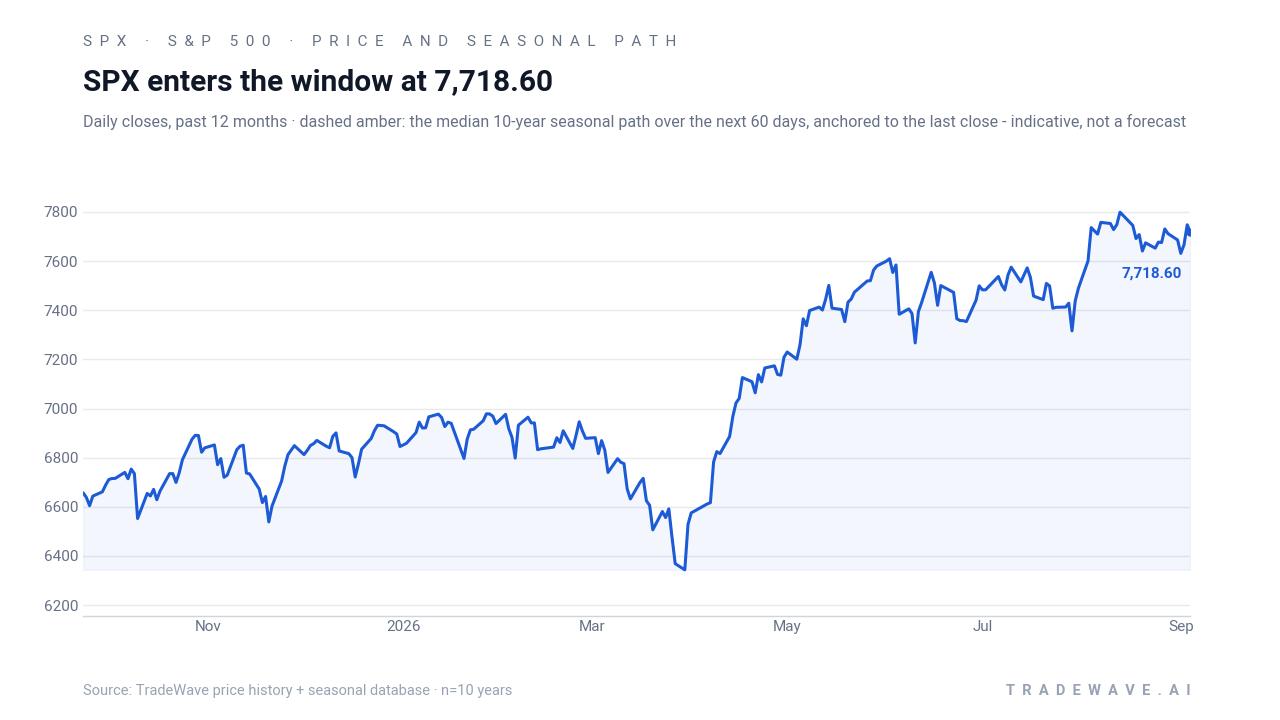
S&P 500 has not logged a single losing midterm-year window in the 293 days starting around Sep 23 across the last 10 cycles, averaging 19.27% gains for long exposure. Today the index is trading near 7,718, leaving it about 1.3% below its 52-week high of 7,816.70 and roughly 22.2% above its 52-week low of 6,316.91. That combination of a strong uptrend and a historically powerful seasonal regime is why this particular slice of the calendar matters for portfolio construction.
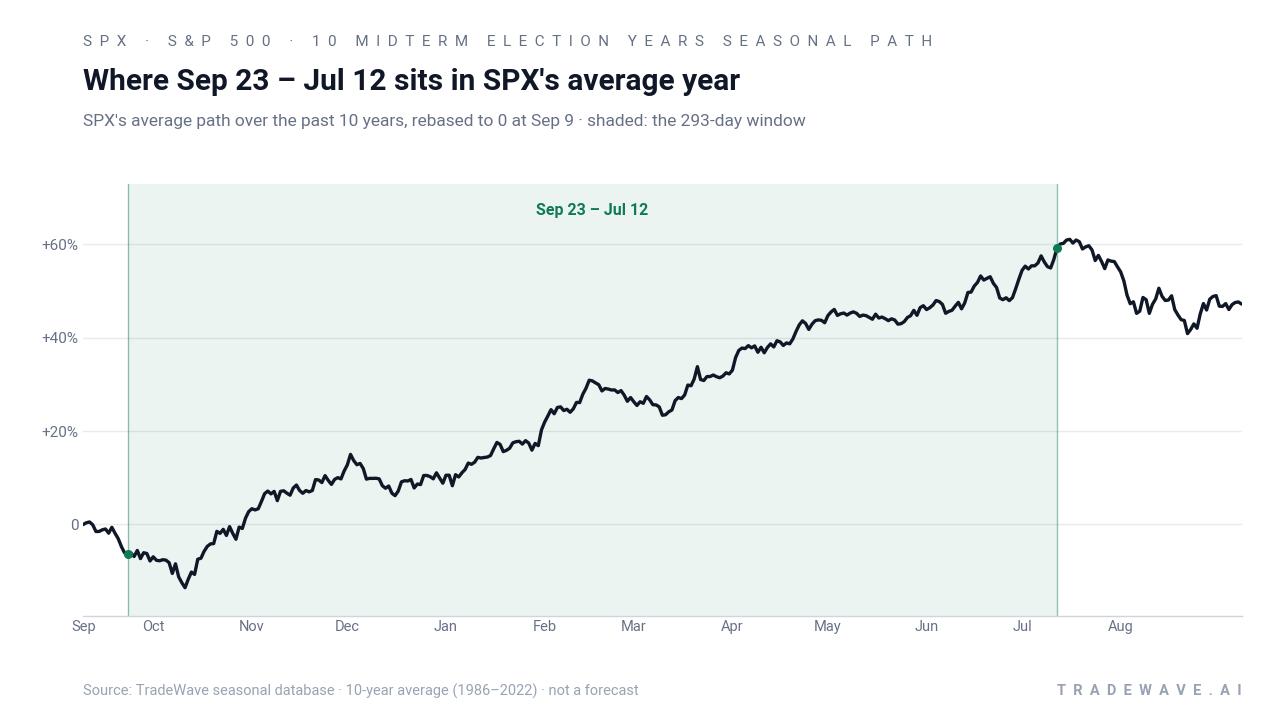
The presidential election cycle matters here because this window sits at the handoff from the midterm election year into the year before the presidential election, a phase that has often coincided with easier policy and stronger risk appetite. Pattern phase is the midterm election year, calendar phase is also the midterm election year in its late part, and the window then runs deep into the pre-election year when fiscal and regulatory stances have historically been more market-friendly.
Across the 10 midterm election years in this sample, the trade direction is long and every instance finished positive. Average profit of 19.27% lines up with a median outcome of 20.75%, which tells you the distribution has been tight around strong double-digit gains rather than skewed by a single outlier year. The weakest year in the set was 2018, which still delivered a 3.23% net gain from late September to mid-July, while the strongest was 1998 at 31.24%.
Intraperiod swings have been manageable relative to the upside. In 1998, for example, S&P 500 rallied as much as 31.96% from the entry level at one point in the window, with a worst drawdown of 13.39% from that same starting point. In 2014, the index saw a maximum favorable move of 7.66% but also lived through an 8.18% adverse excursion before finishing higher, a reminder that even “all green” windows can feel uncomfortable in real time.
The long-run profile of this midterm-to-pre-election window is what some practitioners refer to as the 100-Year Pattern: a roughly 295-day stretch beginning in late September of the midterm year and ending in mid-July of the pre-election year that has historically delivered unusually smooth upside for the S&P 500. In this dataset, stacking those 10 windows compounds to a 466% cumulative gain, which is a striking result even by bull-market standards.
Yearly net and peak moves highlight upside persistence amid typical drawdowns.
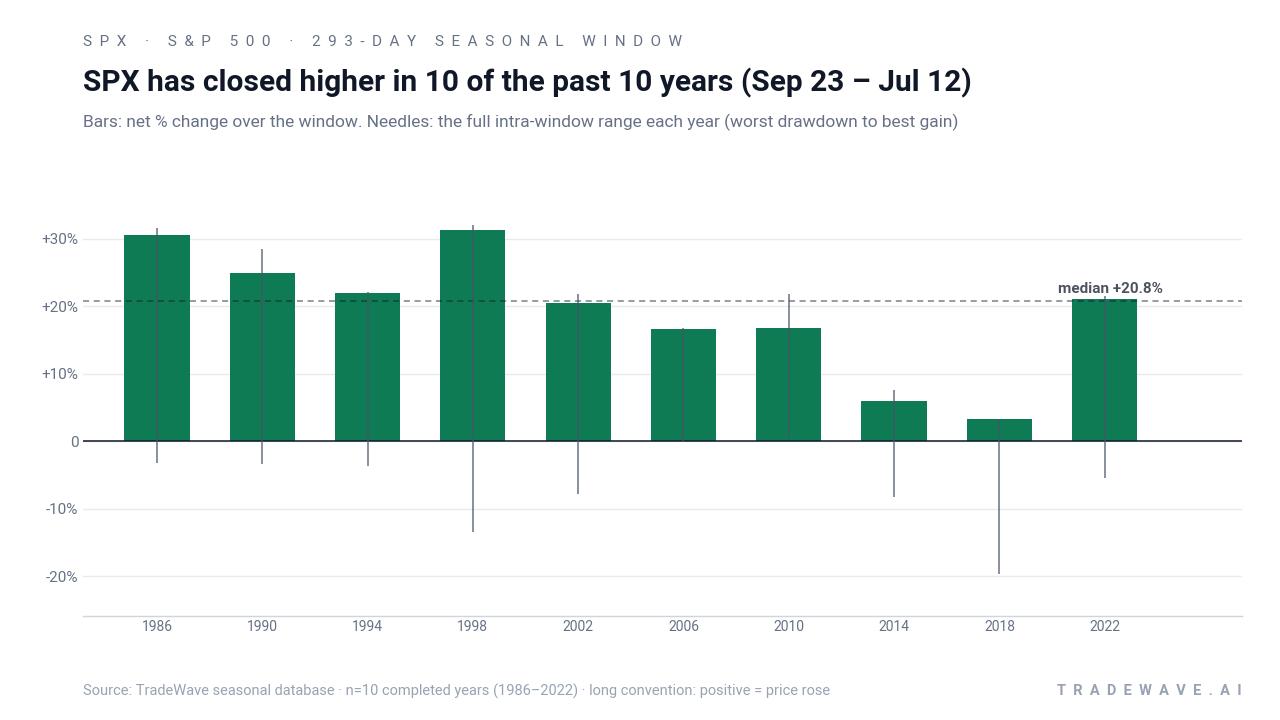
The stacked net, maximum favorable move and maximum adverse move bars show a consistent pattern: in most years, the best run-up within the window has been only a few percentage points above the final gain, and the worst drawdown has been materially smaller than the upside. That combination aligns with the 1.85 TradeWave Ratio and 1.75 Sharpe ratio, suggesting a regime where the index has tended to trend rather than whip around.
History does not guarantee future results; adverse excursions can still be large even in winning windows, and investors should treat this pattern as context rather than a forecast.
Why does S&P 500 (SPX) follow this seasonal pattern?
One likely driver is the way the policy and earnings calendar lines up around the midterm and pre-election years. Analysts often point to a mix of post-midterm political clarity, fiscal support and central banks that are reluctant to tighten aggressively heading into a presidential race, all of which can support risk assets. This pattern may also reflect institutional portfolio rebalancing and sector rotation as managers lean into growth and cyclicals once early-midterm volatility has passed.
What is driving S&P 500 (SPX) today?
Into early September, S&P 500 is hovering just below record territory after a powerful run that has been fueled by strong headline earnings and a softer path for interest rates. Recent coverage notes that aggregate S&P 500 earnings growth in the second quarter looked robust, although a meaningful slice of that strength came from non-recurring and non-operating items that can flatter reported numbers relative to underlying operating trends.[1] At the same time, markets have been buoyed by reduced odds of additional Federal Reserve rate hikes, a shift that has supported higher valuations for growth-heavy sectors that dominate the index.[2]
The chart below situates the latest move in its recent multi-month context, alongside a median 60-day seasonal path.
Macro commentary around the index has focused on the interplay between earnings breadth and policy. In early September, market strategists highlighted that reduced chances of further Fed tightening, combined with solid second-quarter earnings beats, have been a key tailwind for equities and the S&P 500 in particular.[2] Technology and AI-linked names remain central to that story, with AI infrastructure and software earnings cited as major contributors to index-level earnings-per-share growth in the latest quarter.[1] That concentration risk cuts both ways: it has powered the rally into this seasonal window, but it also means any wobble in AI or mega-cap tech could matter more than usual as the calendar flips into the historically important Sep 23 to Jul 12 stretch.
Looking ahead, the policy calendar will be critical. The market is entering the concluding months of the midterm election year, when Washington’s focus often shifts from passing contentious legislation to setting the stage for the presidential campaign. Historically, that has coincided with a more supportive liquidity backdrop and a bias toward avoiding major negative economic surprises, which lines up with the strong midterm-to-pre-election seasonal pattern in the S&P 500. Whether that playbook repeats will depend on how inflation, growth data and Fed communication evolve into the fourth quarter.
What should traders watch as this S&P 500 seasonal window approaches?
First, watch how the index behaves into the Sep 23 start date. In prior cycles, the strongest years often saw S&P 500 consolidate or drift modestly before the window, then build a steadier uptrend as the midterm election passed and the pre-election year began. A sharp break lower ahead of the window would not invalidate the pattern, but it would raise the odds of a choppier path even if the final outcome remained positive.
Second, keep an eye on the macro tape. The historical pattern has played out against a backdrop of stable or easing policy in many cycles, so incoming inflation prints, labor-market data and Fed commentary will matter for whether investors feel comfortable leaning into risk. If reduced rate-hike odds persist and earnings revisions stay positive, that would rhyme with prior strong midterm-to-pre-election windows.[2]
Third, monitor leadership inside the index. The recent rally has been heavily concentrated in technology and AI-related stocks, which have driven a disproportionate share of S&P 500 earnings-per-share growth.[1] If that leadership broadens into financials, industrials and consumer cyclicals as the window opens, it would echo the healthier breadth seen in some of the best historical runs. If instead the rally remains narrow or reverses in mega-cap tech, the seasonal tailwind could be offset by stock-specific headwinds.
Finally, track intraperiod volatility once the window is underway. Past cycles show that even in winning years, the index has often experienced single-digit to low-teens drawdowns before finishing higher. Traders watching this 293-day S&P 500 trading window may want to focus less on day-to-day noise and more on whether pullbacks stay within the historical adverse-excursion range or start to break beyond it. A pattern of shallow, bought dips would be consistent with the long-run seasonal trend, while deeper, persistent selling would signal that this cycle is diverging from the historical script.
Sources
About this seasonal analysis
Seasonal pattern data is sourced from TradeWave.ai, which analyzes historical price behavior across annual calendar windows going back up to 30 years. Read the full data methodology or the book The 100-Year Pattern by Afshin Moshrefi (2026 edition). Past performance of seasonal patterns does not guarantee future results. This article is for informational purposes only and does not constitute investment advice.