S&P 500 SPDR (SPY) Has Rallied in 7 Straight 303-Day Midterm Windows, Averaging 17.81%
S&P 500 SPDR is hovering just below its 52-week high as it approaches a 303-day midterm-to-pre-election seasonal window that has never produced a loss in the past seven cycles.

What is the seasonal pattern for S&P 500 SPDR (SPY)?
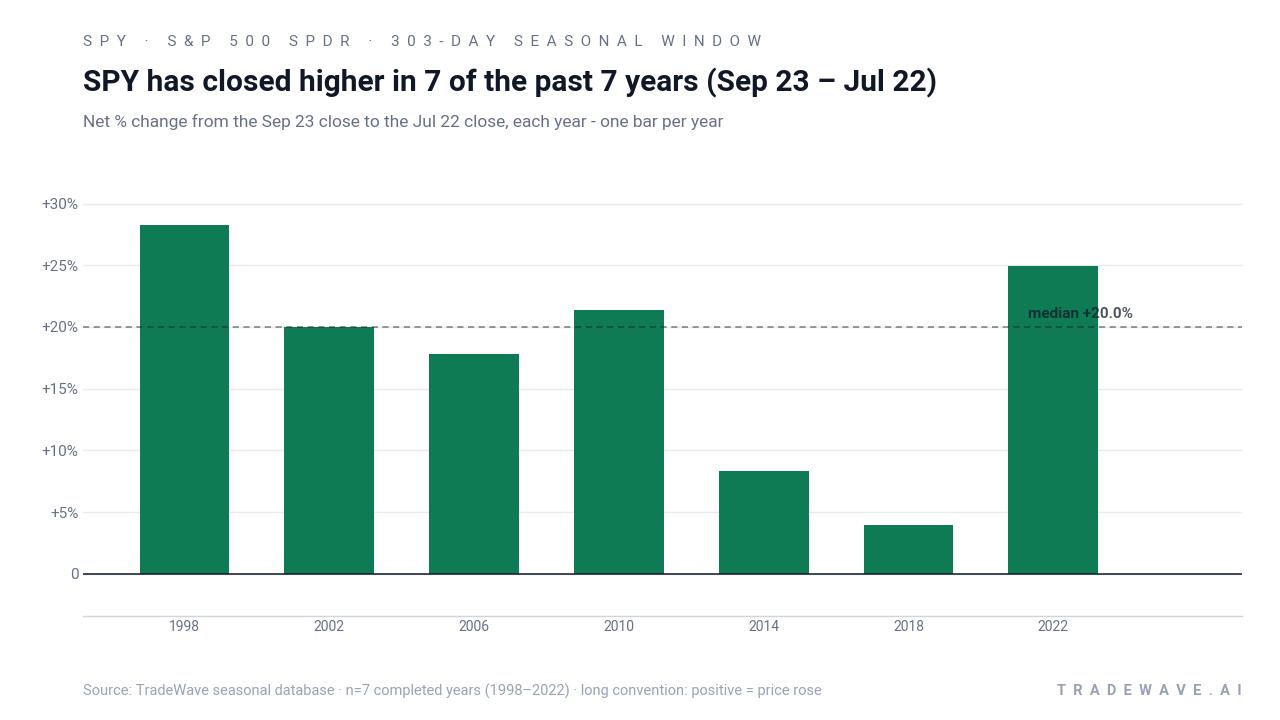
S&P 500 SPDR has risen in 7 of 7 midterm-to-pre-election windows starting around Sep 23, with an average gain of 17.81% in winning years.
- 7 for 7 in this 303-day window, with average winning-year gains of 17.81% and a 209% cumulative return across the sample.
- Percent Profitable is 100%, with 7 winners and 0 losers across the last seven midterm election years that match this pattern.
- The window runs from Sep 23 through Jul 22, bridging the end of the midterm election year into the heart of the pre-election year.
- Median profit of 20.03% shows that typical outcomes have been solidly double-digit, not just skewed by one outlier year.
- The TradeWave Ratio of 1.67 indicates that price has typically traveled meaningfully in the long direction within the window, while the Sharpe ratio of 1.66 points to strong risk-adjusted returns.
- Intraperiod swings have still been real, with past years showing notable drawdowns even when the final result was positive.
According to historical data from TradeWave.ai, this long midterm-to-pre-election stretch has behaved very differently from an average year for SPY. The next section walks through what that pattern has looked like and how it lines up with today’s backdrop.
How has S&P 500 SPDR (SPY) traded in the midterm-to-pre-election window?
S&P 500 SPDR has finished higher in every single 303-day window starting around Sep 23 of the last seven midterm election years, averaging gains of 17.81%. The ETF last closed at 765.96, about 1.7% below its 52-week high of 779.37, leaving it near the top of its one-year range as this historically powerful regime approaches.
The presidential election cycle matters here because this window always begins in the concluding midterm election year and runs deep into the following pre-election year, a phase that has often coincided with friendlier policy tone and stronger risk appetite for equities. Grouping only those years together strips out noise from other parts of the four-year cycle and isolates how SPY has behaved when Washington is past the midterm vote and markets start to price the next presidential race.
This specific seasonal window begins on Sep 23 and spans 303 days, ending around Jul 22 of the following year. Historically, during this period, S&P 500 SPDR has shown a strong bullish tendency for long exposure, with every sampled year closing higher than it started. Average gains of 17.81% sit close to the median outcome of 20.03%, which suggests the pattern is not just one monster year hiding a lot of noise but a cluster of solid advances.
The strongest historical run in this window came in 2022, when SPY gained 24.94% from entry to exit, with a best intraperiod run-up of 25.56% before giving back a small portion into the close. The softest outcome was 2018, which still finished up 3.92% but saw a much choppier path, including a worst drawdown of 19.21% from the entry level before recovering into the end of the window.
Across all seven cycles, the maximum favorable move within each window has typically been larger than the final net gain, which is what you would expect in a trending but volatile market. The maximum adverse move has varied from almost no downside in 2006 to double-digit drawdowns in years like 1998 and 2018, underscoring that even “all green” windows have required investors to sit through uncomfortable swings.
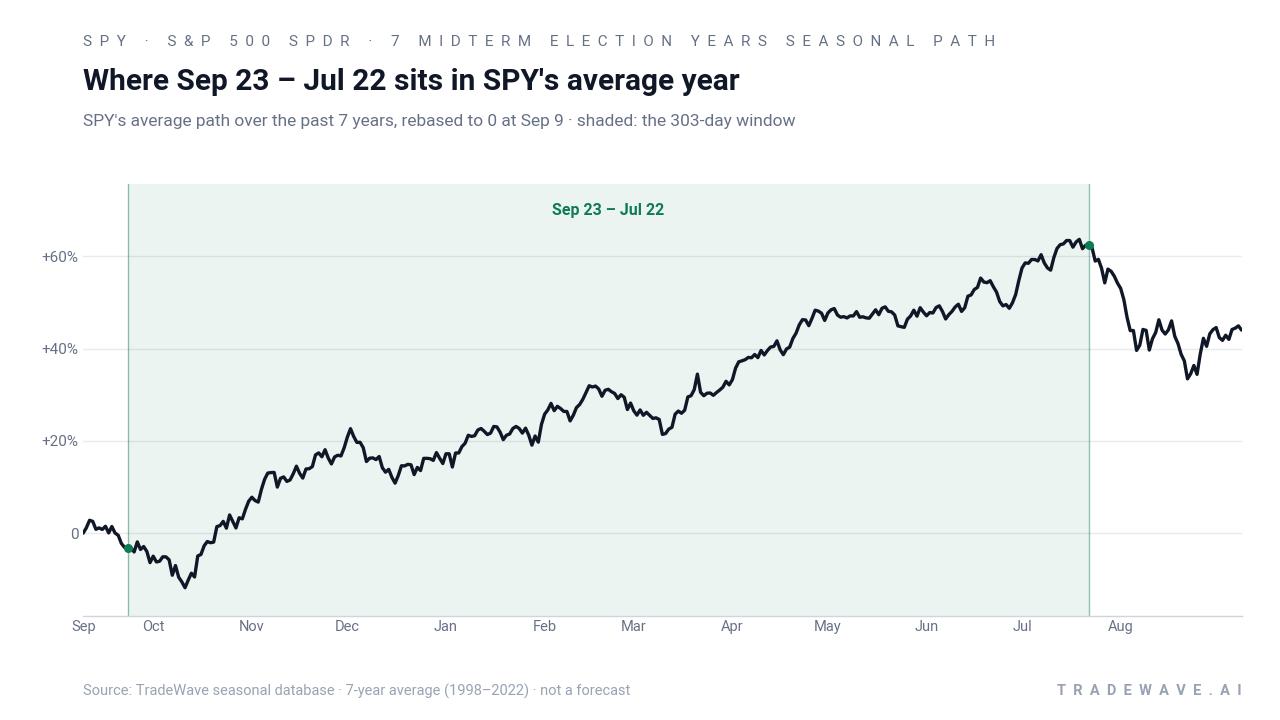
The historical seasonal average shows SPY tending to grind higher through much of this 303-day stretch, with the slope steepening as the calendar moves into the pre-election year. That profile lines up with the broader “100-Year Pattern” idea that late midterm and early pre-election periods have been some of the most forgiving stretches for U.S. equities over the last century.
Year-by-year ranges show how much room SPY has had to run inside the window, and how deep the worst pullbacks have gone before those gains locked in.
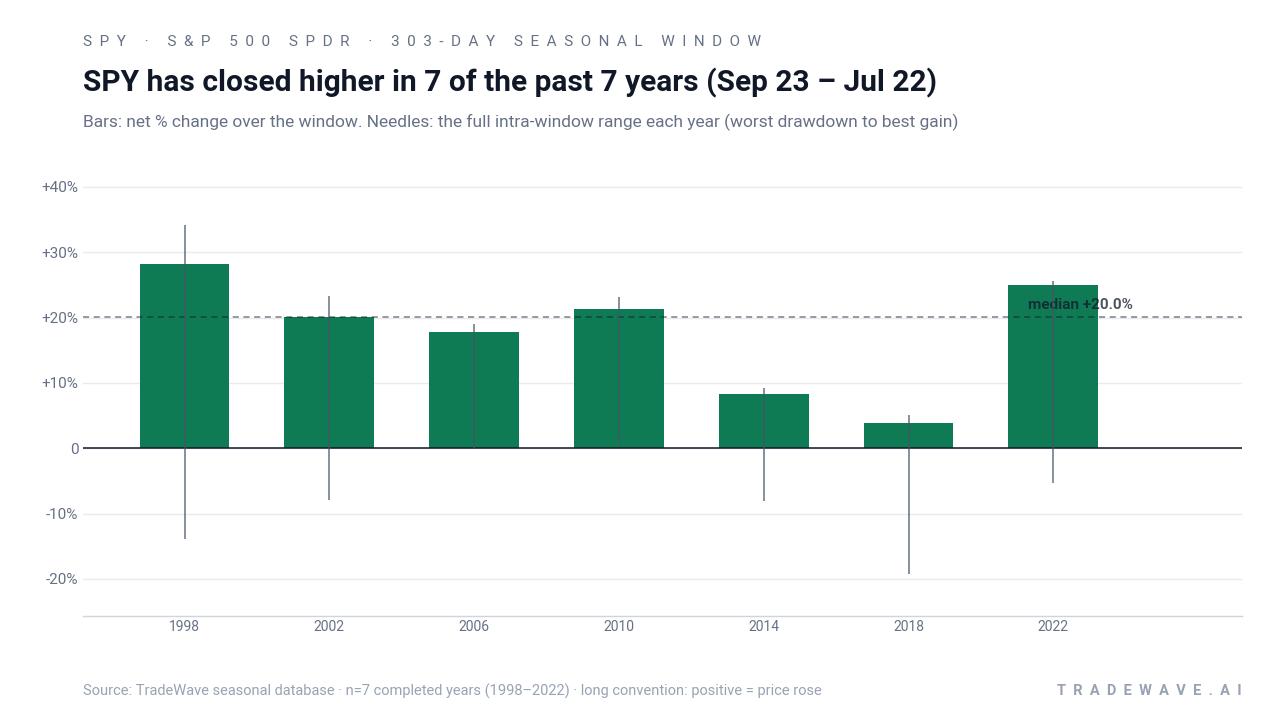
The combined net / best-case / worst-case chart makes the trade-off clear: historically, this has been a window where upside has dominated, but the path has not been smooth. Large maximum favorable excursions have often come alongside sizeable maximum adverse excursions, especially in years with macro shocks, which means the seasonal edge has rewarded patience rather than precision timing.
History does not guarantee future results; adverse excursions can be large even in winning windows, and past seasonal strength does not eliminate the risk of a different outcome this time.
Why does S&P 500 SPDR (SPY) follow this seasonal pattern?
One likely driver is the way the policy calendar and investor positioning shift after midterm elections, as Washington gridlock or clarity often reduces perceived policy risk and encourages investors back into equities. Analysts have also pointed to institutional portfolio rebalancing and sector rotation into risk assets as the pre-election year approaches, especially when earnings visibility improves. This pattern may also reflect the tendency for corporate buybacks and fiscal support to be more active in the run-up to a presidential race, which can amplify the SPY seasonal trend in this window.
What is driving S&P 500 SPDR (SPY) today?
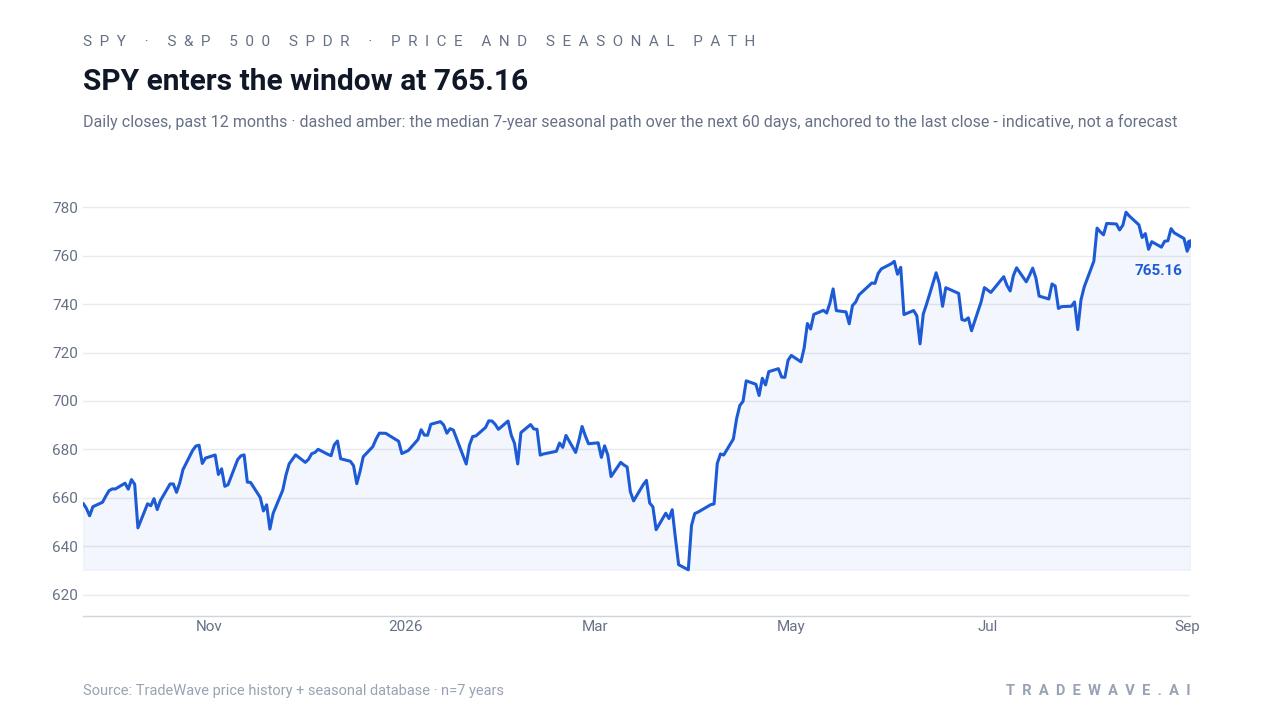
S&P 500 SPDR ended the prior session at 765.96, down 0.55% on the day, leaving it roughly 1.7% below its 52-week high of 779.37 and well above its 52-week low near 626.05. Trading volume over the past 20 sessions has averaged about 36.6 million shares, a reminder that SPY remains the primary vehicle for broad U.S. equity exposure and intraday hedging.
Under the hood, the ETF is heavily tilted toward technology, with that sector accounting for roughly 38.69% of assets and the top 10 holdings making up about 37.79% of the fund, led by Nvidia, Apple and Microsoft.[3] That concentration means single-stock moves in a handful of mega-cap names can dominate SPY’s day-to-day behavior, especially around earnings or guidance shifts.
In Mar 2026, analysis of SPY’s prior decade highlighted how much of the ETF’s long-run return profile has been driven by those same top holdings, and how rising Treasury yields have periodically pressured the high-multiple growth stocks that dominate the fund.[7] That backdrop matters as the market heads into the late stages of the midterm election year, because any renewed rate volatility or valuation reset in big tech could temporarily overwhelm even a historically strong seasonal window.
The chart below situates the latest pullback against the past year of trading and a median seasonal path for the next two months.
What should traders watch as this SPY seasonal window approaches?
First, the calendar: the 303-day window opens on Sep 23, so the next two weeks are about positioning rather than pattern execution. Traders will be watching whether SPY can hold above its 50-day moving average around 757.60 and whether any retest of the 52-week high near 779.37 comes with broad sector participation or is driven mainly by a few mega-caps.
Second, the macro and policy tape: as the midterm election year winds down, any shift in expectations for fiscal policy, regulation of large tech platforms, or the Federal Reserve’s rate path could either reinforce or blunt the historical pre-election tailwind. A backdrop of stable or easing yields has historically been friendlier for the growth-heavy SPY sector mix, while renewed rate spikes have tended to compress multiples and increase volatility.[7]
Third, behavior inside the window itself will be the real test of this SPY seasonal trend. If the ETF enters the Sep 23 – Jul 22 stretch and quickly starts to build a steady series of higher highs and higher lows, with drawdowns staying closer to the milder historical years like 2006 and 2022, that would be consistent with the past seven cycles. A deeper early drawdown closer to the 2018 pattern would not automatically break the playbook, but it would signal that traders need to respect the MAE side of the range as much as the upside history.
Finally, because SPY is the systemically important proxy for U.S. equities, any divergence between this historically bullish midterm-to-pre-election window and actual price action will be a signal in itself. A failure to participate in the usual pre-election strength would raise questions about whether concentrated leadership, macro headwinds or policy uncertainty are overpowering one of the strongest long-run seasonal regimes on the calendar.
Sources
- Yahoo Finance - State Street SPDR S&P 500 ETF Trust (SPY) Options Chain - Yahoo Finance
- Yahoo Finance - Stock Market Live November 19: S&P 500 (SPY) Running with Nvidia Earnings Ahead
- Yahoo Finance - State Street SPDR S&P 500 ETF Trust (SPY) Holdings - Yahoo Finance
- Yahoo Finance - State Street SPDR Portfolio S&P 500 Growth ETF (SPYG) Stock Price, News, Quote & History - Yahoo Finance
- The Motley Fool - How to Buy SPDR S&P 500 ETF Trust (SPY) | The Motley Fool
- The Motley Fool - If You'd Invested $1,000 in the SPDR S&P 500 ETF Trust (SPY) 10 Years Ago, Here's How Much You'd Have Today | The Motley Fool
- Yahoo Finance - SPY Has Returned 217% Over 10 Years, But Its Top 3 Holdings Now Control the Outcome
About this seasonal analysis
Seasonal pattern data is sourced from TradeWave.ai, which analyzes historical price behavior across annual calendar windows going back up to 30 years. Read the full data methodology or the book The 100-Year Pattern by Afshin Moshrefi (2026 edition). Past performance of seasonal patterns does not guarantee future results. This article is for informational purposes only and does not constitute investment advice.