CBOE Volatility Index (VIX) Nears Mid-September Window After 7-of-8 Midterm Gains
CBOE Volatility Index is nearing a historically bullish mid-September seasonal window just as it trades close to the bottom of its 52-week range, raising the stakes for equity risk into early October.
Price as of Sep 4, 2026: $14.53 (last close).

What is the seasonal pattern for CBOE Volatility Index (VIX)?
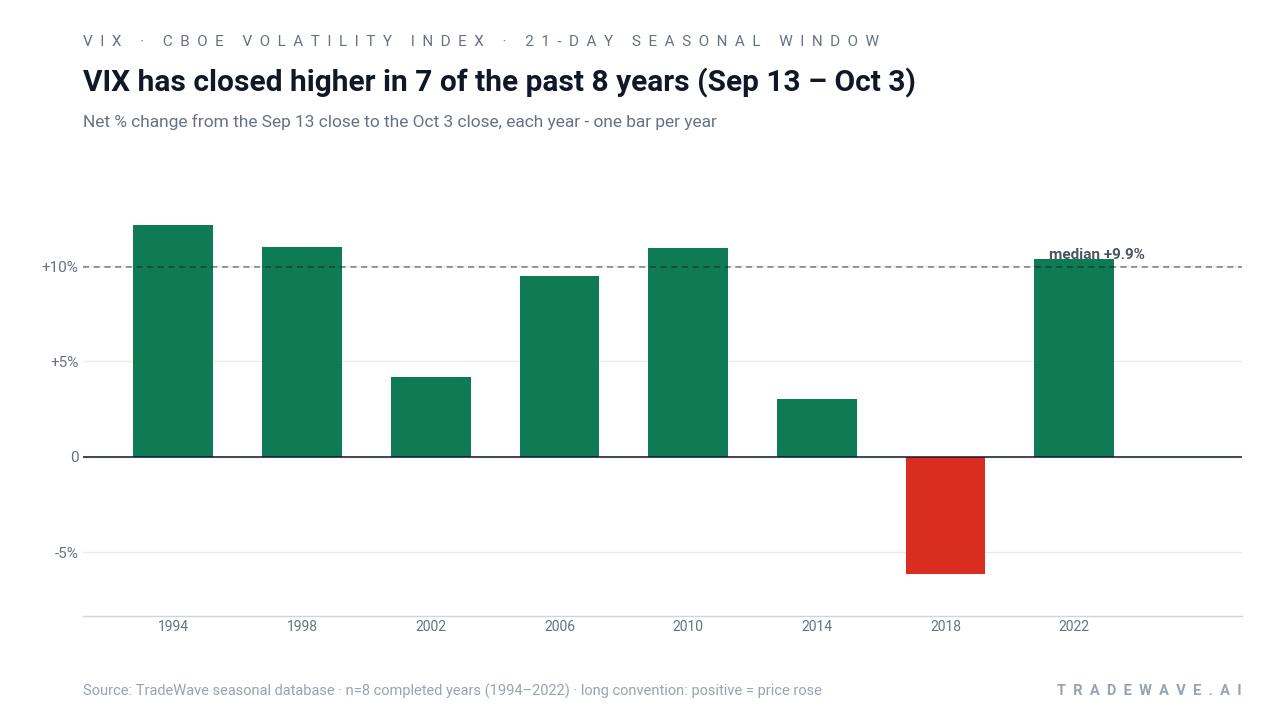
CBOE Volatility Index has risen in 7 of 8 late-midterm-year Sep 13–Oct 3 windows, with an average gain of 8.73% in winning years.
- 7 for 8 in this window, with winning years averaging 8.73% gains and a 68% cumulative return across the sample.
- Percent Profitable is 88%, with 7 winners and 1 loser across the last 8 midterm election years in this 21-day stretch.
- Avg Profit - All, which includes the lone losing year, still comes in at 7%, pointing to a strong bullish seasonal bias for VIX.
- The upcoming window runs from Sep 13 to Oct 3 and sits in the late part of the midterm election year, a phase that often sees policy and macro uncertainty pick up.
- Intraperiod swings have been large, with individual years showing double-digit maximum favorable moves alongside meaningful drawdowns before the window closes.
- Sharpe ratio of 1.07 and a TradeWave Ratio of 3.39 suggest historically attractive upside relative to typical volatility for this specific VIX trading window.
According to historical data from TradeWave.ai, this late-midterm stretch has behaved very differently from an average month on the volatility calendar, and the next iteration is only days away.
How has CBOE Volatility Index (VIX) behaved in the Sep 13–Oct 3 window?
CBOE Volatility Index has closed higher in 7 of the last 8 midterm election years during the Sep 13–Oct 3 window, making this one of its most consistently bullish seasonal stretches. The next 21-day window begins on Sep 13, with VIX last closing at 14.53, about 58.8% below its 52-week high of 35.30 and only about 8.6% above its 52-week low of 13.38. That combination of a historically strong volatility window and a spot level near the bottom of the recent range is exactly the kind of setup equity traders tend to notice.
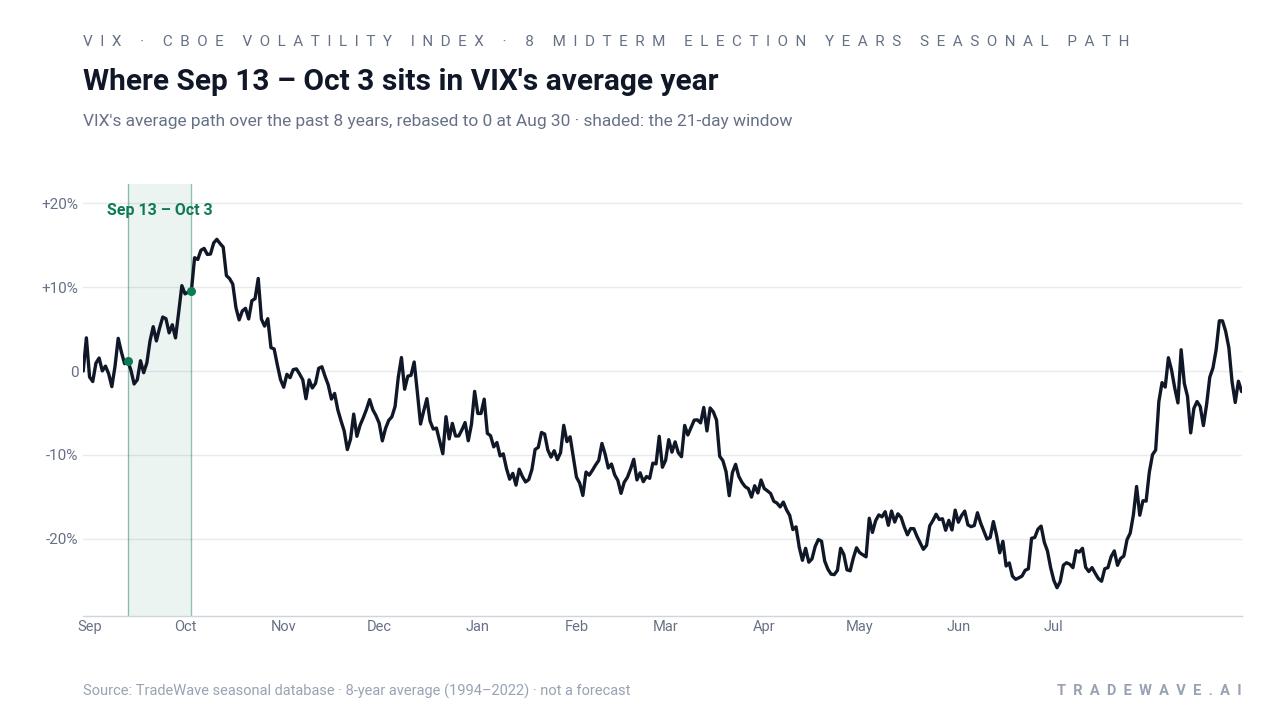
Because this pattern is grouped by the presidential election cycle, it only looks at the last eight midterm election years, not eight consecutive calendar years. That matters in volatility, where policy uncertainty, fiscal debates and mid-cycle growth scares tend to cluster in the midterm year and the transition into the year before the presidential election.
Historically, the trade direction for this window has been long, meaning the pattern is defined around VIX rising rather than falling. Percent Profitable of 88% with 7 winners and 1 loser is unusually strong for a volatility index, where sharp spikes are often followed by quick reversals. The average winning year has delivered an 8.73% gain from the Sep 13 close to the Oct 3 close, while including the losing year still leaves Avg Profit - All at 7%, which is a solid edge for a 21-day slice.
The per-year breakdown shows how that plays out in practice. The strongest year in this sample was 1994, when VIX gained 12.13% over the window after a maximum favorable move of 19.1% and a maximum adverse move of -16.99% from the entry. The weakest outcome for the long setup came in 2018, when VIX finished the window down 6.14% despite a maximum favorable move of 11.16% and a maximum adverse move of -10.27%, underscoring how choppy this period can be even when the final result is negative for the pattern.
The MFE/MAE profile across all eight years points to a high-variance window rather than a gentle drift higher. In several years, VIX has posted intraperiod run-ups of 15% to nearly 28% from the entry level before giving back part of the move by Oct 3. At the same time, adverse excursions have reached into the mid-teens in some cycles, meaning traders who were long volatility during this stretch have historically had to sit through meaningful drawdowns even when the window ultimately finished in the green.
The cumulative return chart compounds each year’s outcome as if an investor repeatedly held this 21-day window across the last eight midterm election years. That line climbs to a 68% cumulative gain, which is a strong result for a short holding period repeated only once every four years. The shape is not perfectly smooth, but the upward bias is clear, with only one notable step down corresponding to the 2018 loss.
A second view combines net results with the full intraperiod range to show how far VIX has typically swung inside this window.
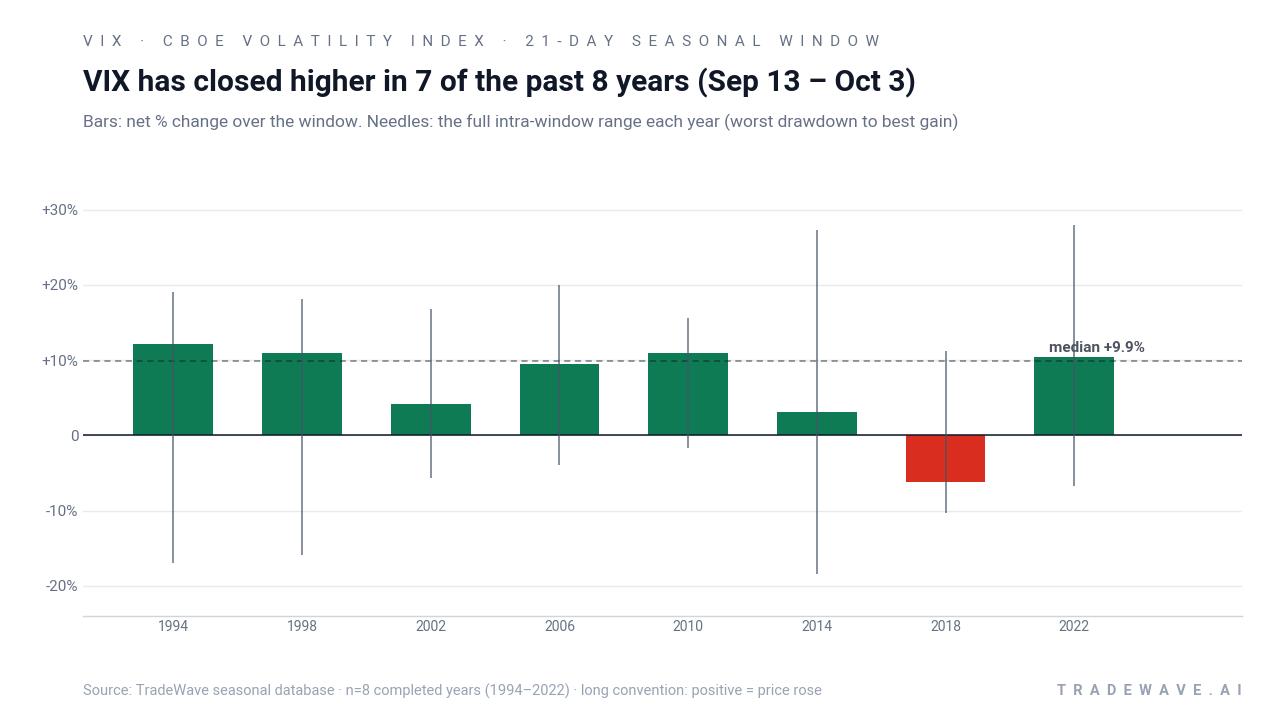
History does not guarantee future results; adverse excursions (MAE) can be large even in winning windows.
Why does CBOE Volatility Index (VIX) follow this seasonal pattern?
One likely driver is the clustering of macro and policy catalysts in late September of midterm election years, from fiscal-year budget deadlines to central bank meetings and early earnings pre-announcements. Analysts have also pointed to institutional portfolio rebalancing and options expiration patterns around quarter-end, which can amplify demand for index options and lift implied volatility. This window sits just before the transition into the historically stronger pre-election year, when markets often reassess risk and hedge equity exposure more aggressively.
What is driving CBOE Volatility Index (VIX) today?
CBOE Volatility Index ended the prior session at 14.53, up 1.47% on the day, leaving it roughly 58.8% below its 52-week high of 35.30 and about 8.6% above its 52-week low of 13.38. That level keeps VIX near the low end of its one-year range even as some market commentary has flagged the index as “sleeping” relative to pockets of higher volatility in the Nasdaq 100, where the Nasdaq 100 Volatility Index has been running hotter and widening the spread between tech and broader-market implied volatility.[5] In parallel, other analysis has framed VIX near 15 as a potential springboard for a bullish swing in volatility that could coincide with a pullback in the S&P 500, a reminder that low volatility regimes can change quickly when macro or policy shocks hit.[4]
The chart below shows how that subdued level fits into the past year of trading, alongside the median seasonal path for the next two months.
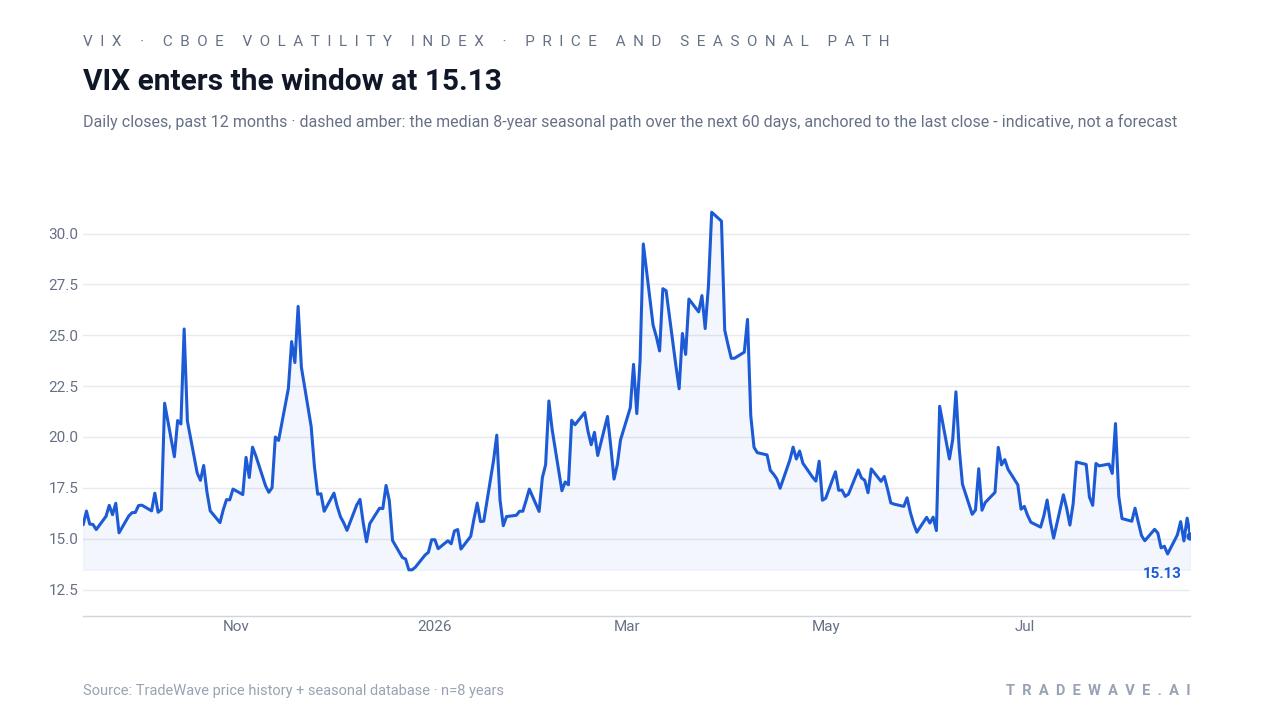
For equity traders, the key relationship is straightforward: when VIX rises, it usually reflects investors paying up for S&P 500 downside protection, which has often coincided with weaker stock prices. With the index sitting close to its 52-week low and a historically bullish VIX seasonal window starting on Sep 13, the next few weeks could test whether this midterm-year pattern repeats or whether calm markets override the usual late-September volatility script.
What should traders watch in this VIX seasonal window?
The first marker is timing. The 21-day window from Sep 13 to Oct 3 has historically been a sweet spot for long volatility exposure in midterm election years, with 7 winners and 1 loser and an Avg Profit - All of 7%. If VIX remains pinned near the low end of its range as the window opens, any quick move toward the high teens or low 20s would be consistent with the historical pattern, while a continued grind around 14 to 15 would be a clear break from it.
Second, watch the macro and policy calendar that tends to intersect this stretch. Late September often brings fiscal-year budget debates, central bank meetings and early corporate guidance updates, all of which can shift expectations for growth, inflation and rates. If those events trigger heavier S&P 500 hedging, VIX could follow the historical seasonal trend; if they pass quietly, the pattern may underwhelm despite its strong track record.
Third, monitor cross-asset volatility spreads, especially between VIX and the Nasdaq 100 Volatility Index. Earlier analysis highlighted periods when Nasdaq volatility ran hot while VIX stayed subdued, creating opportunities for option-income strategies and signaling that stress was concentrated in tech rather than the broader market.[5] If that spread narrows because VIX lifts into the seasonal window, it would suggest volatility is broadening out across sectors, which has historically aligned with stronger VIX performance in this late-midterm stretch.
Finally, keep an eye on how deep intraperiod swings get relative to history. Prior windows have seen maximum favorable moves in the mid-teens to high-20% range and maximum adverse moves that can reach double digits before the trade direction ultimately plays out. If this year’s window delivers a similar pattern of sharp but contained drawdowns followed by strong rallies, it would fit the historical template. A shallow, low-volatility path through early October would be the clearest sign that this midterm-year playbook is changing.
Sources
- Yahoo Finance (Cboe Indices page) - CBOE Volatility Index (^VIX) Options Chain - Yahoo Finance
- Cboe - Volatility Index (VIX ® ) Futures
- MarketWatch - VIX | Cboe Volatility Index Overview | MarketWatch
- MarketBeat - SPY Faces 20% Correction Risk as VIX and Oil Prices Loom
- Seeking Alpha - Nasdaq Volatility Runs Hot While The VIX Sleeps: The Growing Case For Option Income
About this seasonal analysis
Seasonal pattern data is sourced from TradeWave.ai, which analyzes historical price behavior across annual calendar windows going back up to 30 years. Read the full data methodology or the book The 100-Year Pattern by Afshin Moshrefi (2026 edition). Past performance of seasonal patterns does not guarantee future results. This article is for informational purposes only and does not constitute investment advice.