CBOE Volatility Index (VIX) Has Dropped in 8 of 8 Midterm Winter Windows for Shorts
CBOE Volatility Index is jumping back above 17 even as it approaches a mid-October seasonal window that has historically seen implied volatility grind lower through mid-February in every midterm election year since 1994.
Price as of Sep 14, 2026: $17.10 (last close).

What is the seasonal pattern for CBOE Volatility Index (VIX)?
CBOE Volatility Index has fallen in 8 of 8 midterm election years during the Oct 10 to Feb 15 window, with an average 24.29% gain for short positions in winning years.
- 8 for 8 in this window, with VIX closing lower every midterm election year from Oct 10 to Feb 15 and short trades averaging 24.29% profit.
- Seasonal bias is bearish for VIX itself but favorable for short volatility exposure across this 129-day CBOE Volatility Index trading window.
- Percent Profitable is 100%, with 8 winners and 0 losers across the last 8 midterm election years in this pattern.
- Average profit in winning years is 24.29%, with a median outcome of 23.67%, pointing to a fairly consistent historical seasonality profile.
- The TradeWave Ratio (TWR) of 2.88 suggests VIX typically travels meaningfully in the short direction within the window, while the Sharpe ratio of 2.09 reflects strong risk-adjusted returns for the pattern.
- Intraperiod swings have been large, with both sharp spikes and deep fades in implied volatility before VIX ultimately finished lower by the end of the window in prior cycles.
According to historical data from TradeWave.ai, this mid-October through mid-February stretch has behaved very differently from an average winter for volatility, especially in midterm election years.
How has CBOE Volatility Index (VIX) behaved in the upcoming Oct 10 to Feb 15 window?
CBOE Volatility Index has dropped in every single Oct 10 to Feb 15 window across the last eight midterm election years, with short positions averaging 24.29% gains. Today VIX sits at 17.1 after a 7.95% jump in the prior session and is up 18.06% year to date, leaving it well above the mid-teens levels that dominated much of 2025.[1] That combination of an elevated starting point and a historically bearish VIX seasonal trend into winter is the backdrop equity traders will carry into the final weeks of this midterm election year.
Because this pattern is grouped by the presidential election cycle, it reflects how volatility has behaved specifically in the last eight midterm election years rather than in a run of consecutive calendar years. Midterm years often feature heavy policy debate, shifting expectations for fiscal stance and regulation, and a crowded macro calendar, which can front-load volatility into the first three quarters and leave implied volatility grinding lower as markets transition toward the pre-election year.
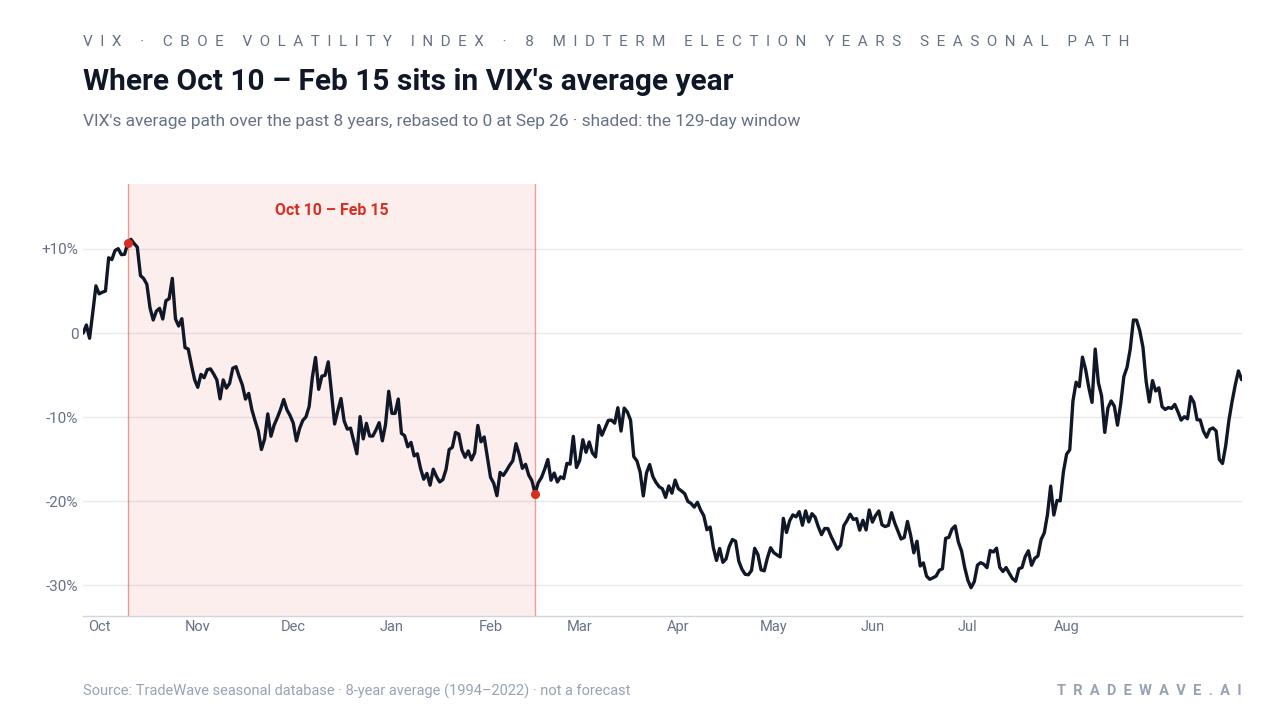
The next chart shows how each midterm-year window balanced intraperiod spikes against the eventual move lower in VIX.
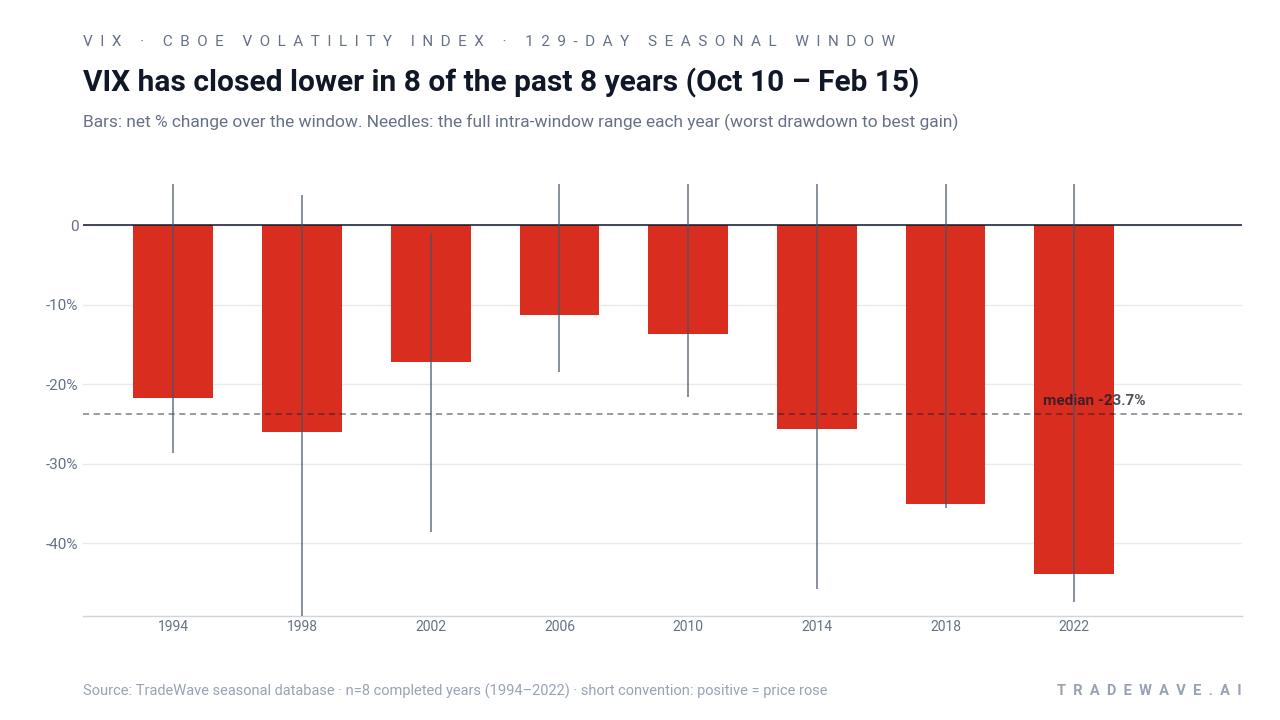
Across the eight completed midterm election years in this sample, every single Oct 10 to Feb 15 window ended with VIX lower than it started, which is favorable for the short trade direction. The average profit of 24.29% and median profit of 23.67% show that outcomes have clustered around a sizeable decline in implied volatility rather than being driven by one outlier year. Annualized, the pattern translates to a 23.88% return profile for the short setup across this 129-day slice of the calendar.
The per-year table shows that even the “milder” years, such as 2006 with an 11.28% drop in VIX, still delivered double-digit percentage declines for shorts, while the strongest years like 2022 saw VIX fall 43.82% from entry to exit. In every case, the direction of travel by mid-February was lower implied volatility, even when the path there was noisy. That consistency is reflected in the 100% Percent Profitable reading, with 8 winners and 0 losers for the short-volatility stance.
Intraperiod behavior has been far more volatile than the smooth win rate suggests. Maximum favorable excursions, defined as the best point-to-peak move in the trade direction within the window, reached as high as 57.67% in 2018, while maximum adverse excursions, the worst drawdowns against the short, ran as deep as 49.89% in 1998. In plain English, VIX has often spiked sharply higher at some point during this window before ultimately fading into a lower close by mid-February.
The cumulative chart for this pattern, which stacks each 129-day result on top of the prior one, compounds to a 454% gain for the short-volatility strategy across the eight midterm election years. That step-like climb, with no interruptions from losing years, underlines how persistent this VIX seasonal trend has been when the calendar lines up with the midterm-to-pre-election transition.
History does not guarantee future results, and the intraperiod adverse excursions in prior midterm-year windows show that drawdowns can be large even when the window ultimately finishes in the trade’s favor.
Why does CBOE Volatility Index (VIX) follow this seasonal pattern?
One likely driver is the way the policy and earnings calendar shifts as markets move from the uncertainty of a midterm election year into the typically more supportive pre-election year. Analysts often point to heavy risk events and macro scares earlier in the midterm year, followed by calmer conditions as fiscal and regulatory paths become clearer and corporate guidance resets. That backdrop can encourage investors to sell equity index options and compress implied volatility into winter, even if occasional shocks still trigger sharp but temporary VIX spikes along the way.
What is driving CBOE Volatility Index (VIX) today?
CBOE Volatility Index closed the prior session at 17.1, up 1.26 points or 7.95% on the day, and is higher by 18.06% so far in 2026 as equity benchmarks hover near record territory.[1] MarketWatch reported on Sep 14, 2026 that VIX had slipped to 14.2 as stocks pushed to highs, even as strategists warned that such calm often precedes a reversal in risk appetite.[1] Other coverage in July highlighted a similar theme, with VIX lingering around the mid-teens while Nasdaq-focused volatility gauges ran hotter, encouraging option-income strategies that lean on low index volatility.[3] The result is a market where implied volatility looks subdued relative to geopolitical and macro risks, but has started to lift off the floor as traders hedge late-cycle equity exposure.
The chart below shows VIX’s past year of closes alongside a 60-day historical seasonal projection for context.
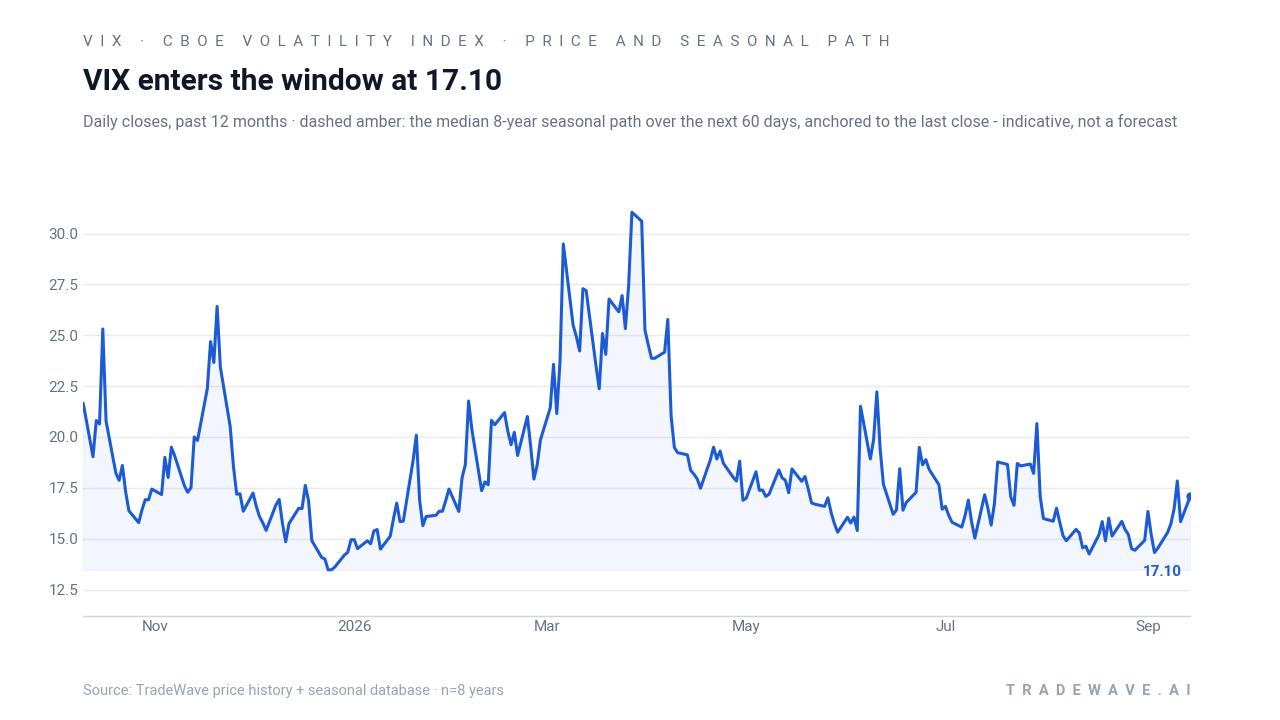
In this regime, low but rising VIX levels have gone hand in hand with strong equity indices and a steady bid for option-selling strategies that monetize calm markets.[1][3] The historical seasonality into the Oct 10 to Feb 15 window suggests that, in prior midterm election years, such periods of quiet have often resolved into a grind lower in implied volatility rather than a sustained volatility breakout. For traders, the tension between an elevated year-to-date gain in VIX and a winter window that has never produced a losing short-volatility year is the key dynamic to monitor as the calendar rolls toward October.
What should traders watch as this VIX seasonal window approaches?
First, the calendar: the 129-day window begins on Oct 10 and runs through Feb 15, overlapping the handoff from the concluding midterm election year into the pre-election year, when policy visibility typically improves. Second, levels: how VIX behaves around the mid-teens to high-teens band will matter, since prior midterm-year windows often started from elevated readings that then bled lower over the winter. Third, behavior inside the window: if VIX delivers its usual pattern of sharp but temporary spikes followed by fades, that would align with the historical MFE/MAE profile; a sustained move higher in implied volatility that refuses to mean-revert would be a clear break from the last eight cycles.
Finally, traders should keep an eye on how equity markets digest upcoming macro data and policy headlines, because implied volatility typically compresses when stocks grind higher and expands when risk-off episodes hit. If equities continue to hold near highs while VIX drifts lower into and through the window, it would echo the historical seasonal trend. If instead macro shocks or policy surprises trigger a lasting volatility regime shift, this would be one of the rare times the midterm-year winter pattern fails to deliver its usual short-volatility edge.
Sources
About this seasonal analysis
Seasonal pattern data is sourced from TradeWave.ai, which analyzes historical price behavior across annual calendar windows going back up to 30 years. The framework groups results by both calendar timing and presidential election-cycle phase to surface patterns that traditional charts often miss. Past performance of seasonal patterns does not guarantee future results, and this article is for informational purposes only and does not constitute investment advice.