Oracle Corporation (ORCL) Has Risen 9 of 9 Midterm Windows From Sep 15, Averaging 24.12% Gains
Oracle Corporation is stepping into a historically powerful midterm-year seasonal window just as the stock trades well below its 52-week high and options activity heats up.
Price as of Sep 14, 2026: $144.79 (last close).
What is the seasonal pattern for Oracle Corporation (ORCL)?
Oracle Corporation has risen in 9 of 9 midterm-election-year windows starting Sep 15, with an average gain of 24.12% in winning years.
- 9 for 9 in this window, averaging 24.12% gains in winning years across the last 9 midterm election years.
- Seasonal window runs 241 days from Sep 15 to May 13, aligned with the transition from the midterm election year into the pre-election year.
- Percent Profitable is 100%, with 9 winners and 0 losers over the historical sample.
- Median outcome is a 27.78% gain, with cumulative return of 572% when the window is stacked across all nine cycles.
- Maximum favorable moves inside the window have reached as high as 128.71%, while adverse drawdowns have stretched to -29.13% in the toughest year.
- Trade Direction is long, with a Sharpe ratio of 1.77 and a TradeWave Ratio of 1.11 indicating strong upside travel relative to risk.
According to historical data from TradeWave.ai, this specific midterm-year stretch has behaved very differently from an average calendar period for Oracle. The next section unpacks how that pattern has played out and where the new window fits in the current cycle.
How has Oracle Corporation (ORCL) traded in this midterm-year window?
Oracle Corporation has risen in 9 of the last 9 midterm election years during the 241-day window that starts on Sep 15, averaging 24.12% gains for long positions. The stock enters this year’s iteration at $144.79, down 16.8% year to date and about 55.1% below its 52-week high of $322.12. Unusually heavy call option buying has emerged in recent days, with MarketBeat flagging a surge in call volume on Sep 11 that points to traders leaning into upside exposure ahead of the window.[9]
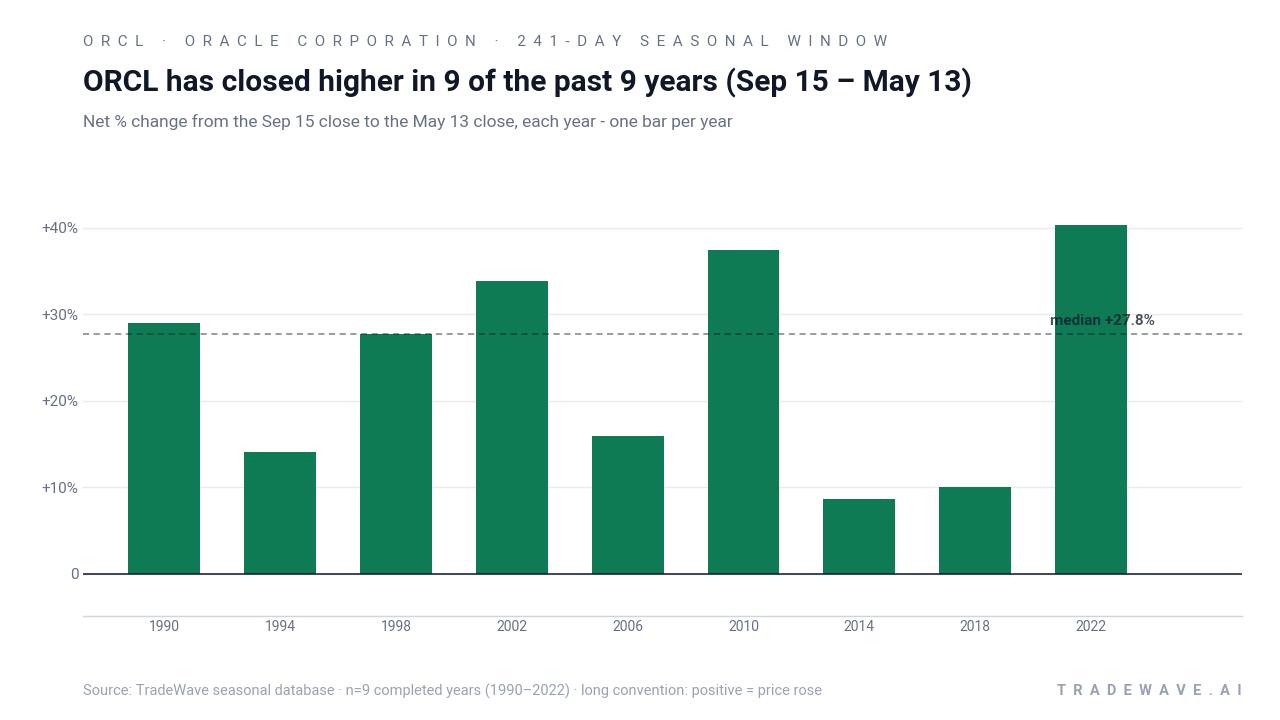
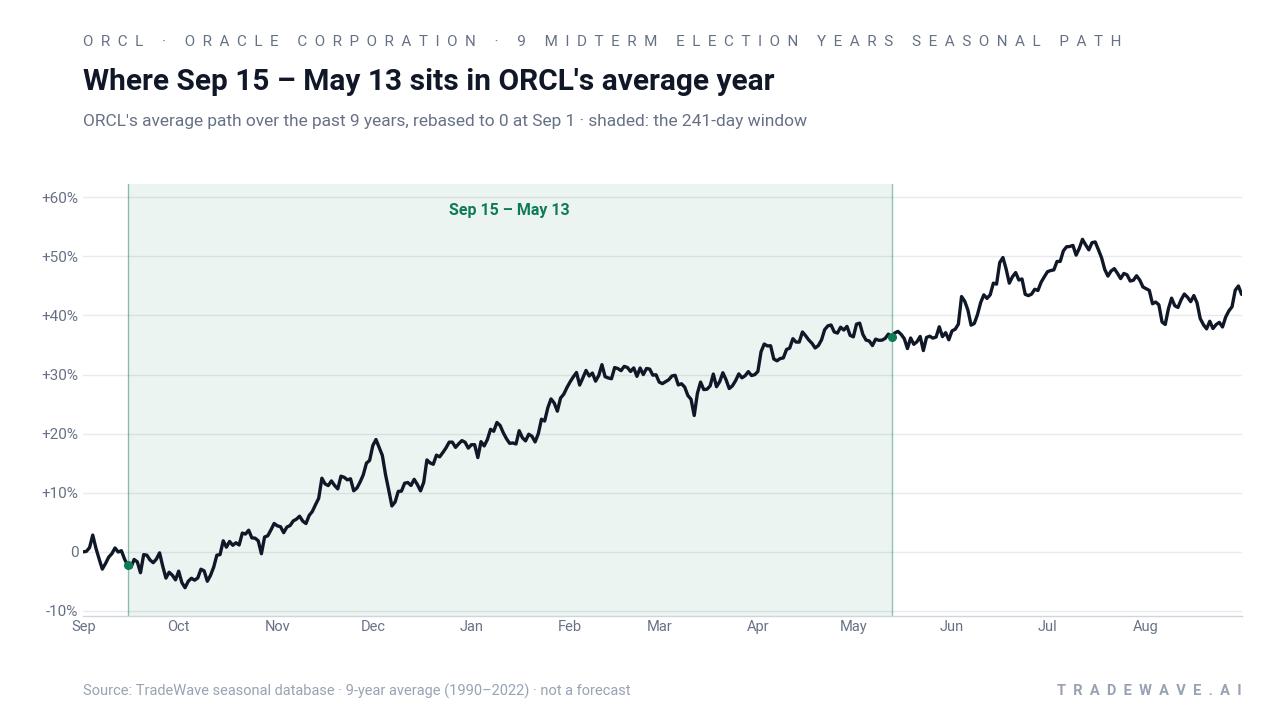
The presidential election cycle matters here because this pattern only looks at the last nine midterm election years, then follows Oracle from the late part of that year into the following pre-election year. That lines up with a policy backdrop where Washington is usually past the midterm vote, fiscal plans are clearer, and risk appetite has often improved into the pre-election year.
Across those nine midterm-election-year samples, every single Sep 15 to May 13 window finished positive for a long trade. The median gain of 27.78% sits slightly above the average, which tells you the wins have been relatively consistent rather than driven by one outlier year.
The per-year table shows how that has played out in practice. The weakest outcome was 8.7% in 2014, while the strongest was 40.29% in 2022, with several other cycles landing in the mid-teens to high-30s range. Add it up and stacking the window across all nine midterm years compounds to a 572% cumulative return.
Yearly net and intraperiod swings show how much upside and downside Oracle has historically seen inside this window.
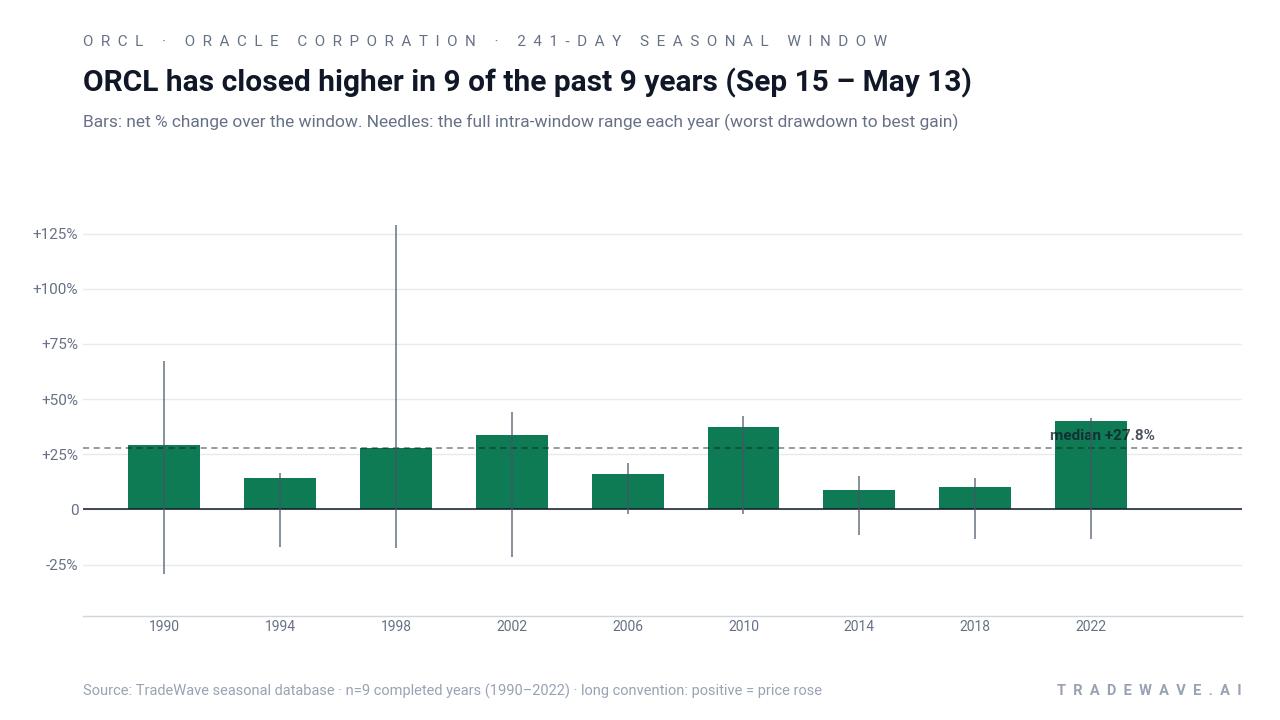
The intraperiod profile is not a straight line. In 1990, Oracle’s best run-up inside the window reached 67.2%, but the worst drawdown from entry was -29.13% before the trade finished up 29.01%. In 1998, the maximum favorable move hit 128.71% while the worst pullback was -17.36%, again ending with a 27.78% gain. More recent cycles such as 2010 and 2022 show smaller but still notable adverse moves of around -2% to -13% alongside strong double-digit net gains.
Put together, the TradeWave Ratio of 1.11 and Sharpe ratio of 1.77 describe a window where Oracle has historically traveled meaningfully in the long direction with risk-adjusted returns that are high for a single stock pattern. The key nuance is that the maximum adverse excursions have sometimes arrived early in the window, while the maximum favorable moves often built later as the calendar rolled into the pre-election year.
History does not guarantee future results; adverse excursions (MAE) can be large even in winning windows.
Why does Oracle Corporation (ORCL) follow this seasonal pattern?
One likely driver is the way Oracle’s fiscal calendar and big cloud contracts line up with the broader presidential election cycle. Analysts have pointed to stronger risk appetite and tech spending as Washington exits the midterm election year and corporate IT budgets reset into the pre-election year, which can favor large-cap software and infrastructure names like Oracle.[1][4][6] The pattern may also reflect institutional portfolio repositioning around fiscal year-ends and sector rotation into enterprise software as visibility on policy and rates improves.
What is driving Oracle Corporation (ORCL) today?
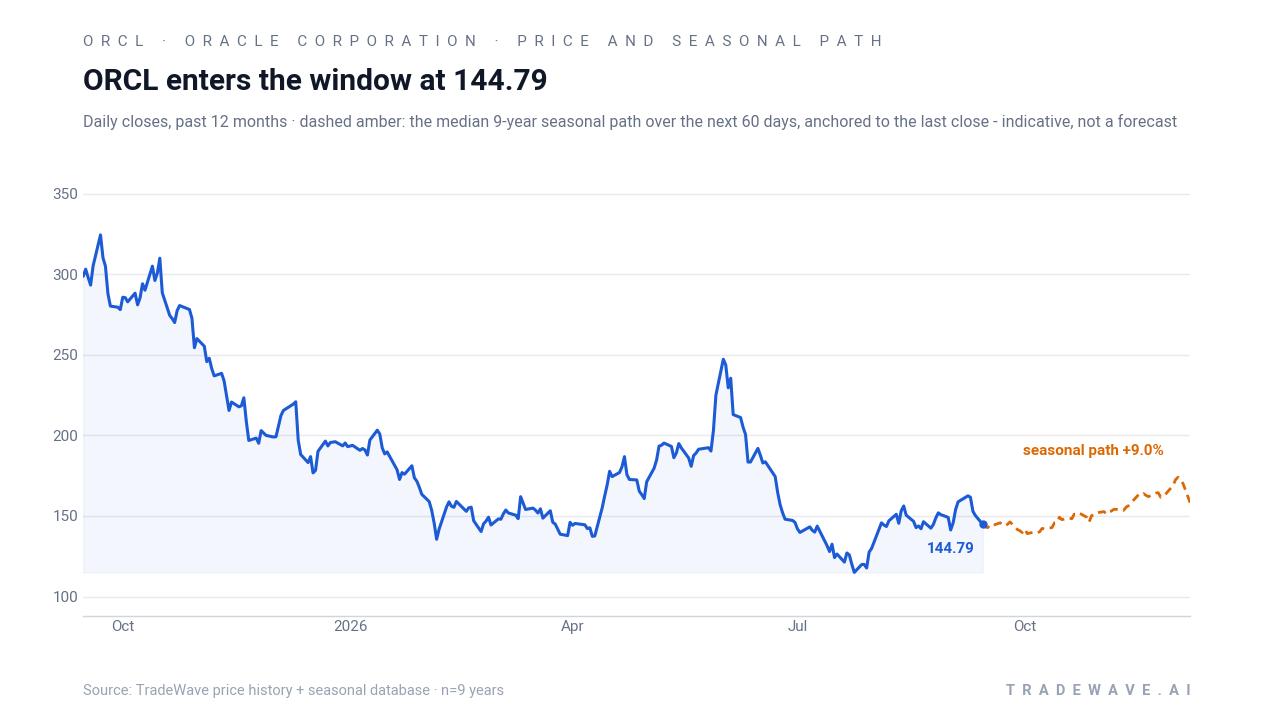
Oracle shares closed Monday at $144.79, down 3.7% on the day and 16.8% lower for 2026, leaving the stock well off its 52-week high of $322.12 even after a strong run in prior years. The latest pullback follows a MarketBeat instant alert on Sep 14 highlighting an analyst downgrade and renewed scrutiny of valuation after a powerful AI-driven rally earlier in the cycle.[13]
The fundamental backdrop, however, remains strong. On Sep 10, Oracle reported fiscal first-quarter 2027 results that beat LSEG consensus, with revenue up 30% year over year and net income of $4.68 billion, or $1.56 per share, helped by robust cloud and infrastructure demand tied to AI workloads.[4] Management raised its outlook for fiscal 2027 to at least $90 billion in revenue and $8.10 in adjusted EPS, reinforcing the idea that the business is still in a high-growth phase even as the stock has corrected.
Positioning is also in motion. MarketBeat’s options alert on Sep 11 flagged unusually high call option volume in Oracle, suggesting traders are using leverage to bet on a rebound rather than pressing shorts.[9] Separate MarketBeat data shows short interest at about 2.0% of float as of late January, a modest level that leaves room for positioning to build but does not yet signal a crowded bearish trade.[10]
On the institutional side, flows remain active. A Sep 12 filing update showed Corient Private Wealth LP adding to its Oracle stake, underscoring that some large investors are using the drawdown to increase exposure.[12] Earlier MarketBeat coverage has framed the stock as trading at a lower price-to-earnings multiple than some mega-cap tech peers, with a “Moderate Buy” consensus rating and a MarketBeat consensus price target of $261.68 that still sits well above the current share price, though some of those targets were set when the stock traded in a higher range.[1][3][5][6]
The chart below situates the latest move in its recent multi-month context alongside the historical 60-day seasonal path.
What should traders watch in this Oracle seasonal window?
First, watch how Oracle trades around the $140 area as the Sep 15 window opens. In prior midterm-election-year cycles, deeper early drawdowns have often been followed by stronger recoveries later in the window, but the MAE history shows that those early dips can be sharp before the trend turns higher.
Second, keep an eye on whether the post-earnings narrative stays focused on AI infrastructure growth and the raised fiscal 2027 outlook, or shifts back toward concerns about valuation and competition.[4][6][13] A sustained focus on backlog, cloud growth and margin expansion would be more consistent with the historical pattern of strength into the pre-election year.
Third, monitor options flow and volume. If the recent spike in call buying persists or builds, it would signal that traders are leaning harder into the upside case as the seasonal window progresses; if it fades or flips toward puts, that would suggest the market is less willing to trust the historical pattern this time around.[9]
Finally, map Oracle’s behavior against the broader policy and macro calendar. The window spans the conclusion of the midterm election year and the start of the pre-election year, a phase that has often coincided with clearer fiscal plans, steadier rate expectations and stronger risk appetite for large-cap tech.[1][4][6] If Oracle can hold its recent lows and begin to track closer to its historical seasonal trend as 2027 approaches, that would be a sign that the midterm-year pattern is still in play; if it continues to lag despite supportive fundamentals, this could be the cycle that breaks a nine-for-nine streak.
Sources
- MarketBeat - Oracle (ORCL) Stock Price, News & Analysis
- Zacks - Oracle Stock Jumps on Q3 Earnings Beat: Buy Now or Wait?
- MarketBeat - ORCL Stock: Analysts See Big Upside, but Targets Are Mixed in 2026
- CNBC - Oracle (ORCL) Q1 earnings report 2027 - CNBC
- MarketBeat - ORCL Stock Sell-Off Disconnects From AI Backlog Reality
- Seeking Alpha - Oracle Stock: Bears May Pay A Big Price (Rating Upgrade)
- MarketWatch - Oracle’s stock could surge 80%, says this analyst who predicts a major rebound
- MarketBeat - Oracle (NYSE:ORCL) Trading 10.9% Higher - Here's Why
- MarketBeat - Traders Purchase High Volume of Call Options on Oracle (NYSE:ORCL)
- MarketBeat - Oracle (ORCL) Short Interest & Short Float | Updated Sep 2026
- MarketBeat - Oracle Corporation $ORCL Shares Sold by ZWJ Investment Counsel Inc.
- MarketBeat - Oracle Corporation $ORCL Shares Bought by Corient Private Wealth LP
- MarketBeat - Oracle (NYSE:ORCL) Trading Down 3.9% on Analyst Downgrade
About this seasonal analysis
Seasonal pattern data is sourced from TradeWave.ai, which analyzes historical price behavior across annual calendar windows going back up to 30 years. Read the full data methodology or the book The 100-Year Pattern by Afshin Moshrefi (2026 edition). Past performance of seasonal patterns does not guarantee future results. This article is for informational purposes only and does not constitute investment advice.