The Economy Is Running Its Hottest Since 2021 — and the Calendar Just Opened a Window That Has Worked 23 of 24 Times in Nearly 100 Years
US business activity is expanding at its fastest pace in five years, factory output is accelerating, and earnings are tracking roughly 30% growth. On September 27 the S&P 500 also enters a 295-day seasonal window that has finished higher in 23 of the last 24 midterm election cycles.

The short version: the incoming data says this economy is accelerating, not slowing. The 95-year record says the stretch from September 27 to July 18 of the following year has been the single most reliable run on the midterm calendar. Both point the same direction at the same moment — which is rarer than it sounds.
The economy is not cooling. It is speeding up.
Start with the number that moves first. The S&P Global US Flash Composite PMI came in at 58.4 in September, up from 56.0 in August and the strongest reading since July 2021. That is the fourth consecutive month of acceleration. Anything above 50 signals expansion; 58.4 is the kind of print that shows up in the early-to-middle innings of a genuine upcycle, not at the end of one.
Underneath the headline, the composition is better than the headline. Services came in at 58.7 against expectations of 56.0. Manufacturing jumped to 57.0 from 53.9, the fastest factory output growth since April 2022. Factory hiring is growing at its quickest rate since February 2021, and order backlogs are building at the fastest pace since May 2022 — firms are taking in work faster than they can clear it.
The Atlanta Fed's GDPNow model has Q3 real GDP growth running at 4.6%. Corporate profits are keeping pace: FactSet has S&P 500 earnings growth estimated at 28.9% for Q3 and 26.5% for Q4, with calendar 2026 tracking roughly 31.8%.
Where the growth is coming from
Two engines, and they reinforce each other.
The first is physical. Rail carloads in Q1 2026 were the best since 2019, up 4.2% year over year. Flatbed tender rejections — the share of freight loads carriers turn down because they are already full — topped 40% in March. Truckload spot rates hit a record $3.83 per mile in June. That is not a services-sector story or a financial-engineering story. That is steel, equipment, and construction material physically moving around the country, which is what an industrial build-out looks like in the data before it looks like anything in the headlines. Worth noting: flatbed capacity has loosened considerably since the spring peak, so this engine is running hot but no longer red-lining.
The second is capital. Microsoft, Alphabet, Meta and Amazon are on track for roughly $760 billion in combined capital expenditure in 2026, against $413 billion in 2025. The hyperscalers remain supply-constrained — they are spending as fast as they can get hardware and power, not as fast as demand justifies. Capex at that scale lands in GDP as it is spent, and it lands in freight and factory data on the way there. The two engines are the same engine seen from different ends.
The honest counterweight: this is why the Fed is raising rates
A booming economy is not an unambiguous gift to equity holders, and it would be dishonest to present it as one.
Fed Governor Michael Barr said on September 23 that growth is strong, the labor market is solid, and inflation remains above the 2% target — and that further rate increases are likely needed. He named the pressures directly: tariffs, the Middle East conflict, the war in Ukraine, and the surge in AI-related investment. Markets have taken the message. Kalshi has been pricing roughly 62% odds of an October hike, with something like four increases priced in by September 2027, and the 10-year Treasury yield has pushed above 5%.
There is a second caution worth putting on the table. Citigroup's earnings revision index turned net negative on September 22, ending a 23-week run of net upgrades. Estimates for 2027 already slow to about 15% growth from 2026's 31.8%. And at a forward P/E near 19.1, this market is not priced for disappointment.
So the setup is a strong economy meeting a tightening Fed and a full valuation. That is a real tension, not a rhetorical one. Which raises the question worth actually answering.
Has this combination shown up before — and what happened?
It has. And this is where a 95-year database earns its keep, because the answer is not a matter of opinion.
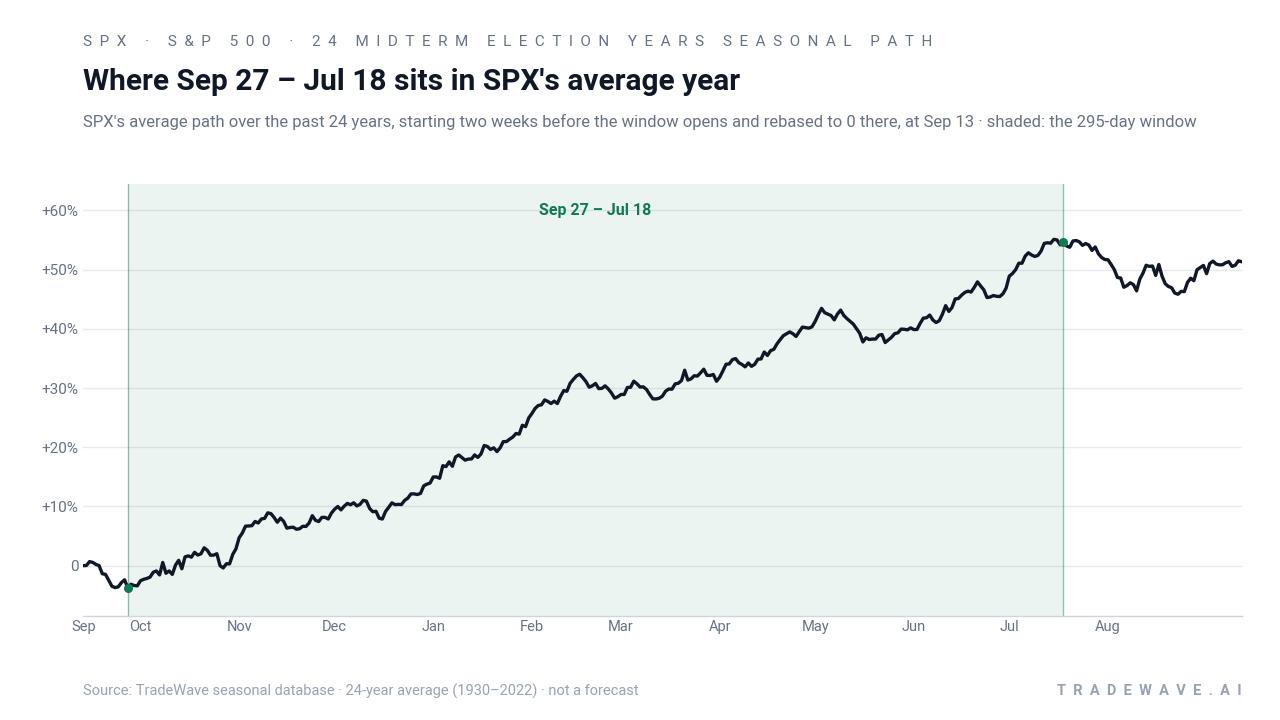
Every midterm election year, the S&P 500 enters a 295-day stretch running from September 27 to July 18 of the following year. Across 24 completed cycles from 1930 through 2022, that window closed higher 23 times. One loss. The average gain across all 24 years is 18.79%, the median is 18.92%, and the average of the winners is 20.63%.
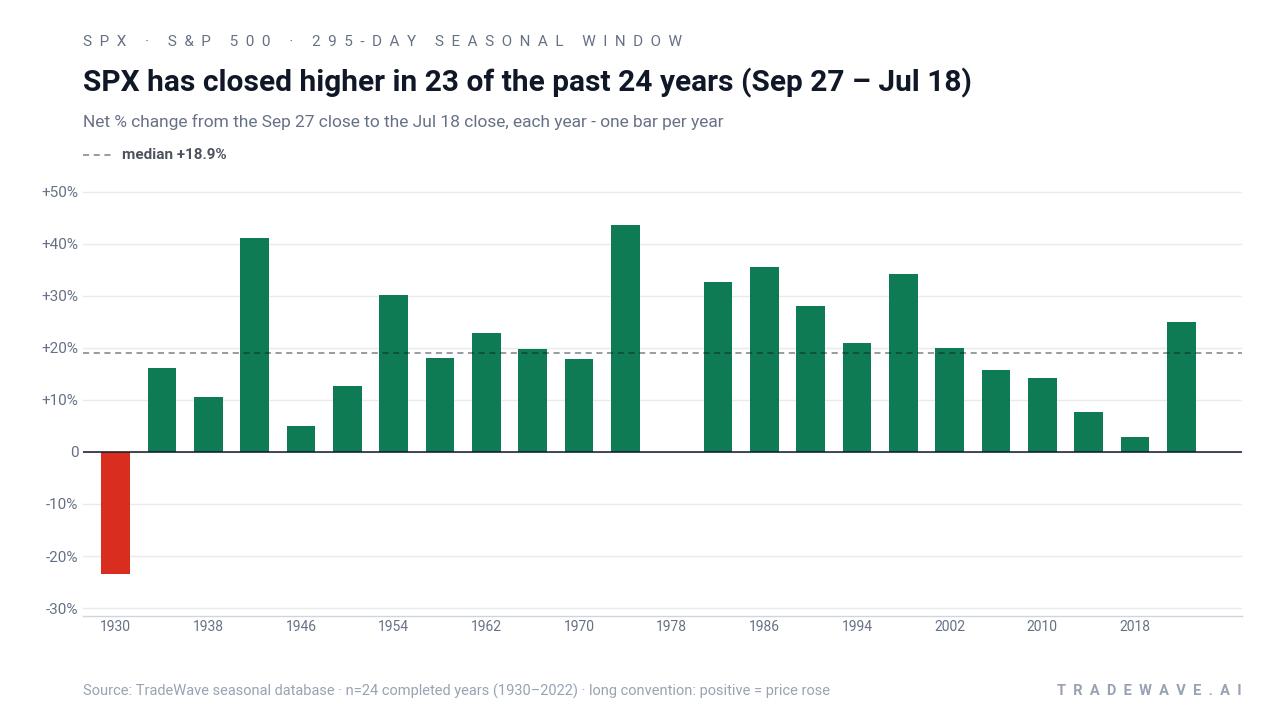
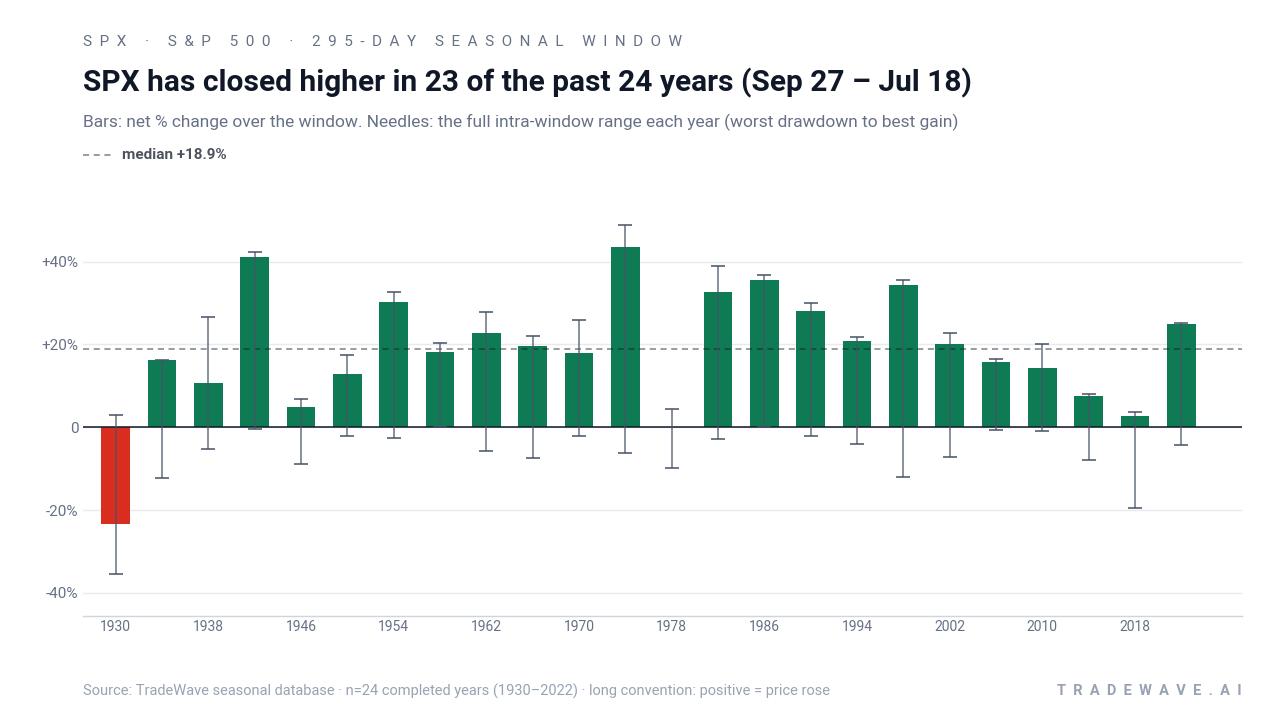
The single losing year was 1930 — the second year of the Great Depression, with the window ending down 23.41%. Every cycle since has finished positive. The narrowest escape was 1978, which closed up just 0.03% after being down 9.85% intra-window. The largest gain was 1974, up 43.52%, followed by 1942 at 41.17%.
Specifically, what happened when the Fed was hiking?
This is the question the current setup demands, and the sample is small but unanimous. Four of the 24 cycles opened with the Fed in a tightening posture: 1978, 1994, 2018 and 2022. All four finished positive.
| Cycle | Net return | Worst intra-window drawdown |
|---|---|---|
| 1978 | +0.03% | -9.85% |
| 1994 | +20.87% | -4.15% |
| 2018 | +2.78% | -19.47% |
| 2022 | +24.89% | -4.27% |
Average across those four: roughly 12%, against 18.79% for the full 24-year set. So tightening has historically cost something — but it has not flipped the sign. What it has done is make the ride considerably rougher. 2018 finished up 2.78% but drew down 19.47% along the way. 1978 ended essentially flat after a near-10% hole. An investor who could not sit through the middle would not have collected the end.
This is not a proprietary finding
The midterm effect is well documented by people with no stake in our database. Fidelity puts the post-midterm win rate at 95% since 1938 with roughly 14% average gains. U.S. Bank finds 16.3% average returns in the 12 months following a midterm since 1962, against 8.1% for all years. Franklin Templeton notes every one of the 18 midterm cycles since 1950 produced a positive 12-month return. The Stock Trader's Almanac has tracked a similar stretch for decades under the name "Sweet Spot."
Our contribution is the precision of the dates and the depth of the history — 1930 forward, entry September 27, exit July 18, measured the same way every cycle. RBC, for what it is worth, flags rising rates as the single biggest risk to the pattern repeating. Which is exactly the risk in front of us.
Where that leaves the current cycle
The S&P 500 closed at 7,716.21 on Friday, down 0.62%, trading between 7,711.47 and 7,761.94 on the day, against a 52-week range of 6,316.91 to 7,816.70. Volume ran to 1,188,303,000 shares. The window opens from a level near the top of that range, not from a washed-out base — which is worth holding in mind, since several of the strongest cycles in the set opened from depressed levels.
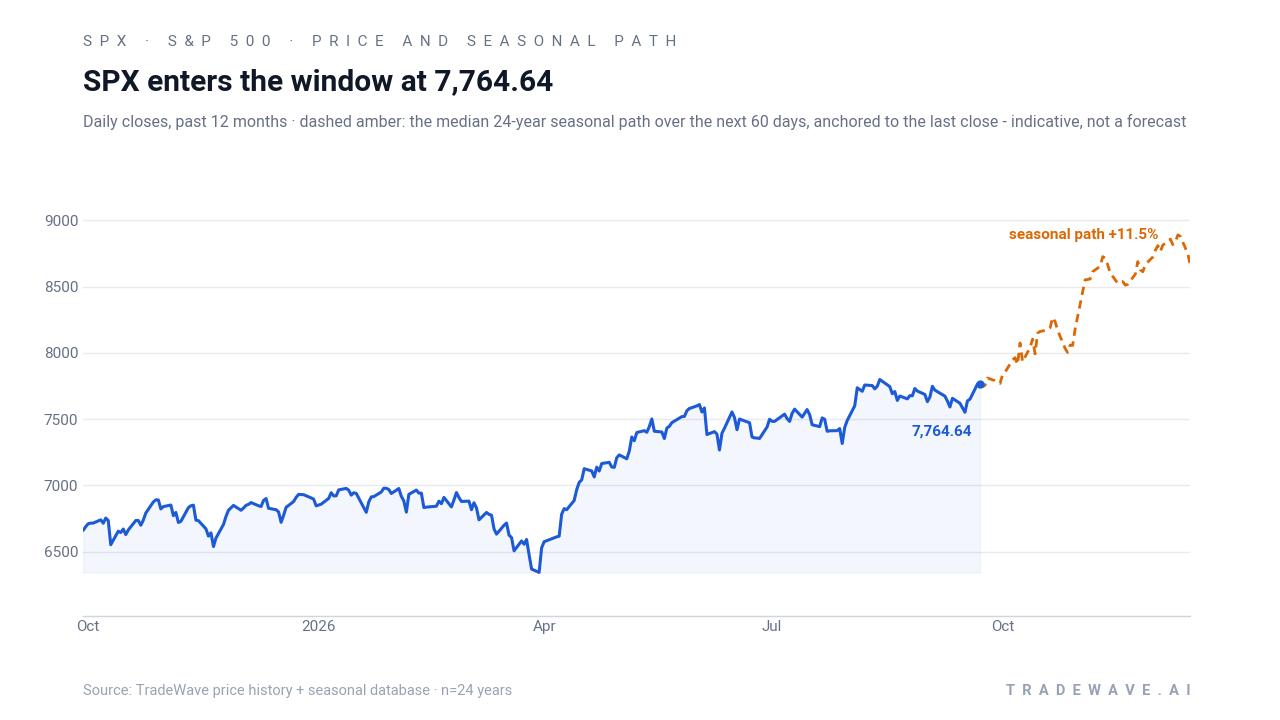
Here is the fair summary. The fundamentals are about as strong as they have been in five years, and the seasonal record is about as strong as any calendar effect in the equity market. Those two things agreeing is the setup. The disagreement is that a booming economy is precisely what is pulling the Fed toward more hikes, and rate increases are the one condition that has historically compressed this window's returns — without, so far, reversing them.
What would break it: a rate path materially steeper than the four hikes currently priced, a further rollover in earnings revisions after the September 22 turn, or a multiple compression from 19.1x forward that overwhelms 30% earnings growth. One loss in 24 is a strong record. It is not a guarantee, and the loss that did occur was severe.
Key takeaways
- US flash composite PMI hit 58.4 in September, strongest since July 2021 and the fourth straight monthly acceleration.
- Manufacturing PMI jumped to 57.0 with the fastest factory output growth since April 2022; hiring is the strongest since February 2021.
- Big Tech capex is tracking roughly $760 billion for 2026 versus $413 billion in 2025, with hyperscalers still supply-constrained.
- The Sep 27 – Jul 18 window has closed higher in 23 of 24 midterm cycles since 1930, averaging 18.79%.
- All four cycles that opened during Fed tightening finished positive, averaging about 12% — with notably deeper drawdowns.
- Principal risks: a steeper hike path than priced, the September 22 turn in earnings revisions, and a 19.1x forward multiple.
Methodology
The window is measured from the September 27 close of each midterm election year to the July 18 close of the following year, a span of 295 calendar days, across 24 completed cycles from 1930 through 2022. Returns are net percentage change in the S&P 500 index, long convention, with no dividends, financing costs or transaction costs included. Maximum adverse and favorable excursions are measured on closing prices within the window. Where a date falls on a non-trading day, the nearest prior close is used.
Sources
- S&P Global, US Flash Composite PMI, September 2026.
- Federal Reserve Bank of Atlanta, GDPNow, Q3 2026 estimate.
- Federal Reserve Governor Michael Barr, public remarks, September 23, 2026.
- FactSet Earnings Insight, S&P 500 earnings growth estimates, September 2026.
- Association of American Railroads, Q1 2026 rail carload data.
- DAT Freight & Analytics, truckload spot rates and tender rejection data, 2026.
- Company filings and guidance: Microsoft, Alphabet, Meta, Amazon capital expenditure, 2025–2026.
- Citigroup Global Markets, earnings revision index, September 22, 2026.
- Fidelity Investments, midterm election year market research.
- U.S. Bank Wealth Management, post-midterm equity returns since 1962.
- Franklin Templeton, midterm cycle analysis since 1950; RBC Capital Markets, midterm seasonality and rate risk.
- TradeWave seasonal database, S&P 500 daily closes 1930–2026. Full evidence: tradewave.ai/100-year-pattern