Guidance Hike and 6.2% Same-Store Growth Put Starbucks (SBUX) Near a Bullish Midterm Stretch
Starbucks is heading toward a 108-day midterm-election seasonal window that has never been negative in this sample, even as the stock trades just below its 52-week high.
Price as of Jul 21, 2026: $104.45 (last close).

What is the seasonal pattern for Starbucks (SBUX)?
Starbucks has risen in 8 of 8 midterm-election-year windows starting in early August, with an average gain of 15.14% in winning years.
- 8 for 8 in this window, with Starbucks averaging 15.14% gains across all winning years.
- The upcoming seasonal window begins on Aug 5, 2026 and runs for 108 trading days into the heart of the holiday quarter.
- Percent Profitable is 100%, with 8 winners and 0 losers across the last eight midterm election years.
- Average winner gains range from low single digits to more than 30%, with a median profit of 16.77%.
- Intraperiod swings have been meaningful, with some years seeing adverse moves of more than 20% before finishing higher.
- The TradeWave Ratio of 1.78 and Sharpe ratio of 1.4 point to a historically strong long-side seasonal trend in this specific Starbucks trading window.
According to historical data from TradeWave.ai, this midterm-election stretch for Starbucks has behaved very differently from an average autumn in the stock. The next section walks through how that pattern has played out in prior cycles and what it means for the upcoming window.
How has Starbucks (SBUX) traded in past midterm-year autumn windows?
Starbucks has posted gains in all eight midterm-election-year windows that start around Aug 5 and run for 108 trading days, averaging a 15.14% profit for long positions. Shares finished Wednesday at $104.45, down 0.3% on the day and about 4.4% below their 52-week high of $109.23, leaving the stock near the upper end of its recent range.
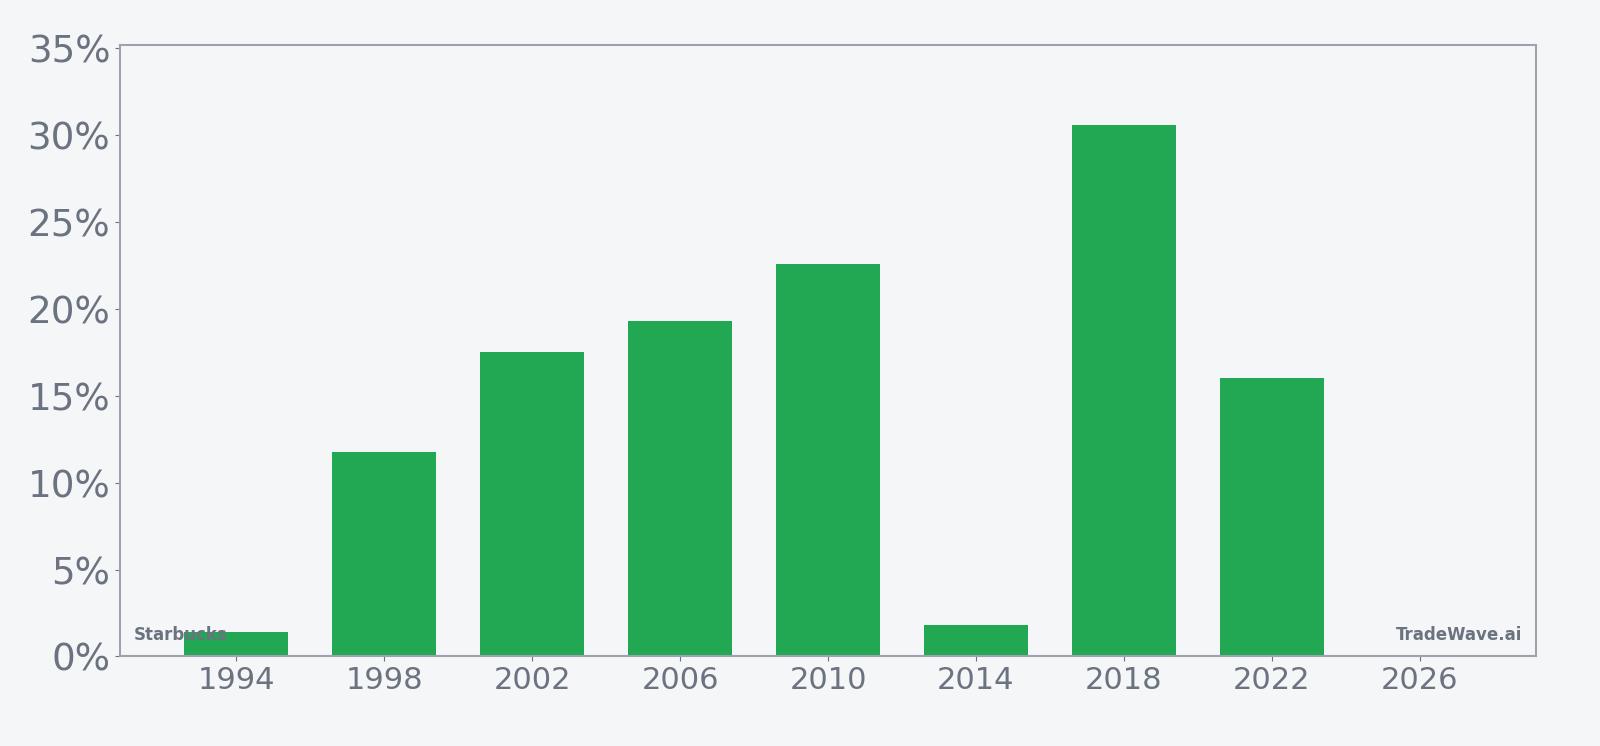
Grouping the data by the presidential election cycle matters here because Starbucks’ strongest seasonal stretch lines up with the midterm-to-pre-election transition, when policy uncertainty often fades and consumer-facing stocks have historically seen steadier demand. This 108-day Starbucks trading window sits inside that mid-cycle handoff, capturing both back-to-school traffic and the early build into the holiday quarter.
Across the last eight midterm election years in this pattern, the trade direction is firmly long. Percent Profitable is 100%, with 8 winners and 0 losers, and the average profit of 15.14% means the typical year has delivered a mid-teens gain over the window. The median profit of 16.77% shows that results have clustered around that mid-teens outcome rather than being skewed by a single outlier.
Individual years still look very different under the hood. The weakest net result in this sample came in 1994, when Starbucks gained just 1.41% over the window, while the strongest year was 2018 with a 30.61% net return. In between, years like 2006 and 2010 posted gains of 19.32% and 22.6% respectively, while 2022 delivered a 16.0% rise from entry to exit.
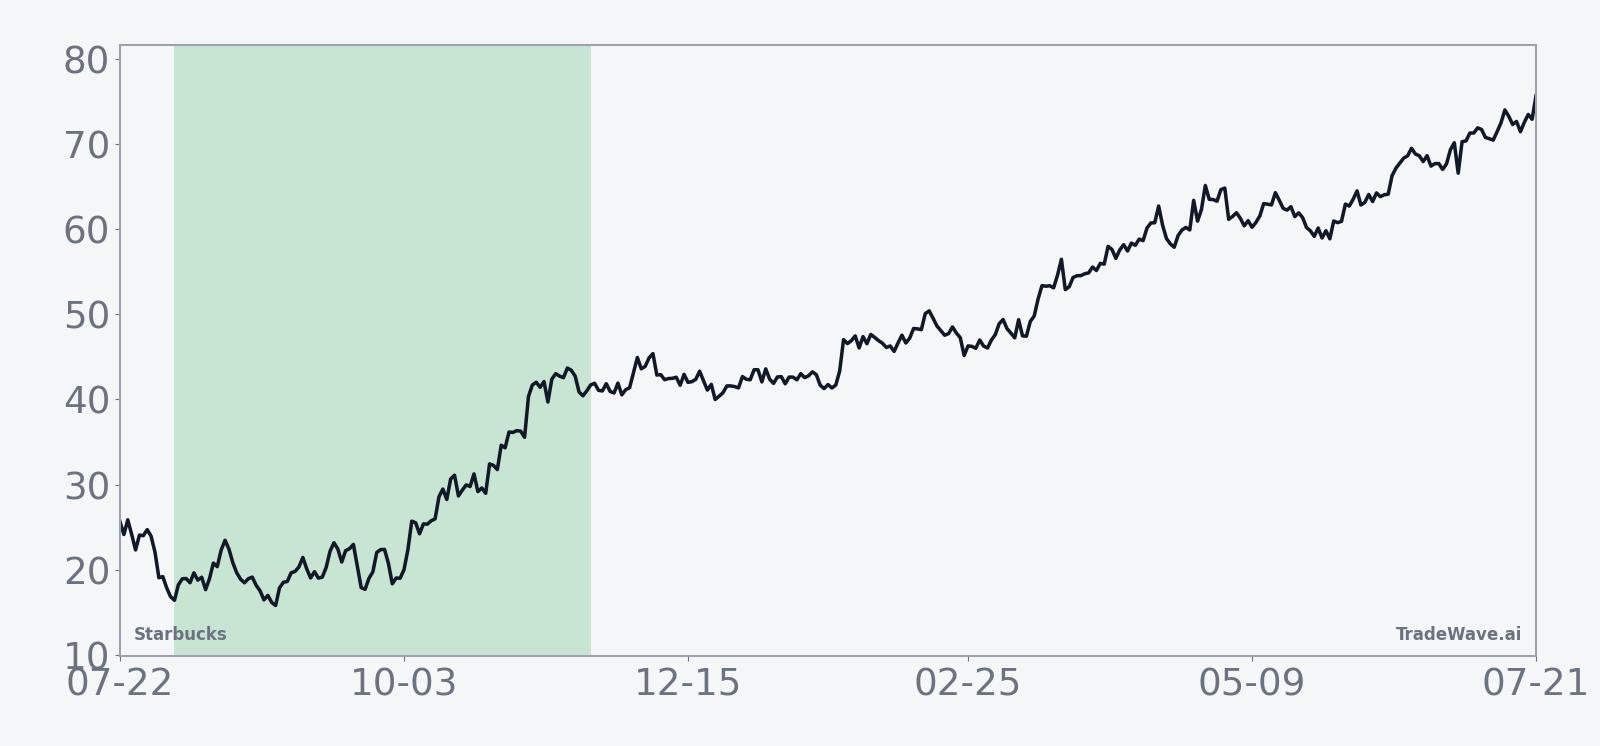
The historical seasonal average suggests that gains have tended to build gradually rather than in a single burst. The typical SBUX seasonal trend in this window shows a firming bias early on, some choppiness in the middle of the period, and then another leg higher into the final third, which overlaps the early holiday season. That profile fits a narrative where investors position into Starbucks as consumer spending visibility improves later in the year.
Intraperiod swings, however, have been anything but smooth. Maximum favorable excursions, the best point-to-peak moves within the window, have reached as high as 33.4% in 2018 and around 29% in several other years. At the same time, maximum adverse excursions, the worst drawdowns from entry, have been as deep as -26.75% in 1998 and -22.52% in 1994, even though both of those years still finished positive.
Year-by-year bars that combine net results with peak run-ups and worst drawdowns show how often Starbucks has dipped before resuming its seasonal climb.
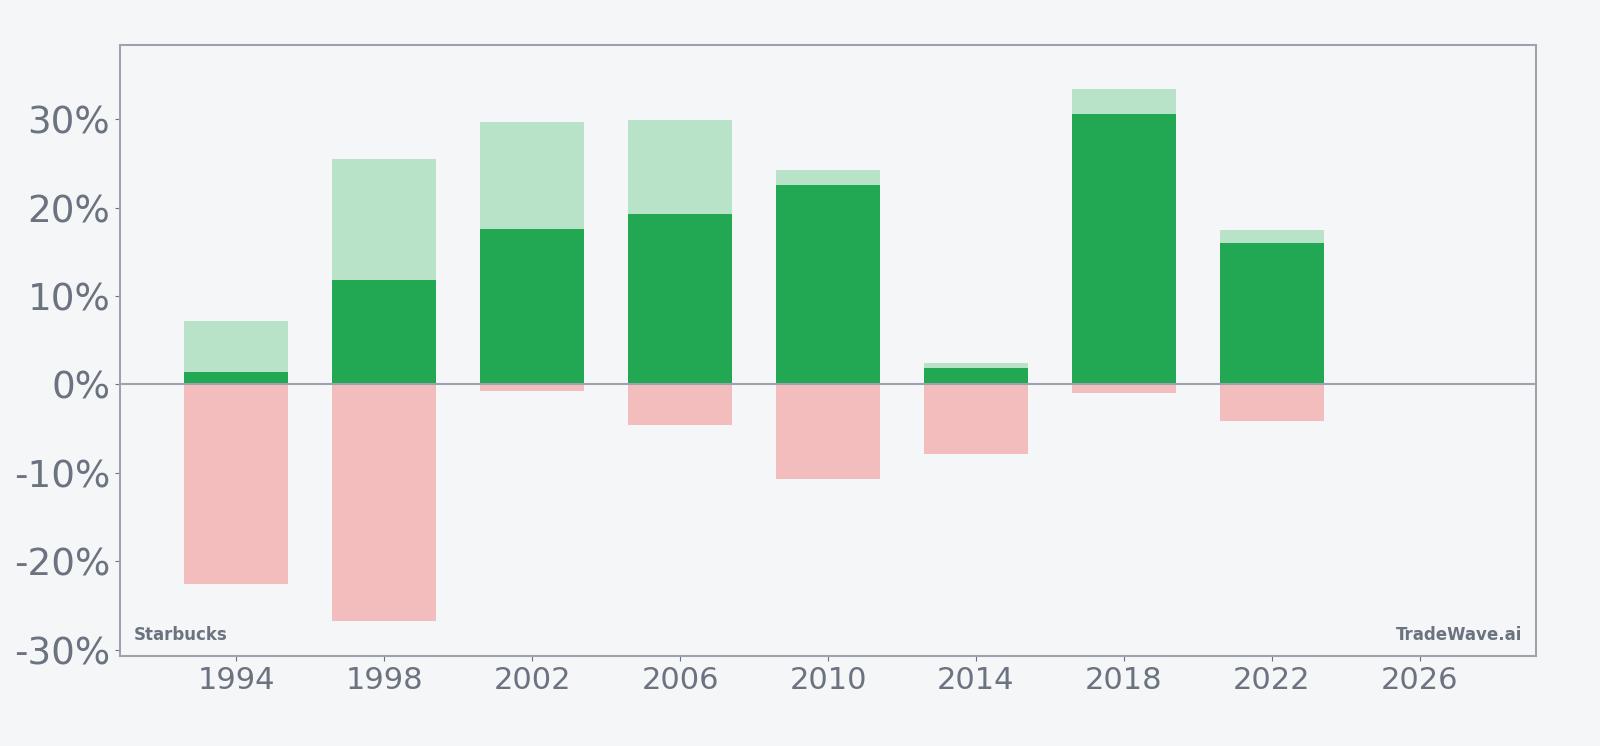
The combination of strong net gains and sizable intraperiod swings is what makes this Starbucks seasonal pattern stand out. The TradeWave Ratio of 1.78 indicates that price has typically traveled meaningfully in the trade direction within the window, while the Sharpe ratio of 1.4 reflects a favorable risk-adjusted profile based on end-of-window outcomes. Add it up: eight for eight, mid-teens average gains, and a track record of rewarding patience through volatility.
History does not guarantee future results; even in a perfect win streak like this, adverse excursions can be large and uncomfortable before the window closes.
Why does Starbucks (SBUX) follow this seasonal pattern?
One likely driver is the way Starbucks’ fiscal calendar and investor focus line up with the midterm-to-pre-election phase, when policy noise often fades and consumer spending visibility improves. Analysts have pointed to the company’s heavy exposure to holiday traffic, loyalty promotions, and new product launches in the back half of the year, which can concentrate optimism into this stretch. The pattern may also reflect institutional portfolio repositioning into consumer and restaurant names as earnings revisions stabilize and macro fears ease late in the midterm cycle.
What is driving Starbucks (SBUX) today?
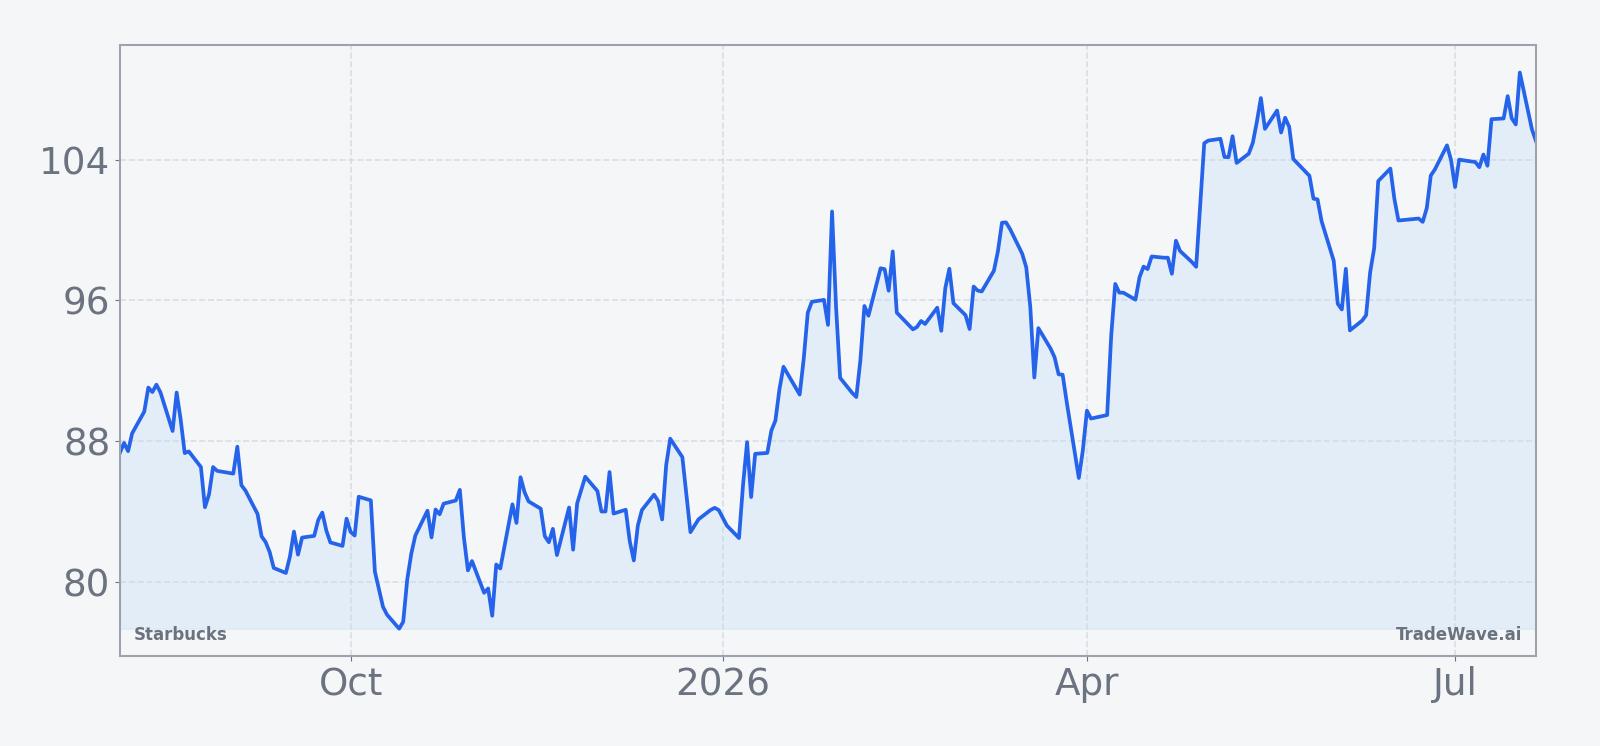
Starbucks closed Wednesday at $104.45, down 0.36 on the day, with about 5.86 million shares changing hands versus a 20-day average volume of roughly 7.02 million. The stock sits just above its 50-day moving average of $102.56 and about 4.4% below its 52-week high of $109.23, leaving it in a constructive uptrend after a strong spring rally.
In April 2026, Starbucks reported adjusted earnings of $0.50 per share on $9.5 billion in revenue for its fiscal second quarter, topping Wall Street estimates and showing 6.2% global same-store sales growth.[2] Management raised full-year adjusted EPS guidance to a range of $2.25 to $2.45 and lifted its outlook for global and U.S. comparable store sales growth to more than 5%, citing momentum from its turnaround strategy and investments in staffing and operations.[2][3]
That earnings beat and guidance hike triggered a more than 5% jump in after-hours trading on Apr 28, 2026, as investors responded to signs that traffic and ticket growth were improving alongside service metrics.[2][3] The company has also outlined expanded tipping options and annual bonuses for baristas and managers as part of its labor investment push, a move aimed at stabilizing the workforce and supporting throughput in busy stores.[2]
On the macro side, Starbucks has flagged some relief from import tariffs and elevated coffee prices in the second half of the fiscal year, which could ease cost pressures that have weighed on margins in prior periods.[3] At the same time, the broader restaurant and retail complex has been showing signs of recovery, with Starbucks’ improving traffic and same-store sales seen as a bellwether for discretionary consumer spending in food and beverage.[1]
The chart below situates the latest move in its recent multi-month context, alongside a short-term seasonal projection.
What should traders watch as the August seasonal window approaches?
With the next 108-day Starbucks seasonal window set to open on Aug 5, the first watchpoint is whether SBUX can hold above its 50-day moving average and push back toward the $109 area as the window begins. A firm base in the low $100s would echo prior midterm cycles where the stock entered the window from a position of strength and then built on those gains.
Second, the historical pattern suggests traders should be prepared for volatility inside the window even if the longer-term seasonal trend is positive. Intraperiod drawdowns of 10% to 20% have been common in past midterm years before the stock ultimately finished higher, so how SBUX behaves on sharp pullbacks will be a key tell. A shallow, well-bid dip would be more consistent with the stronger years in the sample, while a deeper and earlier slide would look more like the 1994 and 1998 paths that still recovered but tested patience.
Third, the policy and macro calendar into late 2026 matters for this election-cycle pattern. Any shifts in rate expectations, consumer confidence, or trade policy that affect import costs and discretionary spending could either reinforce or blunt the historical midterm-to-pre-election tailwind for consumer stocks. For Starbucks specifically, updates on traffic, pricing, and cost relief in upcoming management commentary will help investors judge whether the fundamental backdrop still lines up with the bullish seasonal script.[1][3]
Finally, behavior inside the window will either confirm or challenge the eight-for-eight record. If Starbucks again shows a tendency to grind higher through autumn, with rallies clustering around earnings and holiday positioning, it would extend one of the cleaner midterm-year seasonal trends in the consumer space. A flat or negative outcome, by contrast, would mark the first break in this pattern and signal that the current macro and competitive environment has started to overpower the historical SBUX seasonal trend.
Sources
About this seasonal analysis
Seasonal pattern data is sourced from TradeWave.ai, which analyzes historical price behavior across annual calendar windows going back up to 30 years. Read the full data methodology or the book The 100-Year Pattern by Afshin Moshrefi (2026 edition). Past performance of seasonal patterns does not guarantee future results. This article is for informational purposes only and does not constitute investment advice.