Johnson & Johnson (JNJ) Has Risen in 10 of 10 Late-Midterm Windows, Averaging 6.6% Gains
Johnson & Johnson is approaching a 57-day late-midterm seasonal window that has never produced a loss in the last 10 cycles, just as shares trade near record highs and litigation and oncology growth shape the healthcare giant’s setup.
Price as of Sep 16, 2026: $267.28 (last close).

What is the seasonal pattern for Johnson & Johnson (JNJ)?
Johnson & Johnson has risen in 10 of 10 midterm-year Sep 23–Nov 18 windows, with an average gain of 6.6% in winning years.
- 10 for 10 in this window, with Johnson & Johnson averaging 6.6% gains across all winning years.
- Seasonal window runs from Sep 23 through Nov 18 in midterm election years, spanning 57 calendar days.
- Percent Profitable is 100.0%, with 10 winners and 0 losers in the historical sample.
- Avg Profit of 6.6% reflects the typical move in winning years, with no losing years in the dataset.
- TradeWave Ratio of 1.82 indicates price has typically traveled meaningfully in the long direction within the window.
- Sharpe ratio of 1.64 points to a historically favorable risk-adjusted profile for this JNJ seasonal trend.
According to historical data from TradeWave.ai, this late-midterm stretch for Johnson & Johnson behaves very differently from an average autumn in the stock. TradeWave.ai’s seasonal database flags the upcoming Sep 23 to Nov 18 window as one of the most consistently positive slices of the calendar for JNJ.
How has Johnson & Johnson (JNJ) traded in the late-midterm autumn window?
Johnson & Johnson has closed higher in every single Sep 23 to Nov 18 window across the last 10 midterm election years, averaging a 6.6% gain for long positions. Shares finished Thursday at 267.28, up fractionally on the day and about 4.9% below their 52-week high of 281.07, after climbing roughly 17% year to date. Multiple insider transactions, including executive sales reported in mid-August, show active profit-taking and portfolio reshuffling around these levels, a backdrop that can matter when a historically strong seasonal window is about to open.[5]
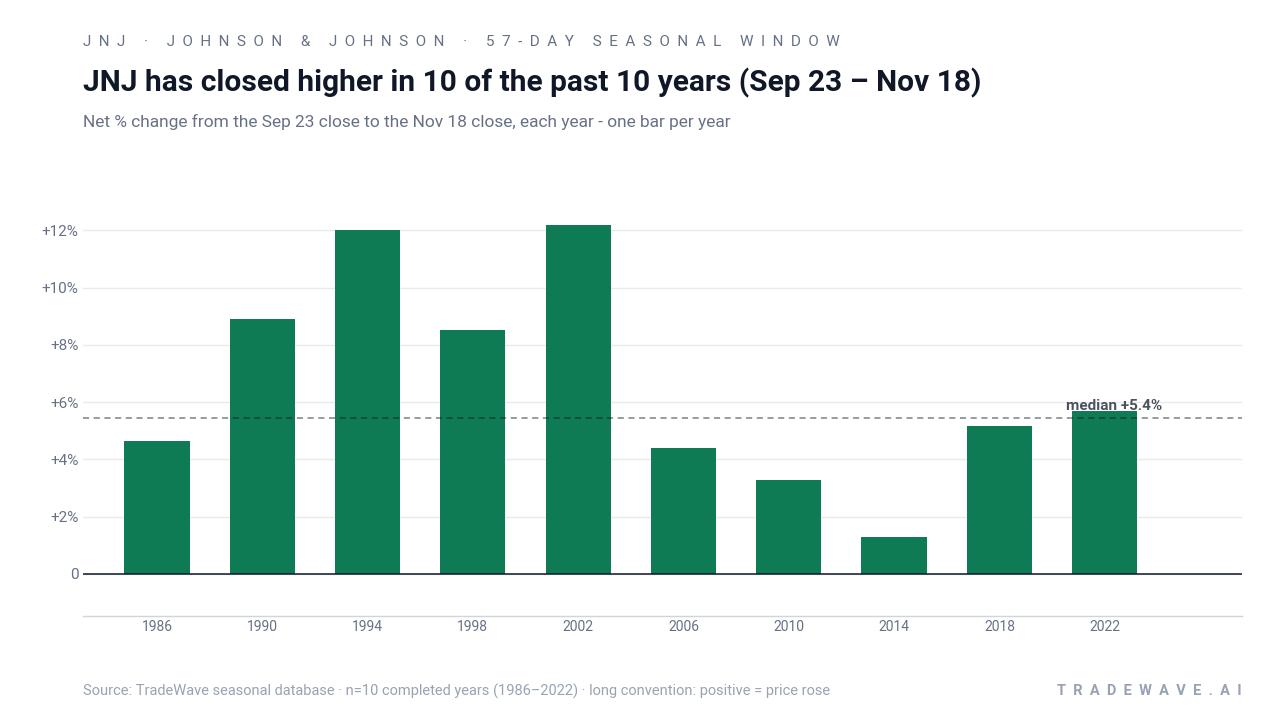
Because this pattern is grouped by the presidential election cycle, it only looks at the last 10 midterm election years, not 10 consecutive calendar years. That matters in healthcare, where policy risk, reimbursement debates and drug-pricing rhetoric tend to flare in mid-cycle years as Washington tests themes that often carry into the year before the presidential election.
Historically, the trade direction for this JNJ seasonal trend has been firmly long. Percent Profitable sits at 100.0%, with 10 winners and 0 losers, and the average profit of 6.6% means the typical midterm-year autumn window has delivered a mid-single-digit to low-double-digit gain for shareholders who were long across the full 57 days. The median profit of 5.43% is slightly lower than the average, which hints at a few stronger years pulling the mean higher but still leaves the “typical” outcome solidly positive.
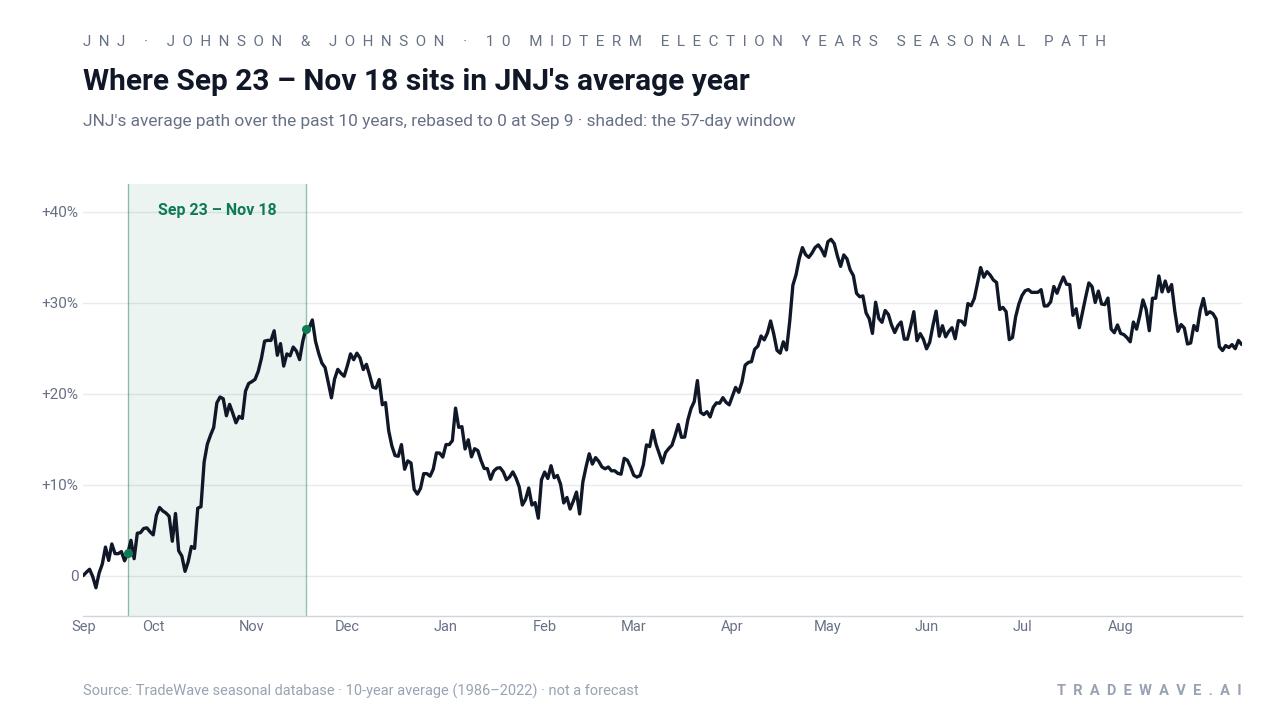
The historical seasonal average path suggests gains tend to build steadily rather than in a single spike. In several years, the strongest part of the move has come in the middle of the window, after an early consolidation, which fits a pattern where investors digest third-quarter updates and position for year-end healthcare flows.
A closer look at yearly ranges shows how much JNJ has typically swung inside the window before finishing higher.
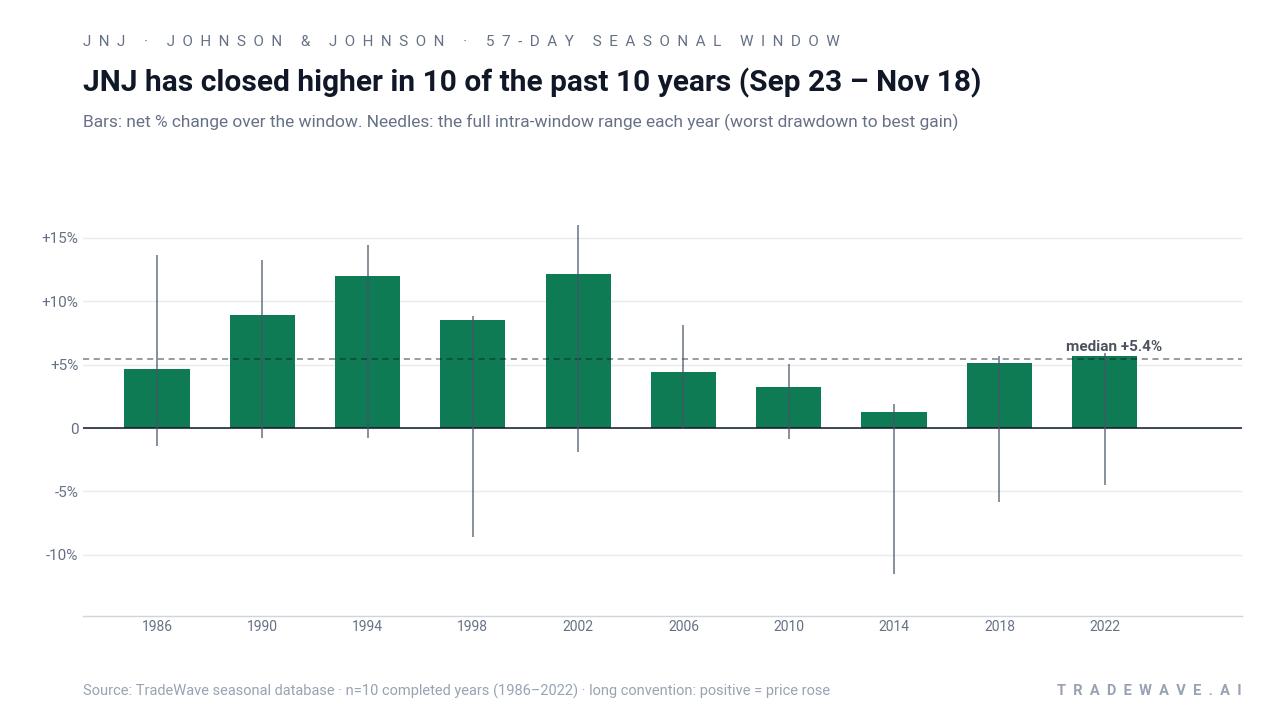
The per-year profile shows that even in winning years, JNJ has not moved in a straight line. Maximum favorable moves have reached into the mid-teens in some cycles, such as 1994 and 2002, while maximum adverse moves have occasionally been deep, including an intraperiod drawdown of about 11.5% in 2014 before the stock still finished the window higher. That combination of sizable best-case and worst-case excursions is consistent with a TradeWave Ratio of 1.82, which signals that price has typically traveled a meaningful distance in the long direction within the window, even if the final close did not capture the full swing.
The cumulative return chart for this JNJ seasonal window compounds to 88.51% across the 10 midterm-year samples, a sign that the pattern has not been driven by a single outlier year. Add it up: stacking this 57-day slice across the last 10 midterm election years would have produced nearly a doubling of capital tied to this specific calendar trade, before costs and taxes.
History does not guarantee future results; adverse excursions (MAE) can be large even in winning windows.
Why does Johnson & Johnson (JNJ) follow this seasonal pattern?
One likely driver is the way healthcare and pharmaceutical policy debates cluster in the back half of midterm election years, when Congress and regulators often signal where drug-pricing and reimbursement policy may head into the year before the presidential election. Analysts have also pointed to the timing of JNJ’s earnings calendar and guidance updates, which can prompt portfolio managers to add or trim exposure as they lock in year-end positioning for defensive growth sectors. This JNJ seasonal trend may reflect that mix of policy noise, earnings clarity and institutional rebalancing that tends to favor large-cap healthcare in late autumn of midterm cycles.
What is driving Johnson & Johnson (JNJ) today?
Johnson & Johnson ended the prior session at 267.28, edging up 0.03% on light volume and sitting about 4.9% below its 52-week high of 281.07, with the stock up roughly 17% so far in 2026. The move caps a year in which oncology blockbusters and autoimmune drugs have powered revenue growth, while talc litigation and drug-pricing scrutiny remain overhangs that investors continue to monitor in the background.[1][2][3][4] Fresh data on insider activity show a mix of executive sales and other transactions through mid-2026, suggesting some insiders are monetizing gains after the stock’s strong run.[5] Short interest, meanwhile, has eased from late-2025 levels into early 2026, with a reported 19,562,840 shares short as of Jan 30 and an 8.3% decline versus the prior reading, indicating that bearish positioning has been trimming back rather than building.[6]
The chart below situates the latest move against JNJ’s past year of trading and a historical seasonal projection for the next two months.
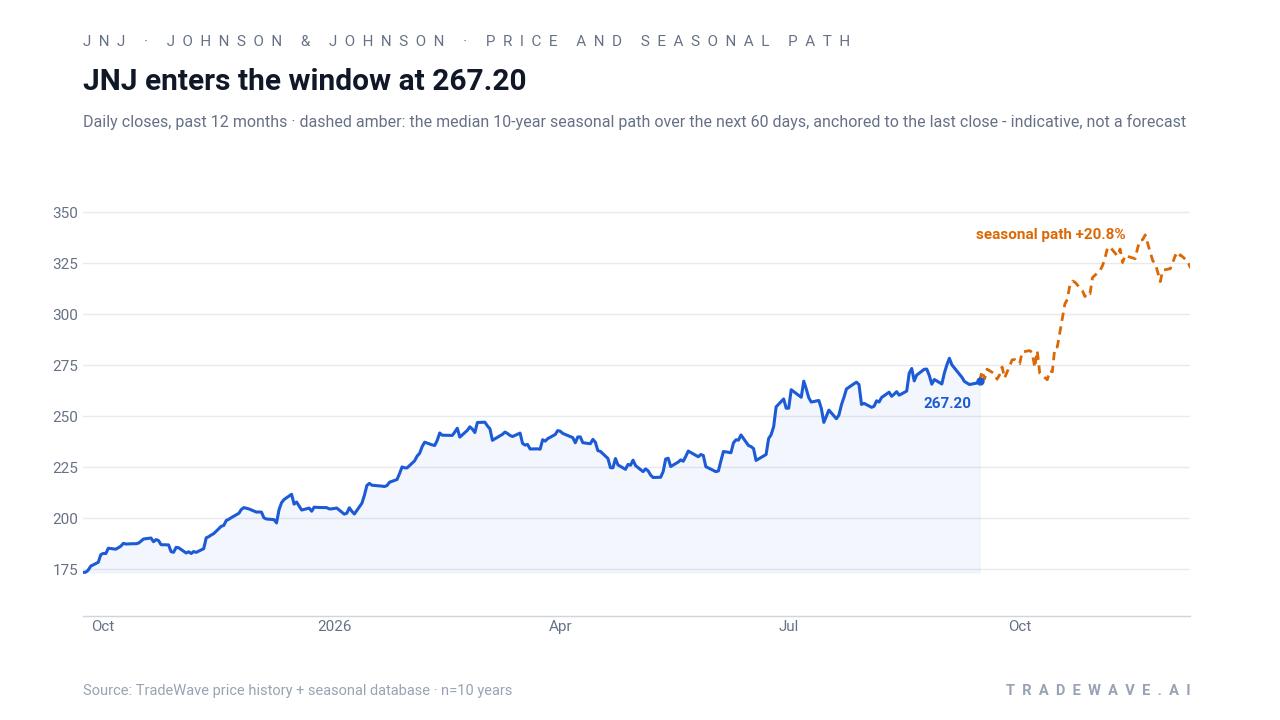
From a sector standpoint, JNJ sits at the intersection of big pharma and medical technology, where strong oncology and autoimmune drug sales and a MedTech rebound have been key growth drivers in 2026.[2][4] In January 2026, the company forecast full-year 2026 operational sales and earnings per share above Wall Street estimates, even as it acknowledged hundreds of millions of dollars in settlement impacts tied to litigation, underscoring the balance between growth and legal risk that investors are weighing.[1][4] In February 2026, analysis highlighted 63% growth in Carvykti and robust demand for other oncology therapies, reinforcing the narrative that JNJ’s drug pipeline is offsetting headwinds from older products and legal issues.[2]
Legal risk has not disappeared. In January 2026, a court-appointed special master recommended allowing expert testimony linking talc products to ovarian cancer, a development that analysts said could pressure the stock by keeping litigation in focus.[1][3] For a defensive bellwether like JNJ, that mix of strong fundamentals and persistent legal uncertainty is part of what makes the upcoming seasonal window important: it offers a historical lens on how the stock has tended to trade when macro and company-specific narratives pull in opposite directions.
What should traders watch in this JNJ seasonal window?
As the Sep 23 to Nov 18 window opens, the first thing to watch is whether JNJ respects the historical pattern of grinding higher through the middle of the window rather than spiking early. Price action around the 52-week high near 281 will be important: a sustained push through that level during the window would align with the long-biased historical seasonality, while a failure there accompanied by deeper pullbacks would mark a clear break from the 10-for-10 record.
Second, monitor how insider activity evolves as the window progresses. If executive and insider selling accelerates while the stock pushes toward or through record highs, that could signal growing caution even in a historically strong stretch.[5] Conversely, a slowdown in sales or any notable insider buying would suggest more confidence that the current healthcare and litigation backdrop can support higher prices into year-end.
Third, keep an eye on short interest and options positioning around key catalysts such as any litigation headlines or updates on oncology and autoimmune drug performance. Continued declines in short interest from the Jan 30 baseline would indicate that skeptics are backing away as the seasonal window unfolds, while a renewed build in short positions would show traders leaning against the historical pattern.[6] Finally, behavior in this window will help set the tone for the transition from the concluding midterm election year into the year before the presidential election, a phase that has often been friendlier to risk assets and large-cap healthcare when policy uncertainty begins to clear.
Sources
- Reuters - Johnson & Johnson forecasts 2026 profit above Wall Street estimates - Reuters
- Forbes - Does JNJ Stock Still Offer Value?
- Forbes - Johnson & Johnson Stock To $134?
- The Wall Street Journal - J&J’s Sales and Profit Rise on Strong Cancer and Autoimmune Drug Sales
- MarketBeat - Johnson & Johnson (JNJ) Insider Trading Activity 2026
- MarketBeat - Johnson & Johnson (JNJ) Short Interest & Short Float | Updated Sep 2026
About this seasonal analysis
Seasonal pattern data is sourced from TradeWave.ai, which analyzes historical price behavior across annual calendar windows going back up to 30 years. Read the full data methodology or the book The 100-Year Pattern by Afshin Moshrefi (2026 edition). Past performance of seasonal patterns does not guarantee future results. This article is for informational purposes only and does not constitute investment advice.