Gold (COMEX) (GC) Has Rallied in 6 of 6 Late-Midterm Windows, Averaging 8.73% Gains
Gold (COMEX) is stepping into a historically strong 125-day seasonal window just as futures hover near record levels and macro drivers for bullion stay in flux.
Price as of Sep 14, 2026: $4,379.50 (intraday).

What is the seasonal pattern for Gold (COMEX) (GC)?
Gold (COMEX) has risen in 6 of 6 late-midterm election year windows from Sep 14 to Jan 16, with an average gain of 8.73% in winning years.
- 6 for 6 in this window, with Gold (COMEX) averaging 8.73% gains in winning years across the last six midterm election cycles.
- The 125-day Gold (COMEX) trading window runs from Sep 14 to Jan 16 and has been consistently bullish in this election-cycle phase.
- Percent Profitable is 100%, with 6 winners and 0 losers across the historical sample.
- Median profit in the window is 7.95%, pointing to a typical single-digit gain even before outlier years.
- The TradeWave Ratio of 2.42 suggests price has often traveled meaningfully in the trade direction within the window, beyond just the final close.
- A Sharpe ratio of 2.13 for this window signals historically strong risk-adjusted returns, though adverse swings have still occurred inside the range.
According to historical data from TradeWave.ai, this late-midterm stretch has behaved very differently from an average quarter for gold. The next section walks through how that pattern has played out in prior cycles and what it means for the current setup.
How has Gold (COMEX) (GC) traded in this late-midterm seasonal window?
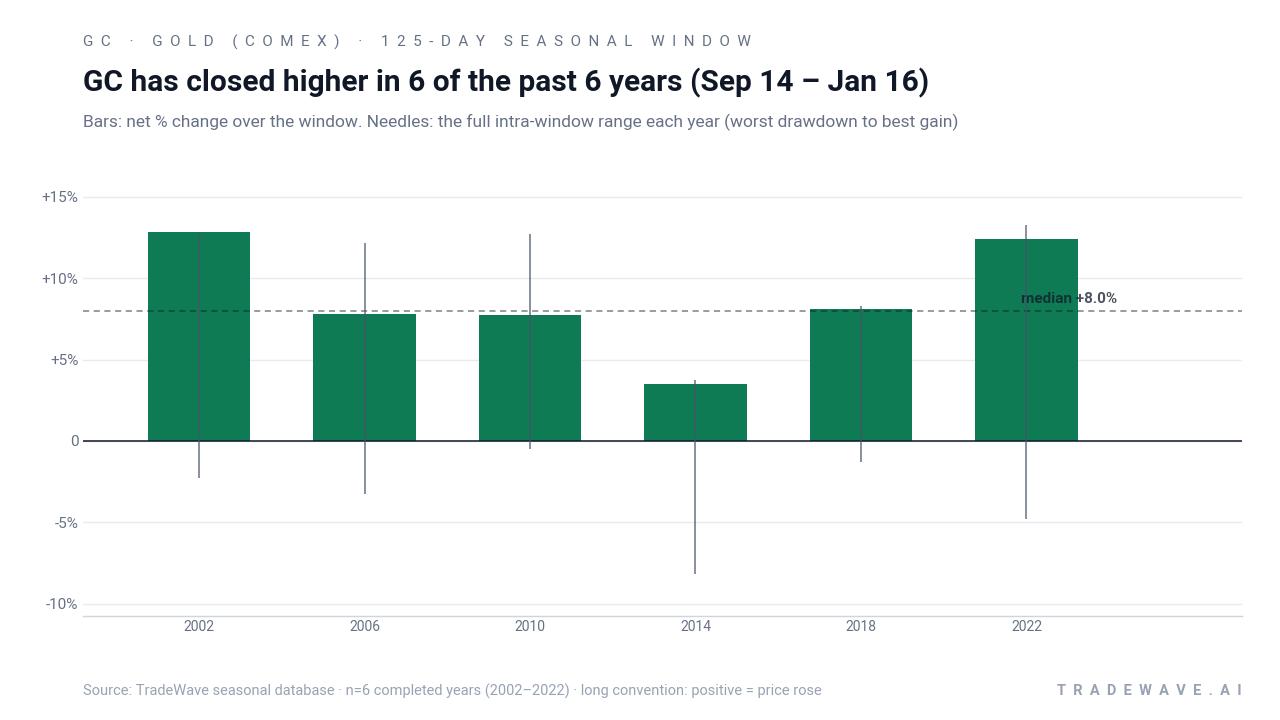
Gold (COMEX) has finished higher in every single Sep 14 to Jan 16 window across the last six midterm election years, averaging an 8.73% gain for long positions. Futures are entering this regime around 4,381.40, up 0.35% on the day and roughly 1.33% higher year to date, after a volatile year that has seen prices swing between about 3,725 and 5,586.[1][2]
The pattern is grouped by the presidential election cycle, focusing on the last six midterm election years rather than consecutive calendar years. That matters because fiscal debates, regulatory shifts and central-bank signaling often cluster differently in midterm years than in election or pre-election years, and gold has tended to respond to those policy rhythms.
Across those six midterm cycles, every Sep 14 to Jan 16 window has been profitable for a long Gold (COMEX) stance. The median gain of 7.95% sits close to the average, which suggests the wins have been relatively consistent rather than driven by a single outlier year.
Individual years still show a wide range of paths. In 2002, the contract gained 12.8% over the window, with the best intraperiod rally matching that full move and a worst drawdown of about 2.3% from entry. In 2014, by contrast, the net gain was a modest 3.51%, but the worst drawdown inside the window reached roughly 8.15%, underscoring that even “winning” years have contained sharp air pockets.
The maximum favorable excursions have often been larger than the final closes. In 2006, for example, gold finished the window up 7.82% but at one point had rallied more than 12% from the starting level. That gap between peak and finish is what the TradeWave Ratio of 2.42 is flagging: historically, price has tended to travel meaningfully in the trade direction within the window, even if some of that move is given back before Jan 16.
Drawdowns have varied by cycle. The worst intraperiod declines have ranged from less than 1% in 2010 to more than 8% in 2014, with several years showing 3% to 5% pullbacks before the trend reasserted higher. For traders, that MAE profile means the window has not been a straight line, even though the end results have all been positive.
The combined net, best-case and worst-case moves by year show how upside and downside have coexisted inside this bullish window.
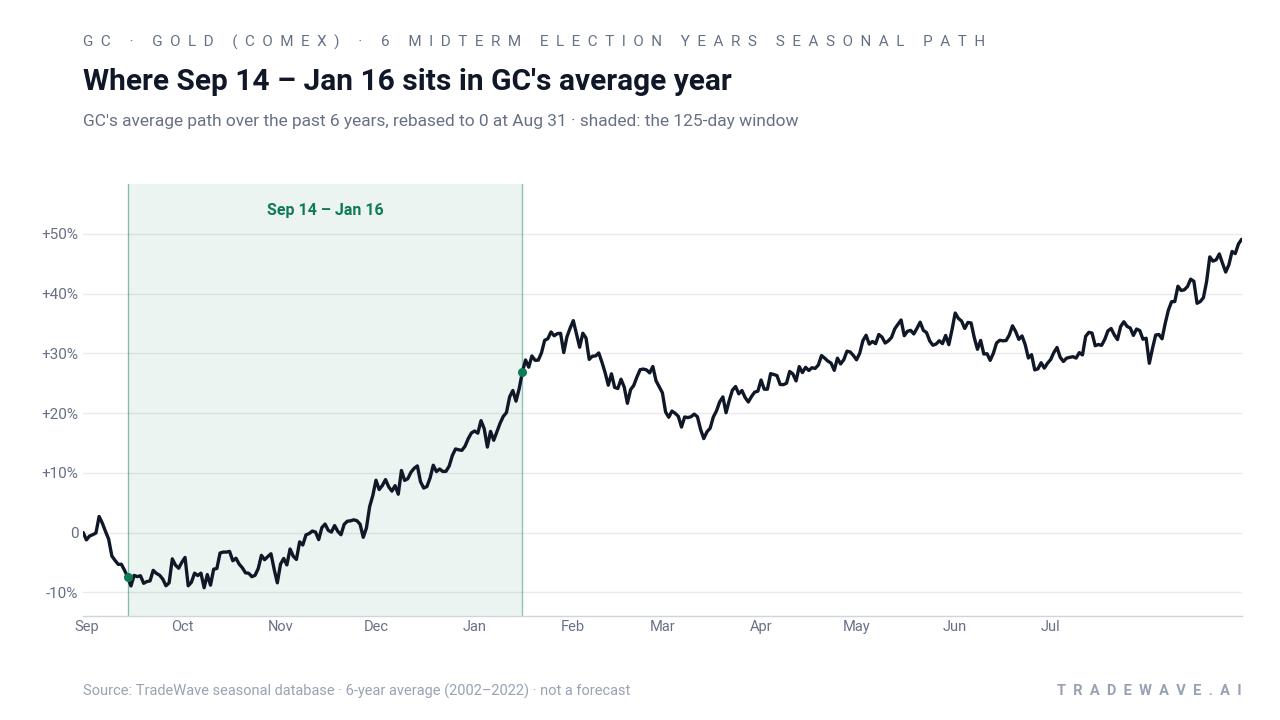
The cumulative view is striking. Stacking this 125-day Gold (COMEX) trading window across the six midterm years compounds to roughly 64% total return, with no losing entries in the sample. Add it up: six cycles, six wins, and a steady climb when this specific slice of the calendar has rolled around.
History does not guarantee future results; adverse excursions can still be large inside the window even when the final outcome is positive.
Why does Gold (COMEX) (GC) follow this seasonal pattern?
One likely driver is the way policy and liquidity line up in the late part of midterm election years. Analysts have pointed to a mix of year-end portfolio rebalancing, shifting expectations for the following pre-election year and recurring bouts of macro uncertainty that tend to support demand for hedges like gold.[5] This window may also capture seasonal physical demand from key buyers alongside options and futures positioning that often builds into year-end, amplifying moves once they start.[5]
What is driving Gold (COMEX) (GC) today?
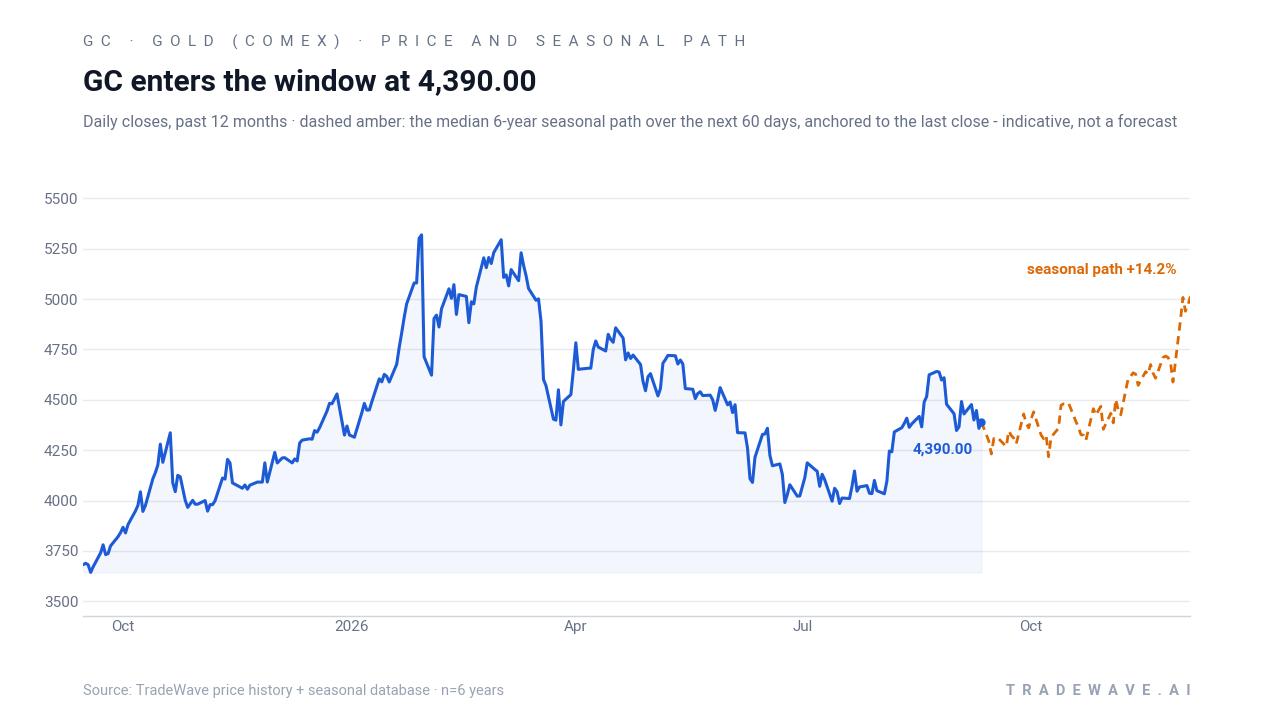
Gold (COMEX) futures settled around 4,381.40 in the prior session, up 0.35% on the day, leaving the contract modestly positive for 2026 and still well below its 52-week high near 5,586 even after a strong summer run.[1][2] The move comes after an August stretch where a weaker U.S. dollar, reduced conviction about further Federal Reserve hikes and a bullish technical breakout pushed bullion to a three-month high, with one week delivering more than a 5% gain and the biggest single-day rise since early February.[5] At the same time, a large August options roll in the GLD ETF, where an investor sold 116,000 deep-in-the-money 420 calls to buy 430 calls, was read as a sign of still-bullish but less aggressive positioning into major macro events.[6]
Macro drivers remain familiar. When the dollar has softened and Treasury yields have eased, gold has tended to catch a bid, while firmer U.S. currency and higher real yields have weighed on the metal.[5] Geopolitical headlines have also mattered: in Mar 2026, for example, prospects of a ceasefire in the Middle East coincided with a pullback in gold as some safe-haven demand faded and traders refocused on interest-rate risk.[4] Physical demand has been uneven, with higher prices deterring some Indian buyers even as Chinese demand held up, leaving futures to lean more heavily on macro and positioning flows for direction.[5]
The chart below situates the latest move in its recent multi-month context alongside a historical seasonal projection.
What should traders watch in this Gold (COMEX) seasonal window?
For this Sep 14 to Jan 16 stretch, the first watchpoint is whether gold respects the historical pattern of grinding higher despite mid-window volatility. In prior midterm cycles, even years with early drawdowns of 3% to 8% from entry ultimately finished positive, so the behavior of any pullbacks in the coming weeks will be a key tell.
Second, the policy calendar matters. Markets are heading from the concluding midterm election year into the pre-election year, a phase that has often brought shifting expectations for fiscal policy, regulation and central-bank tolerance for volatility. If the dollar softens again or rate-hike expectations fade, that would rhyme with the backdrop that supported August’s three-month high and could help the GC seasonal trend reassert itself.[5]
Third, options and positioning deserve close attention. The August GLD options roll suggested a still-bullish but more cautious stance from at least one large player; if call demand rebuilds or speculative futures length expands into year-end, it would signal renewed conviction behind any seasonal upswing.[5][6] Conversely, a continued shift toward lighter or more defensive positioning would argue that traders are less willing to lean into the historical pattern this time.
Finally, watch how gold trades around any spikes in geopolitical risk or surprise data on inflation and growth. In past cycles, those shocks have often provided the spark that turns a quiet seasonal bias into a more forceful move, and the historical MFE and MAE profile shows that when this window moves, it can move quickly in both directions.
Sources
- MarketWatch - Gold Continuous Contract Price Data - GC00 - MarketWatch
- MarketWatch - GC00 | Gold Continuous Contract Overview
- MarketWatch - GCZ26 | Gold Dec 2026 Overview | MarketWatch
- CNBC - Gold falls as markets assess prospects of Iran ceasefire
- Reuters - Gold rallies to 3-month high on weaker dollar, bullish technicals
- CNBC - A massive trade just happened in gold. The options market is buzzing
About this seasonal analysis
Seasonal pattern data is sourced from TradeWave.ai, which analyzes historical price behavior across annual calendar windows going back up to 30 years. Read the full data methodology or the book The 100-Year Pattern by Afshin Moshrefi (2026 edition). Past performance of seasonal patterns does not guarantee future results. This article is for informational purposes only and does not constitute investment advice.