Near One-Year Lows, CBOE Volatility Index (VIX) Eyes Bullish Mid-September Election-Year Stretch
CBOE Volatility Index is lifting off one-year lows just as a historically bullish mid-September seasonal window approaches, putting fresh focus on how equity risk tends to behave late in midterm election years.
Price as of Sep 10, 2026: $17.84 (last close).
What is the seasonal pattern for CBOE Volatility Index (VIX)?
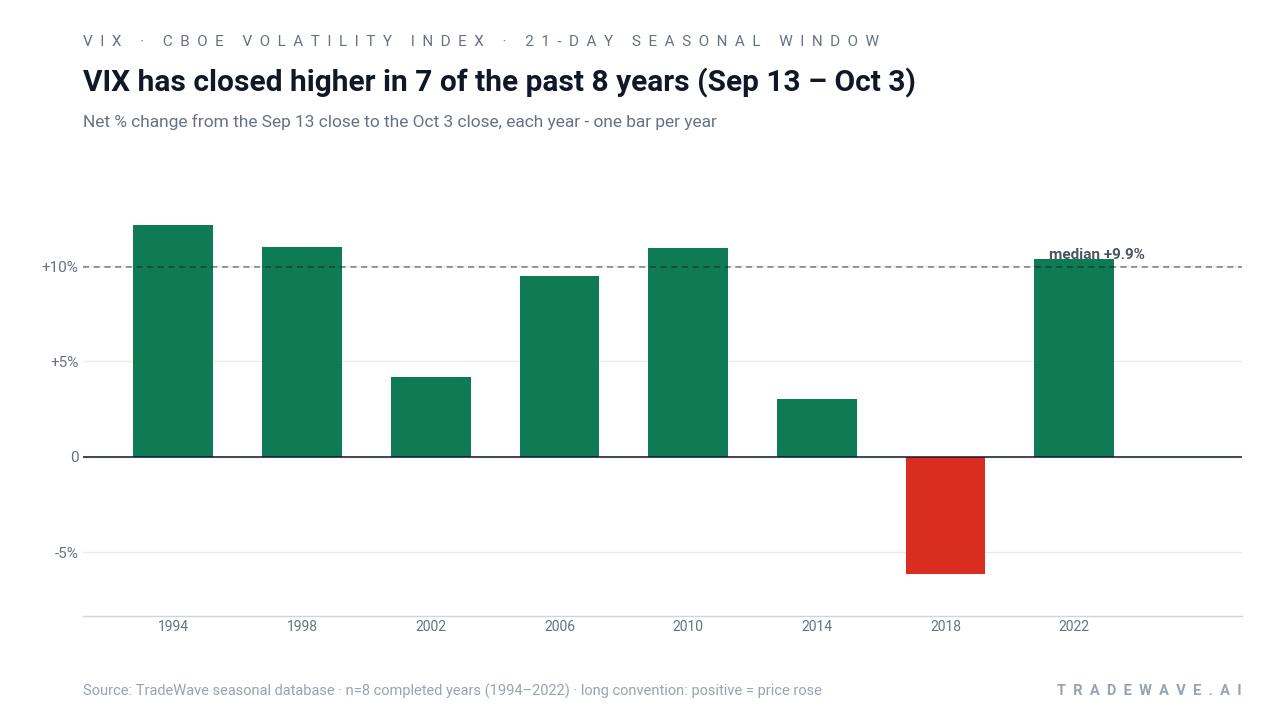
CBOE Volatility Index has risen in 7 of 8 years during the Sep 13 to Oct 3 midterm-year window, with an average gain of 8.73% in winning years.
- 7 for 8 in this window, with CBOE Volatility Index gaining an average 8.73% in winning years across the last 8 midterm election cycles.
- Percent Profitable sits at 88%, with 7 winners and just 1 loser in the Sep 13 to Oct 3 trading window.
- Including every year, Avg Profit - All is 7%, showing that the lone losing year has not erased the typical upside.
- The strongest years have seen maximum favorable moves of more than 25% within the 21-day stretch, while adverse swings have at times approached 18% in the wrong direction.
- The pattern is aligned with a long trade direction, meaning historically the window has favored higher VIX readings rather than continued volatility compression.
- Stacked across cycles, this specific mid-September window has compounded to a 68% cumulative gain, underscoring how concentrated VIX seasonality can be late in midterm election years.
According to historical data from TradeWave.ai, this late‑September stretch has behaved very differently from an average month on the volatility calendar, especially in midterm election years.
How has CBOE Volatility Index (VIX) traded in this late‑September window?
CBOE Volatility Index has closed higher in 7 of the past 8 midterm election years during the Sep 13 to Oct 3 window, making it one of the more reliable bullish stretches for implied equity volatility. The next iteration of that 21-day window begins on Sep 13, with VIX finishing the prior session at 17.84 after an 8.4% jump that left it well below its 52-week high of 35.3 but off the 13.38 low of the past year. That combination of a strong historical seasonality, a still-subdued level versus last year’s extremes, and a fresh uptick in volatility gives traders a clean focal point as the market moves deeper into the concluding midterm election year.
The presidential election cycle matters here because the data groups only midterm election years, and late in those years policy and positioning often shift as Washington moves from gridlock toward the spending and messaging phase that precedes the next campaign. Pattern phase and calendar phase are aligned: the analysis covers the last 8 midterm election years, and the market is currently wrapping up another midterm year before transitioning into the pre-election year, when risk appetite in equities has often improved.
Historically, the trade direction for this window is long, meaning the pattern has favored higher VIX levels rather than continued calm. Percent Profitable at 88% with 7 winners and 1 loser is unusually strong for a volatility index, where spikes are often brief and mean reversion is powerful. Average profit in the winning years is 8.73%, while the all-years average of 7% shows that even after including the one down year, the typical outcome has still been a meaningful rise in implied volatility.
The per-year breakdown shows how that plays out. In 1994, VIX gained 12.13% from entry to exit, with a best intraperiod run-up of 19.1% and a worst drawdown of 16.99%. In 2014, the net gain was a modest 3.05%, but the index swung between a 27.34% peak move higher and an 18.41% adverse move lower within the same 21-day span. The lone losing year, 2018, saw a 6.14% decline over the window, with a maximum favorable move of 11.16% and a maximum adverse move of 10.27%, underscoring that even “losing” years for the pattern have contained sizable swings.
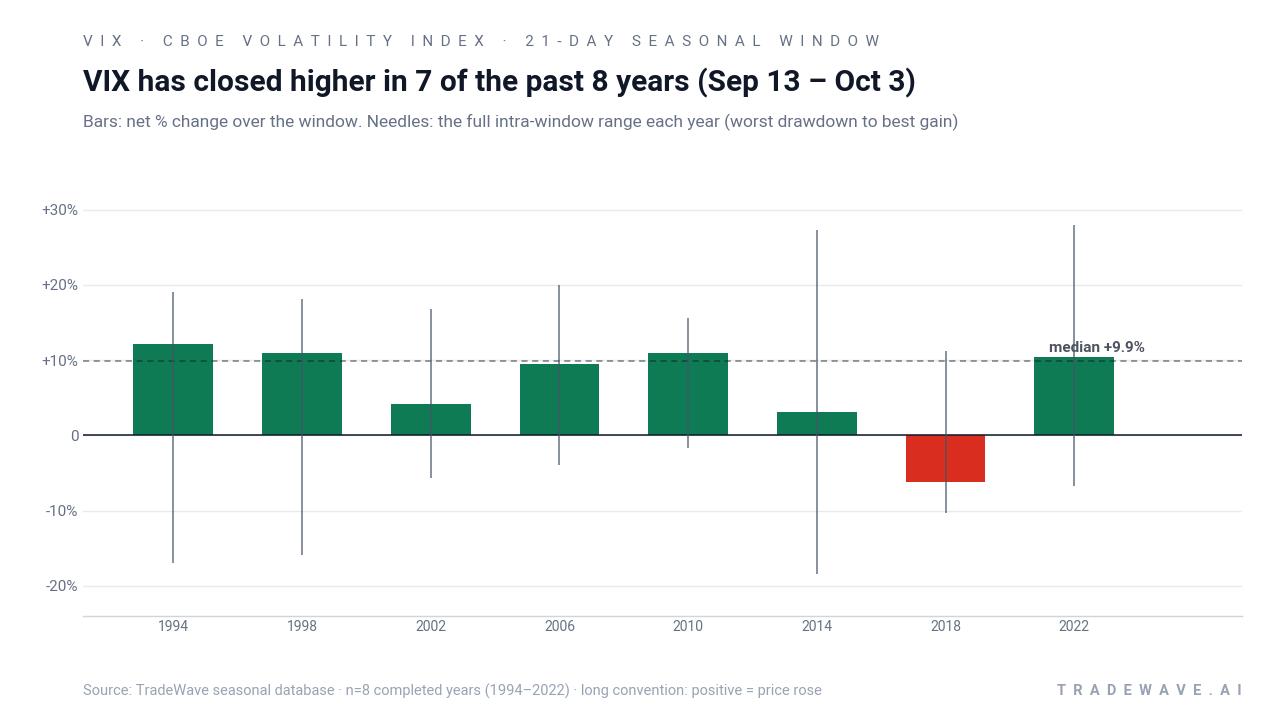
The maximum favorable excursion and maximum adverse excursion profile is what makes this window stand out. Several years show best-case intraperiod gains north of 15% while worst-case drawdowns have ranged from roughly 4% to nearly 18%. That mix points to a high-variance stretch where volatility itself tends to move sharply, which is consistent with the idea that late September in midterm years often coincides with macro and policy inflection points for equities.
A second view combines yearly net results with the full intraperiod range to show how far VIX has typically swung in both directions.
Stack the years together and the cumulative return line climbs to 68%, reflecting how this narrow slice of the calendar has repeatedly added to long-volatility exposure across cycles. The pattern is clear: this window has favored longs in 7 of 8 midterm election years, with average gains that are large enough to matter for anyone using VIX as a hedge or trading vehicle.
Why does CBOE Volatility Index (VIX) follow this seasonal pattern?
One likely driver is the way the policy and earnings calendar bunches up late in midterm election years, when Congress returns from recess, budget debates restart and companies begin guiding into year-end. Analysts have also pointed to institutional portfolio repositioning ahead of the pre-election year, which can involve adding hedges or trimming risk after a summer of low realized volatility. For VIX, which measures 30-day forward-looking equity volatility, that combination of policy noise and positioning shifts may help explain why this specific late-September window has so often produced higher readings.
History does not guarantee future results; adverse excursions (MAE) can be large even in winning windows.
What is driving CBOE Volatility Index (VIX) today?
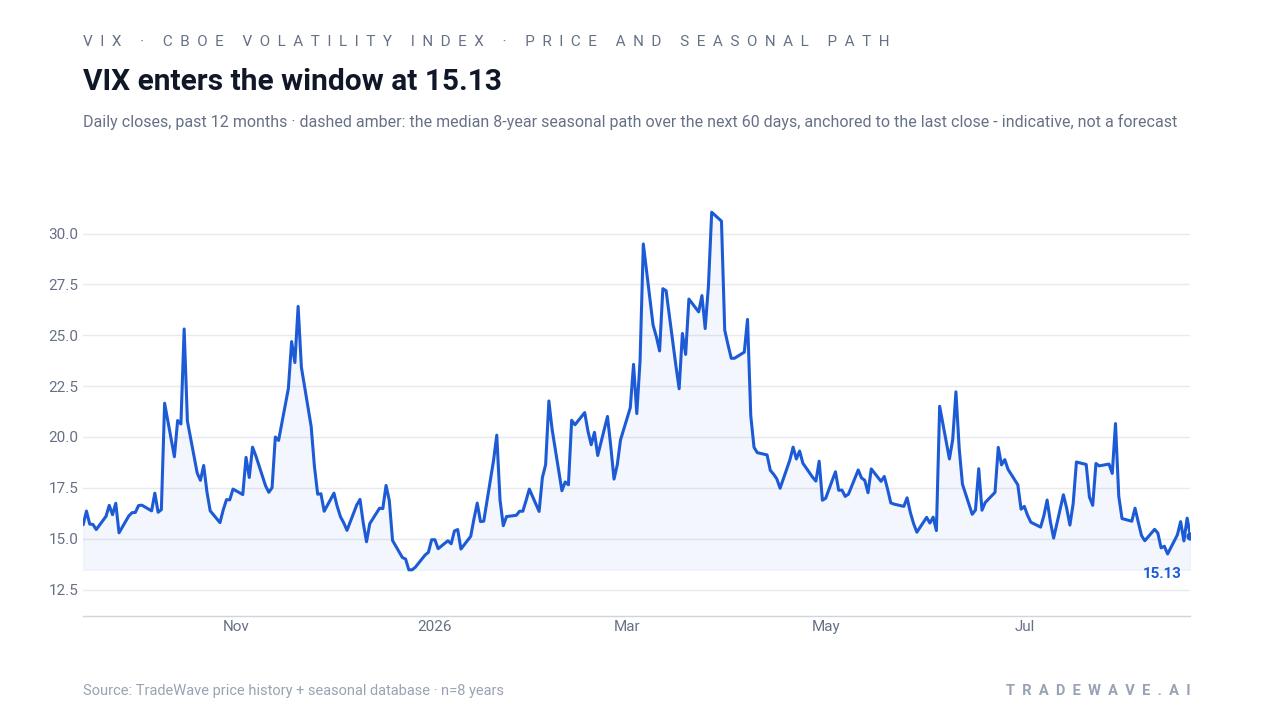
CBOE Volatility Index closed the prior session at 17.84, up 1.38 points or 8.4% on the day, after trading between 16.29 and 18.17. That move lifted VIX off the lower end of its 52-week range between 13.38 and 35.3, but it still sits far below the panic levels seen when equity markets have faced sharper stress in the past.[3] The latest uptick follows a stretch in late August when implied volatility across asset classes fell toward one-year lows after strong tech earnings and calming commentary from Federal Reserve officials at Jackson Hole, which had encouraged investors to lean back into risk and compress option premiums.[1]
VIX remains the leading gauge of 30-day forward-looking volatility for the U.S. equity market, and its behavior is closely watched alongside related products such as VIX futures and options.[1] Cboe has been extending that volatility toolkit, including a new bitcoin volatility index that applies the same VIX methodology to crypto options, underscoring how central this framework has become for pricing risk across markets.[2] In calm, well-supported equity environments, implied volatility tends to grind lower, but when stocks stumble or macro headlines surprise, VIX can spike quickly as investors rush to buy protection.
Under the surface, futures positioning shows active trading around the front part of the curve. Cboe data for the Sep 16, 2026 VIX futures contract (VX/U6) show settlement at 16.2669 with notable volume, while the Oct 21, 2026 contract (VX/V6) settled at 18.1384, leaving the curve modestly upward sloping.[1] That structure is consistent with a market that expects volatility to stay contained in the very near term but is willing to pay a bit more for protection further out the calendar, which lines up with the approaching seasonal window and a busy fall policy calendar.
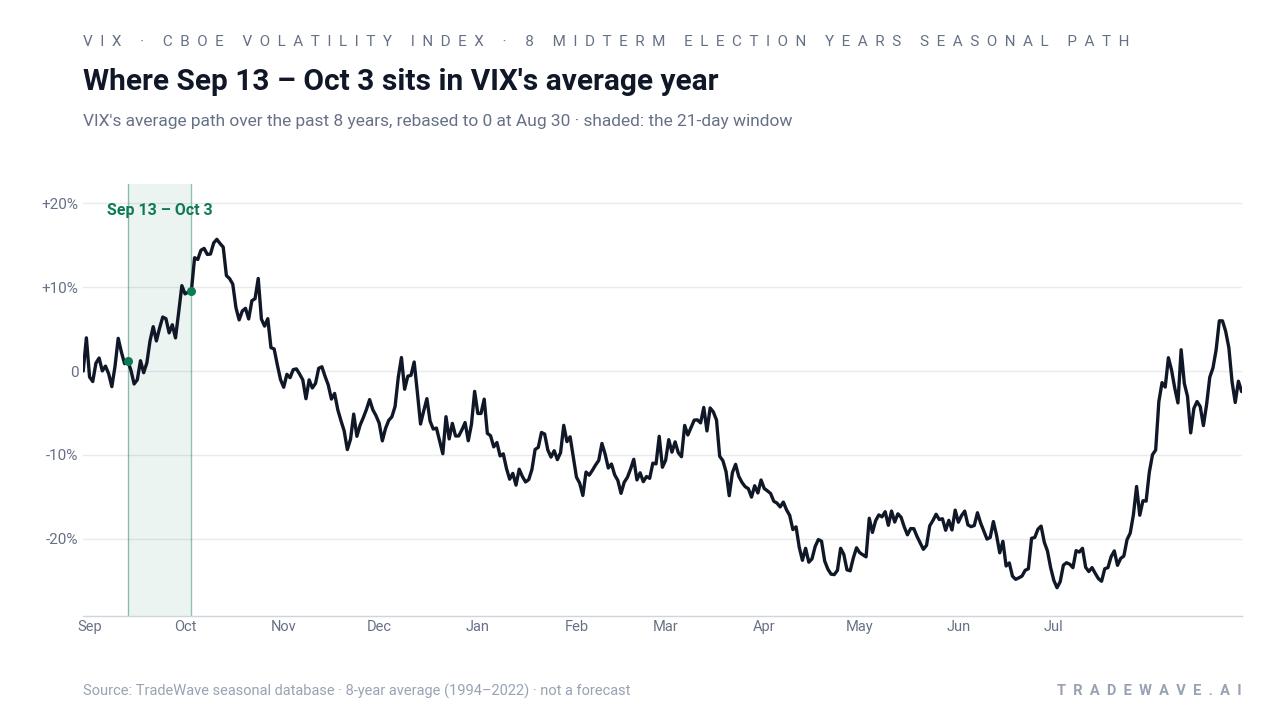
The chart below situates the latest move in its recent multi-month context and overlays the historical seasonal path for the next 60 days.
What should traders watch in this VIX seasonal window?
The first marker is how VIX behaves as the Sep 13 window opens: a quick move higher that lines up with the historical pattern would confirm that investors are again paying up for protection into late September and early October. Traders will also be watching the S&P 500’s reaction to incoming data and policy headlines; if equities stay firm while VIX still grinds higher, that would signal a hedging bid rather than outright risk-off selling.
Second, the VIX futures curve around the Sep and Oct expiries will be a key tell. A further steepening, with back-month contracts pulling away from the front, would suggest the market is bracing for more turbulence later in the fall, consistent with the historical seasonality. A flattening or inversion, by contrast, would indicate that any near-term spike is being faded quickly, which would run counter to the typical 21-day pattern.
Finally, traders should track how realized volatility in the underlying equity market responds. If daily index swings expand and stay elevated through the window, that would support the idea that this late‑midterm stretch is once again delivering a meaningful volatility regime shift. If realized volatility stays muted and VIX drifts back toward the low teens, it would mark a rare year in which the strong historical bias failed to assert itself, reminding investors that even robust seasonal patterns are tendencies, not rules.
Sources
About this seasonal analysis
Seasonal pattern data is sourced from TradeWave.ai, which analyzes historical price behavior across annual calendar windows going back up to 30 years. Read the full data methodology or the book The 100-Year Pattern by Afshin Moshrefi (2026 edition). Past performance of seasonal patterns does not guarantee future results. This article is for informational purposes only and does not constitute investment advice.