10-for-10 Midterm Streak: S&P 500 (SPX) Averages 18.9% Gains From Oct. 15 to Jul. 22
The S&P 500 is finishing a midterm election year near record territory as it approaches an Oct. 15 trading window that has historically delivered strong, low-failure gains into the following pre-election summer.

What is the seasonal pattern for S&P 500 (SPX)?
S&P 500 has risen in 10 of 10 midterm-year windows starting Oct. 15 and running 281 days, with an average gain of 18.9% in winning years.
- 10 for 10 in this window, averaging 18.9% gains in winning years across the last 10 midterm election cycles.
- Seasonal window runs from Oct. 15 through roughly Jul. 22, bridging the end of the midterm election year into the pre-election year.
- Percent Profitable is 100.0%, with 10 winners and 0 losers in the historical sample.
- Trade Direction is long, with a TradeWave Ratio of 2.07 and a Sharpe ratio of 2.03, pointing to strong risk-adjusted returns.
- Individual years have seen net gains ranging from 8.52% to 29.93%, with intraperiod drawdowns as deep as about 14.69% in weaker paths.
- Cumulatively, stacking this 281-day window across the 10 midterm cycles compounds to roughly 453.96% total return.
According to historical data from TradeWave.ai, this late-year stretch for the S&P 500 behaves very differently from an average calendar year. The next section steps through how that pattern has played out across past midterm election cycles.
How has S&P 500 (SPX) traded in the Oct. 15 to Jul. 22 midterm window?
The upcoming Oct. 15 to Jul. 22 window has never produced a losing outcome for the S&P 500 in the last 10 midterm election years, with every cycle closing higher and average gains of 18.9% for long exposure. The index sits at 7,585.73 as of the prior session’s close, about 3.0% below its 52-week high of 7,816.70 and up 10.81% year to date.[3] That combination of a strong year, modest pullback from records and a historically powerful midterm-to-pre-election seasonal regime is why this particular slice of the calendar is on traders’ radar.
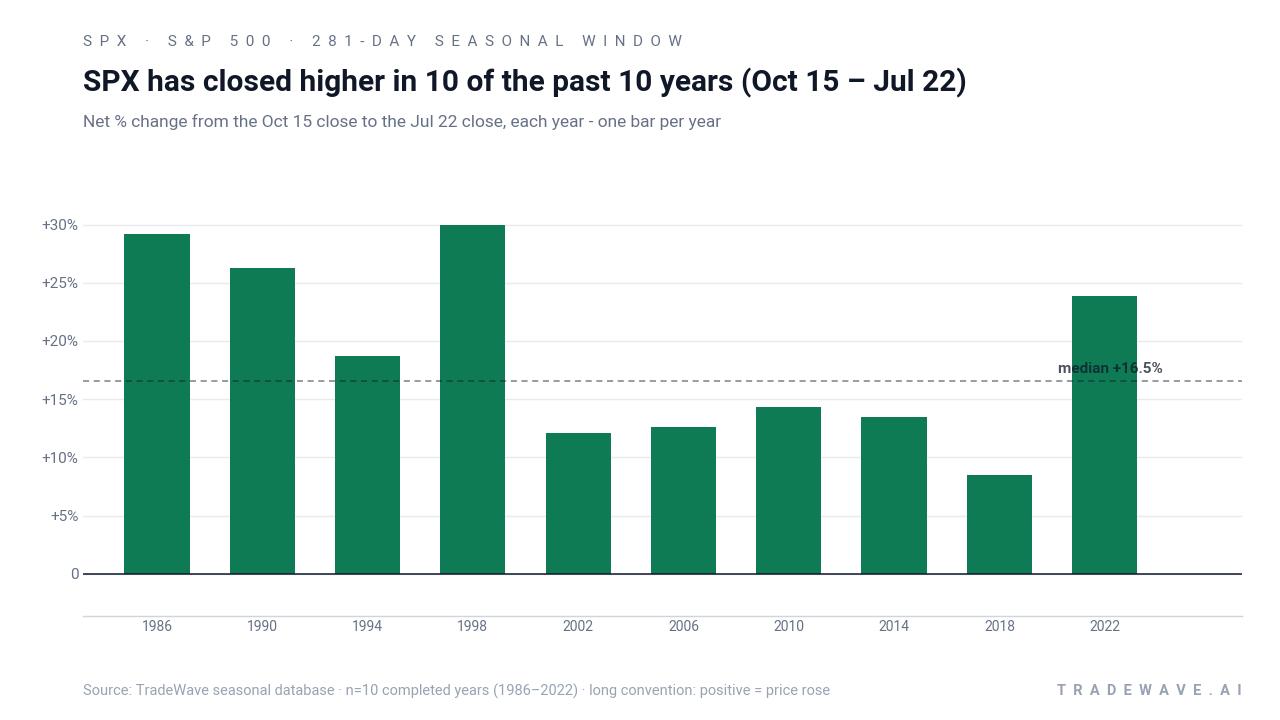
Grouping the data by the presidential election cycle matters here because this 281-day stretch straddles the handoff from the midterm election year into the year before the presidential election, a phase that has often coincided with friendlier policy tone and risk-on positioning. In this sample, the Trade Direction is explicitly long, and every one of the 10 midterm-year windows from 1986 through 2022 finished in the green, with net returns ranging from 8.52% in 2018 to 29.93% in 1998.
Average gains of 18.9% sit alongside a median profit of 16.52%, which tells you the typical outcome has been a mid-teens advance even after accounting for the bigger winners. The annualized return of 18.67% and a Sharpe ratio of 2.03 indicate that, historically, this has not just been a strong window in raw terms but also on a risk-adjusted basis, with returns meaningfully outpacing volatility.
Looking at individual years, 1998 stands out as the strongest path, with the S&P 500 rallying 29.93% from entry to exit and reaching a best intraperiod gain of 35.59% before the window closed. On the softer side, 2018 still finished up 8.52% but endured a worst drawdown of about 14.69% from the entry level at one point, a reminder that even “all green” windows can feel rough in the middle.
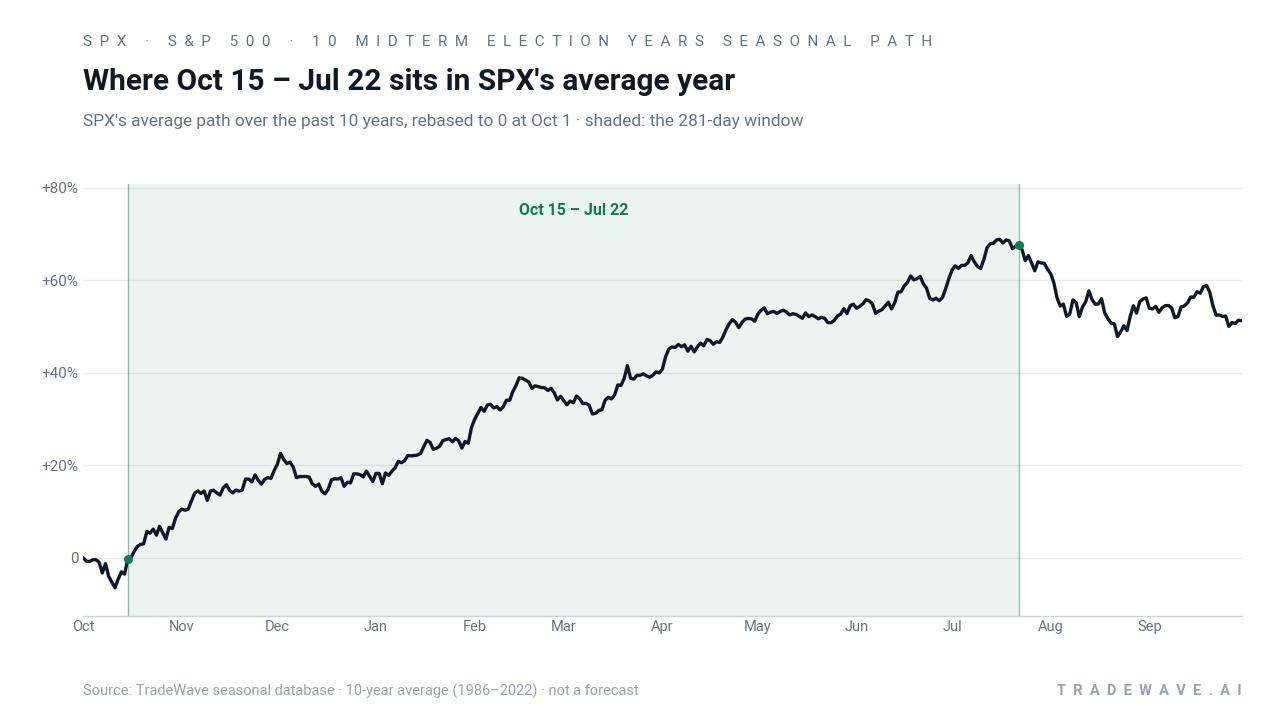
The historical seasonal average shows the S&P 500 tending to grind higher fairly steadily once the window opens, with much of the cumulative gain accruing through the turn of the year and into the heart of the pre-election year. That profile lines up with the broader “100-Year Pattern” concept, where late midterm to mid pre-election has often been one of the strongest stretches on the calendar for U.S. equities.
Yearly net and intraperiod swings show how much room the index has historically had to run, and how deep the air pockets have been along the way.
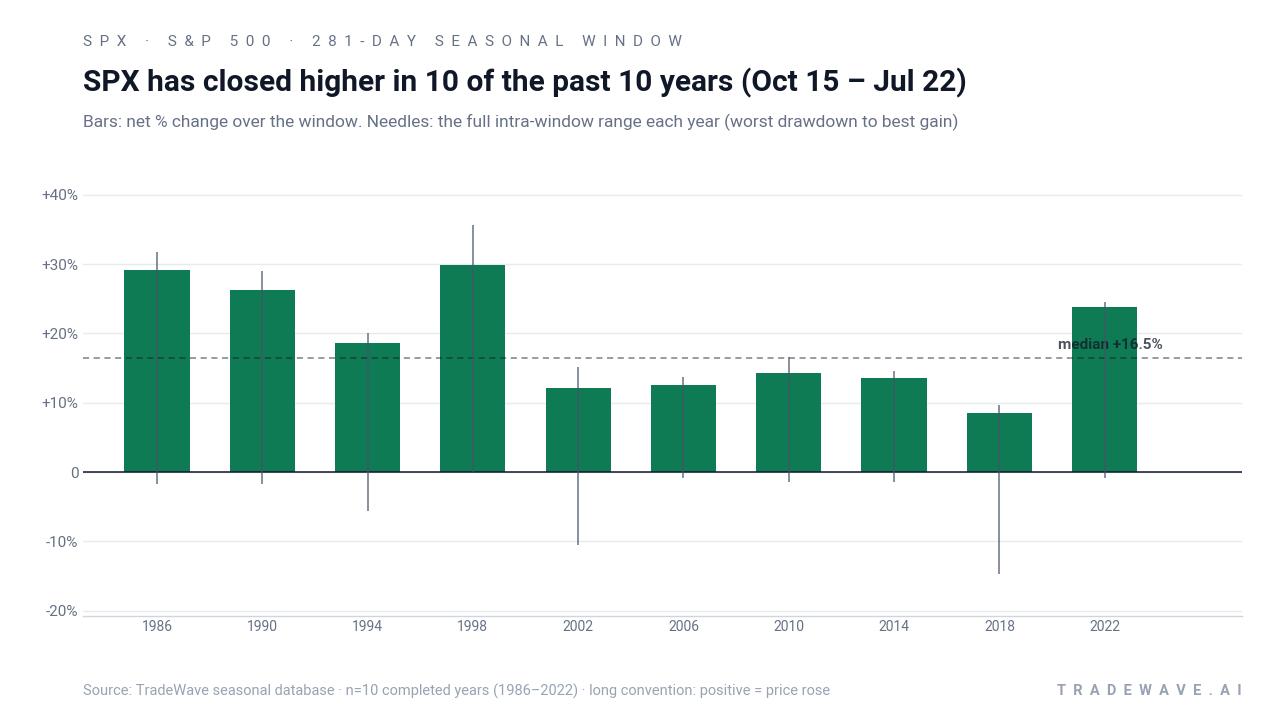
The combined net / maximum favorable move / maximum adverse move view shows a clear pattern: in most years, the S&P 500 has pushed to sizeable peak gains within the window while keeping worst drawdowns relatively contained, often in the low- to mid-single digits. The 2018 path is the main outlier on the downside, with that roughly 14.69% adverse excursion, but even there the index recovered to finish higher by the close. Add it up and you get a cumulative return of about 453.96% across the 10 midterm cycles when this specific window is stacked back to back.
History does not guarantee future results; adverse excursions can still be large within the window even when final outcomes have been positive in every past cycle.
Why does S&P 500 (SPX) follow this seasonal pattern?
One likely driver is the way the policy and earnings calendar lines up around the midterm and pre-election years. By late in the midterm year, much of the political uncertainty has passed, while fiscal and regulatory agendas for the remainder of the administration become clearer, which can support risk appetite. At the same time, institutional investors often reposition portfolios around year-end and into the pre-election year, when corporate earnings growth and liquidity conditions have historically been more supportive for equities.
What is driving S&P 500 (SPX) today?
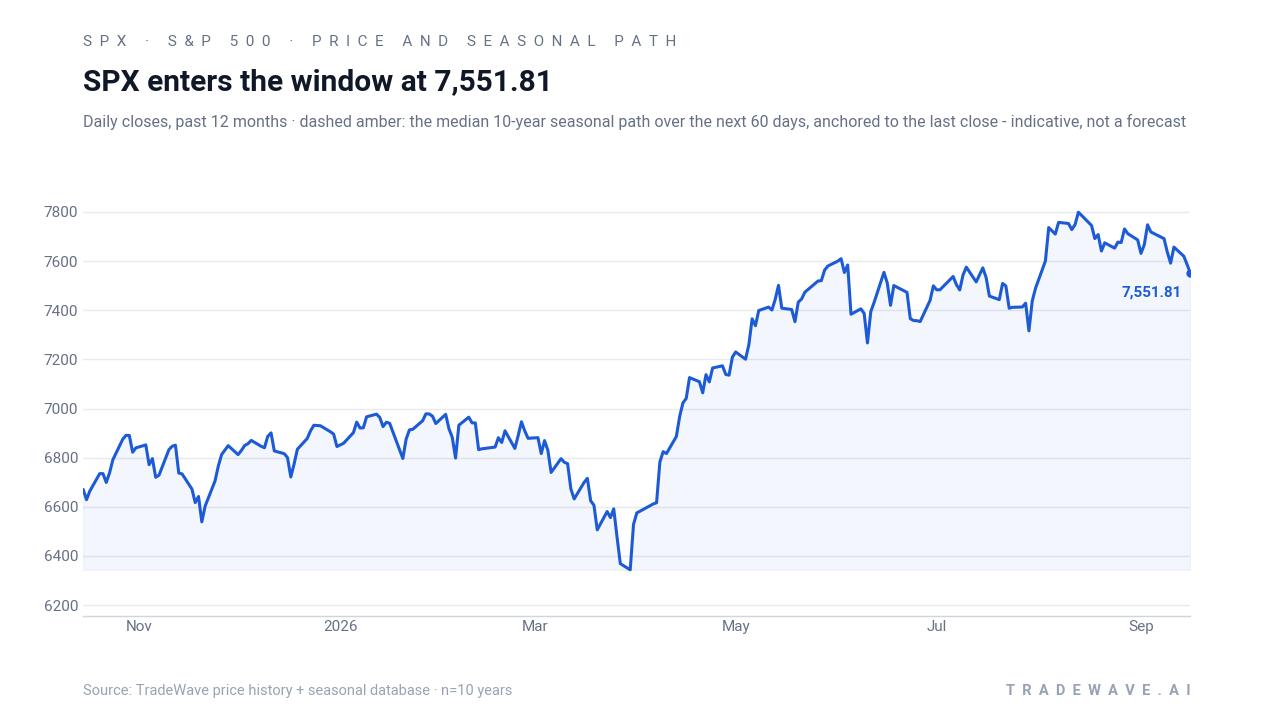
The S&P 500 slipped 0.45% in the prior session to 7,585.73, leaving it about 3.0% below its 52-week high and still up 10.81% so far in 2026.[3] The latest pullback comes in the wake of the Federal Reserve’s unanimous decision on Sep 16, 2026 to raise interest rates again and signal a higher-for-longer stance, a move that has weighed on equity valuations and pushed traders to reassess how much earnings growth is needed to justify current levels.[1]
Macro commentary from major outlets has framed the Fed’s move as part of a broader tightening cycle that is colliding with elevated energy prices, a combination that can pressure profit margins and consumer spending.[1][4] At the same time, the technology-heavy leadership at the top of the index means day-to-day SPX swings remain closely tied to the “Magnificent 7” and other large-cap growth names, which have been sensitive to every shift in rate expectations.[5] Against that backdrop, the index’s double-digit year-to-date gain looks solid but not euphoric, which may matter as the historically strong Oct. 15 seasonal window approaches.
The chart below situates the latest move in its recent multi-month context alongside the median seasonal path.
What should traders watch as the Oct. 15 seasonal window approaches?
First, the policy calendar remains central. Markets will be watching upcoming Fed communications and inflation data for any sign that the central bank might slow or pause its hiking campaign, which could ease pressure on valuations and align more closely with the historically bullish midterm-to-pre-election seasonal trend.[1] Any shift in tone around growth, labor markets or financial conditions could influence how closely this cycle tracks the prior 10 windows.
Second, price levels matter. On the upside, traders will be watching whether SPX can retest and hold above the 7,800 area that marks the current 52-week high, while on the downside, reactions around the 50-day moving average near 7,612 and any deeper pullbacks toward the 7,300–7,400 zone will help define whether this is a routine consolidation or something more serious.[3][5] Historically, the seasonal window has tolerated mid-single-digit drawdowns and, in rare cases like 2018, deeper air pockets before recovering, so how the index behaves into and just after Oct. 15 will be an early tell.
Third, sector leadership will be key. If large-cap tech and the broader growth complex continue to respond sharply to rate headlines, that could either amplify or blunt the usual seasonal tailwind, given their outsized weight in the index.[4][5] A rotation toward more cyclical sectors such as industrials, financials and energy, especially if oil prices stay firm, would signal a different flavor of risk-on than in some past cycles but could still fit within the historical pattern of broadening strength into the pre-election year.[4]
Finally, traders will be watching how closely actual price action tracks the historical seasonal path in the first 60 to 90 days of the window. A firm start with contained drawdowns would be consistent with most of the prior 10 midterm windows, while a sharp break below recent support or a prolonged sideways grind would mark a clear divergence. The history is strong, but the next few months of policy decisions, earnings reports and sector rotations will determine how much of that pattern shows up in this cycle.
Sources
- Seeking Alpha - S&P 500 Futures (SPX) Latest Stock Analysis | Seeking Alpha
- Seeking Alpha - S&P 500 Futures (SPX) Analyst Ratings by Seeking Alpha | Seeking Alpha
- Yahoo Finance - S&P 500 INDEX (^SPX) Charts, Data & News - Yahoo Finance
- MarketWatch - S&P 500 Index Overview - SPX
- Finviz - SPX - S&P 500
About this seasonal analysis
Seasonal pattern data is sourced from TradeWave.ai, which analyzes historical price behavior across annual calendar windows going back up to 30 years. Read the full data methodology or the book The 100-Year Pattern by Afshin Moshrefi (2026 edition). Past performance of seasonal patterns does not guarantee future results. This article is for informational purposes only and does not constitute investment advice.