Hormel Foods (HRL) Has Risen in 10 of 10 Midterm Fall Windows, Averaging 8.44% Gains
Hormel Foods is approaching an October 6 trading window that has quietly delivered gains in every midterm election year in the sample, even as the stock trades near its 52-week low and sentiment stays cautious.
Price as of Sep 17, 2026: $20.76 (last close).
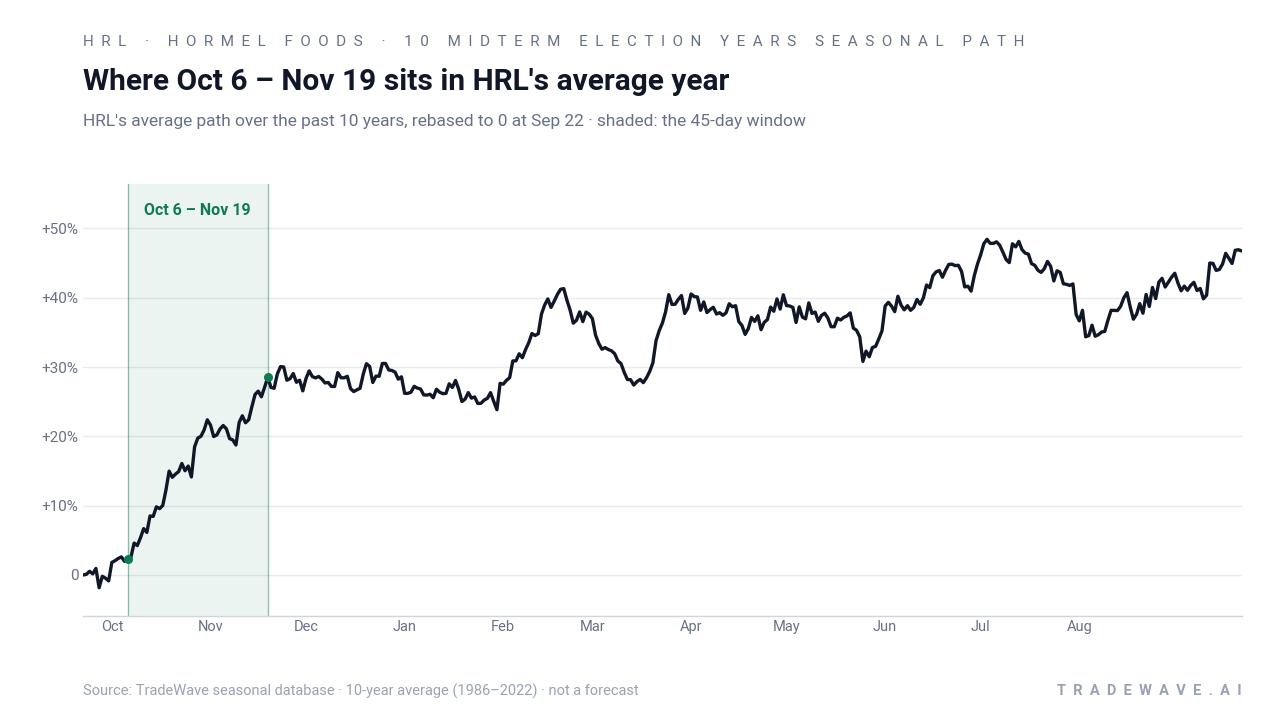
What is the seasonal pattern for Hormel Foods (HRL)?
Hormel Foods has risen in 10 of 10 midterm-year fall windows starting October 6, with an average gain of 8.44% in winning years.
- 10 for 10 in this window, averaging 8.44% gains in winning years across the last 10 midterm election cycles.
- Seasonal window runs from Oct 6 through Nov 19, spanning 45 calendar days in the midterm election year.
- Percent Profitable is 100.0%, with 10 winners and 0 losers in the historical sample.
- Median outcome is a 9.2% gain, pointing to a consistently positive HRL seasonal trend rather than a few outliers.
- TradeWave Ratio of 2.61 suggests price has typically traveled meaningfully in the long direction within the window, while the Sharpe ratio of 2.49 reflects strong risk-adjusted returns.
- Intraperiod swings have included several years with mid-single-digit drawdowns before finishing higher, so the ride has not always been smooth.
According to historical data from TradeWave.ai, this midterm-year autumn stretch has behaved very differently from an average month for Hormel. The next section walks through how that pattern has played out and where the upcoming October 6 window fits into the broader election-cycle backdrop.
How has Hormel Foods (HRL) traded in the October 6 midterm-year window?
Hormel Foods has posted gains in every one of the last 10 midterm election years during the 45-day window that starts on Oct 6, averaging an 8.44% rise from entry to exit. Today the stock closed at 20.76, down 0.1% on the day and sitting about 6.2% above its 52-week low of roughly 19.49, after sliding 14.63% over the past month.
The pattern is built on the last 10 midterm election years, a phase of the presidential cycle that often features policy uncertainty, budget wrangling and shifting expectations for regulation. Grouping by this cycle matters for a consumer staples name like Hormel because institutional investors tend to rebalance defensives differently around midterms than in ordinary years, especially when they are weighing fiscal policy and food-inflation trends.
This seasonal window begins on Oct 6 and spans 45 days into mid-November. Historically, during this period, Hormel Foods has shown a strong bullish tendency for long positions, with all 10 sampled midterm years finishing higher over the window. The trade direction for this pattern is explicitly long, so those positive returns line up with the intended side of the trade rather than representing short squeezes or failed hedges.
Across those 10 years, Percent Profitable sits at 100.0%, with 10 winners and 0 losers. Average profit for the winning years is 8.44%, and because there were no losing years in the sample, the all-years average is the same figure. The median gain of 9.2% shows that the typical outcome has been close to that average, not skewed by a single blockbuster year.
Looking at individual years, the strongest net return came in 2018, when HRL gained 12.43% between the Oct 6 entry and the Nov 19 exit, after reaching a best intraperiod run-up of 14.66%. At the other end of the spectrum, 2006 delivered the softest outcome, with a 3.43% net gain and a maximum favorable move of 4.91%, still positive but more muted than the double-digit years.
Intraperiod behavior has not been one-way. The maximum favorable move, or best point-to-peak rally within the window, has ranged from mid-single digits to the high teens, while the maximum adverse move, or worst drawdown from entry, has often been in the 2% to 3% range. For example, in 1990 HRL ultimately finished the window up 10.86%, but not before a 3.45% dip from the entry level, and in 2014 the stock endured a 3.1% drawdown before closing the period with a 7.97% gain.
The historical average path suggests that strength tends to build steadily rather than spiking only at the end. In several years, including 1998 and 2018, the stock pushed higher early in the window and then consolidated, while in others such as 2002 the better gains came later after a choppy start. That mix produces an average curve that slopes upward across the full 45 days rather than front-loading or back-loading all of the performance.
On a compounded basis, stacking this 45-day window across the 10 midterm election years would have produced a cumulative gain of 124.07%. Add it up: repeating just this slice of the calendar in those years more than doubled capital, even though each individual trade lasted only about six and a half weeks.
Year-by-year bars show how consistently those gains have appeared, along with the swings inside each window.
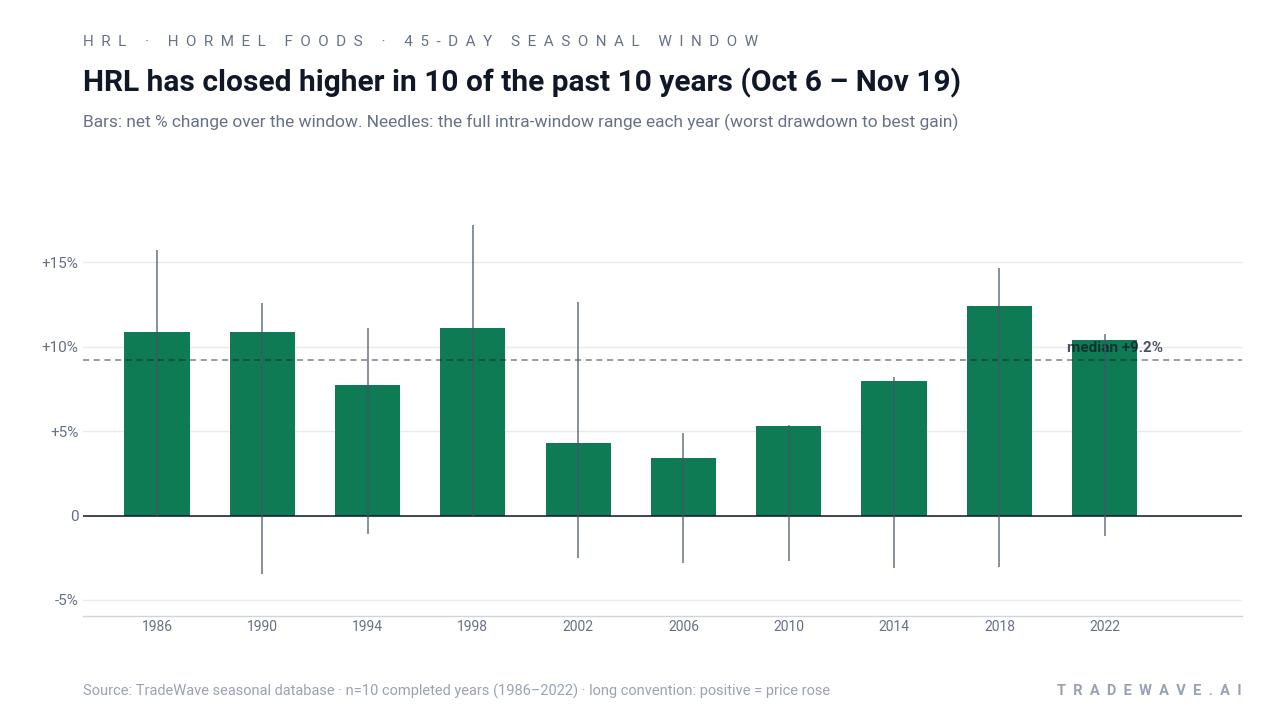
History does not guarantee future results, and even in a perfect 10-for-10 window, intraperiod drawdowns can be uncomfortable before the trade finishes higher.
Why does Hormel Foods (HRL) follow this seasonal pattern?
One likely driver is the way portfolio managers reposition around midterm elections, often leaning into defensive consumer staples as policy risk peaks and then fades. Analysts have also pointed to holiday-season demand for packaged foods and protein, which can support earnings expectations into year-end and attract flows into names like Hormel. The pattern may reflect that combination of election-cycle risk management and consumer spending cycles rather than any single company-specific catalyst.
What is driving Hormel Foods (HRL) today?
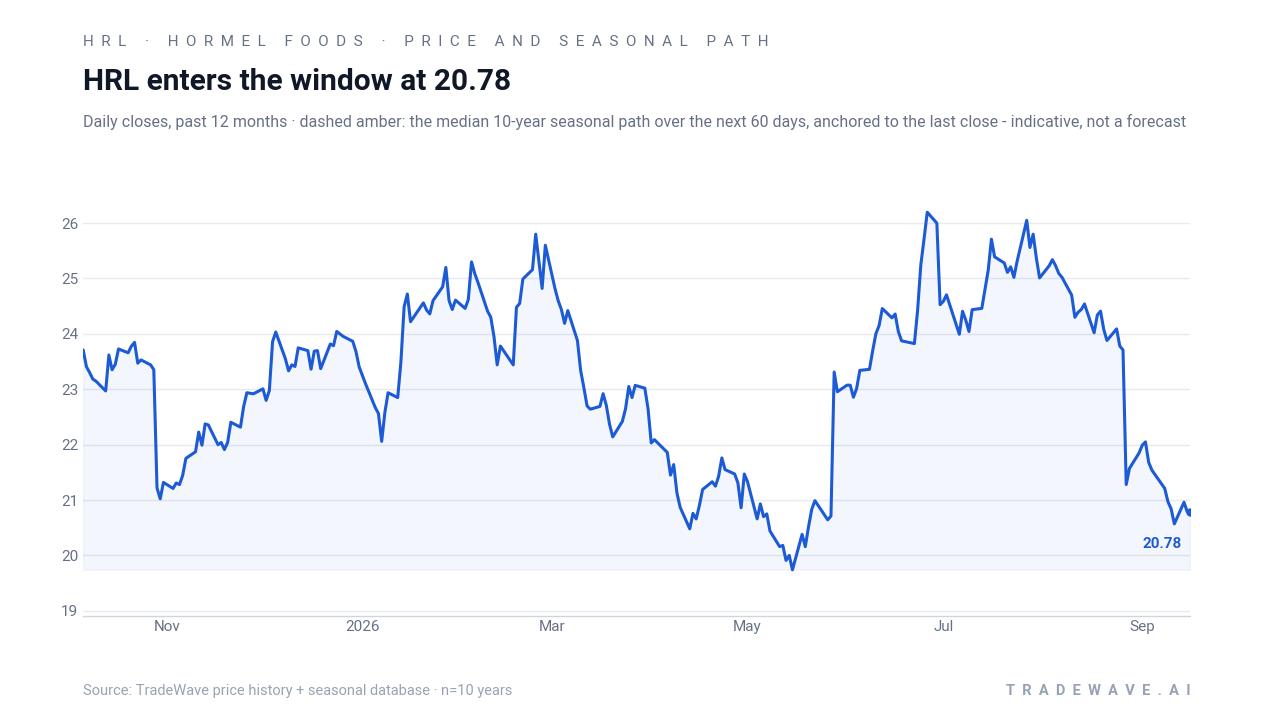
Hormel closed Friday at 20.76, off 0.1% on the session, after a rough month that has left the stock down 14.63% over 30 days and trading about 21.5% below its 52-week high of 26.43. The pullback comes after a stretch of weaker profitability and cost pressure that, in late 2025, saw the company post a GAAP loss for fiscal Q4 even as adjusted earnings per share of $0.32 edged past estimates and management laid out cost-cutting and modernization plans for 2026.[1][4][5]
In December 2025, Hormel guided to adjusted fiscal 2026 EPS of $1.43 to $1.51 and net sales of $12.2 billion to $12.5 billion, while flagging $9 million to $12 million of restructuring charges tied to severance and other costs.[4][5] Around the same time, Barclays trimmed its price target to the low-$30s but kept an Overweight stance, arguing that protein markets in 2026 would likely resemble 2025 and that Hormel’s portfolio could still benefit from steady demand for packaged foods and branded meats.[1][3]
Sector-wide, packaged food producers have been wrestling with higher input costs for beef, pork and poultry, along with episodic supply disruptions such as bird flu and plant outages, which have squeezed margins and made pricing power more important.[5] In May 2026, Hormel reported lower profit and tempered full-year expectations, reinforcing the sense that the turnaround would take time rather than arriving in a single quarter.[7]
Positioning and corporate behavior add another layer. Short interest data updated in July 2026 showed roughly 20.1 million HRL shares sold short at year-end 2025, about 3.7% of the float, suggesting a meaningful but not extreme bearish bet against the stock.[8] Insider filings compiled over the past year show several directors selling shares, including Elsa A. Murano’s 13,400-share sale in December 2025 at $24 and Gary C. Bhojwani’s 20,200-share sale in July 2026 at $24.51, moves that some investors read as a lack of urgency to add exposure at those levels.[9][10]
The chart below situates the latest slide against the past year of trading and overlays the historical seasonal path for the next two months.
What should traders watch as the October 6 window approaches?
First, the calendar. The 45-day window tied to the last 10 midterm election years opens on Oct 6 and runs through Nov 19, so any shift in price behavior around that date will be watched against the historical pattern. Traders will be looking to see whether HRL can stabilize above the recent low near 19.5 and start to build higher lows as the window begins.
Second, fundamentals and policy headlines. Any updates on protein pricing, input-cost relief or demand for branded packaged foods could influence how investors treat consumer staples during the concluding midterm election year and into the pre-election year, when risk appetite has often improved in past cycles.[1][5] A supportive macro backdrop would make it easier for the historical seasonality to express itself; renewed margin pressure or guidance cuts would work the other way.
Third, positioning and insider behavior. Short interest trends will be important: if the 3.7% of float shorted at the end of 2025 has grown into the fall of 2026, any upside move inside the window could be amplified by covering, while a flat or shrinking short base would point to a more balanced tape.[8] On the insider side, traders will watch whether the pattern of director selling seen in late 2025 and mid-2026 gives way to neutral activity or even modest buying, which would signal a different tone from the boardroom.[9][10]
Finally, behavior inside the window itself will be the real test of this HRL seasonal trend. A move that tracks the historical script, with mid-single to high-single-digit gains and manageable drawdowns, would reinforce the idea that this midterm-year slice of the calendar still matters. A sharp break below the recent lows or a flat, listless tape through mid-November would mark the first real failure for a pattern that has been 10 for 10 so far.
Sources
- Yahoo Finance - Hormel (HRL) Featured in Barclays’ Forward Look at Agriculture and Protein Demand
- Finviz - Hormel (HRL) Featured in Barclays' Forward Look at Agriculture and Protein Demand
- Yahoo Finance - Barclays Trims Hormel (HRL) Target as Agriculture Outlook Turns Uneven
- The Wall Street Journal - Hormel Expects Better Earnings Next Year
- Reuters - Hormel Foods forecasts annual profit above estimates on higher prices
- Barchart (Rosen Law Firm notice) - Rosen Law Firm Encourages Hormel Foods Corporation Investors to Inquire About Securities Class Action Investigation - HRL
- Wall Street Journal - Hormel Reports Lower Profit
- MarketBeat - Hormel Foods (HRL) Short Interest & Short Float | Updated Sep 2026
- OpenInsider - HRL - Hormel Foods Corp /De/ - SEC Form 4 Insider Trading Screener
- Markets Insider / Business Insider - Hormel Foods Stock Price | HRL Stock Quote, News, and History
About this seasonal analysis
Seasonal pattern data is sourced from TradeWave.ai, which analyzes historical price behavior across annual calendar windows going back up to 30 years. Read the full data methodology or the book The 100-Year Pattern by Afshin Moshrefi (2026 edition). Past performance of seasonal patterns does not guarantee future results. This article is for informational purposes only and does not constitute investment advice.