S&P 500 (SPX) Near Record Highs as Powerful Oct 15 Midterm Rally Window Approaches
The S&P 500 is trading just below record territory as it heads toward an Oct 15 seasonal window that has been quietly powerful across past midterm election years.

What is the seasonal pattern for S&P 500 (SPX)?
S&P 500 has risen in 10 of 10 midterm-election Oct 15 to late-July windows, with an average gain of 18.9% in winning years.
- 10 for 10 in this window, with S&P 500 averaging 18.9% gains across all completed midterm-election cycles.
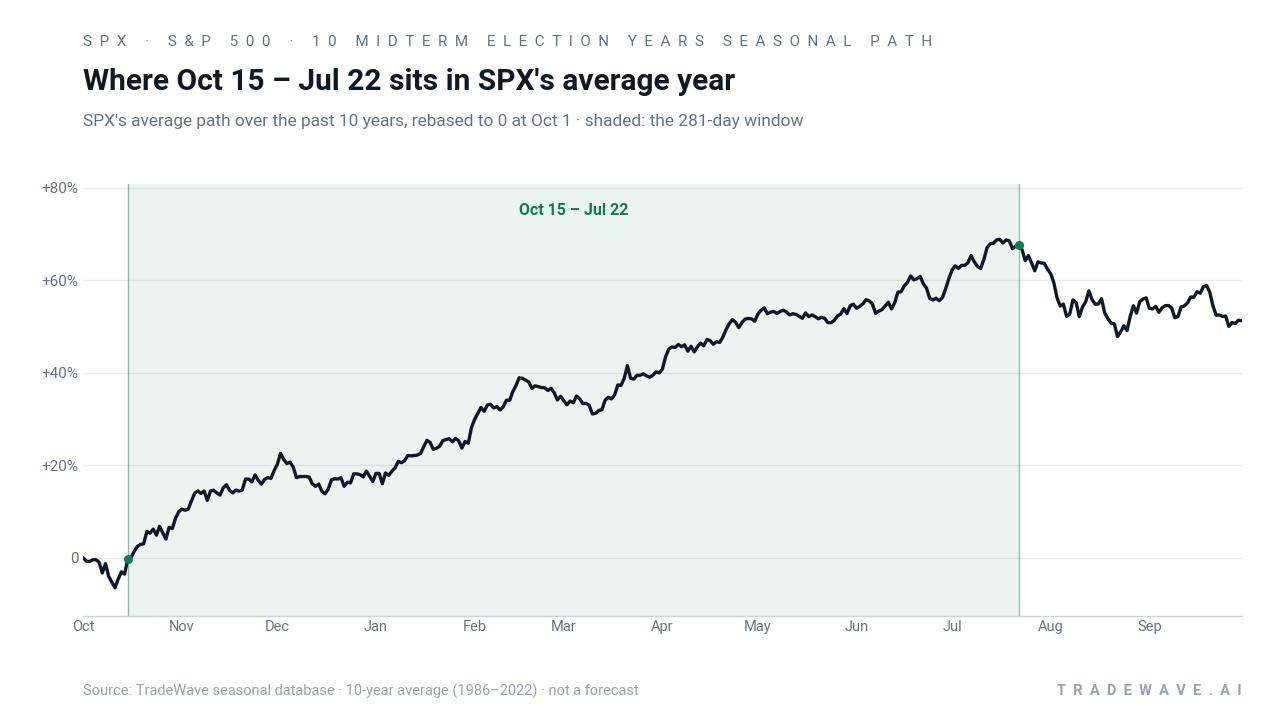
- Seasonal window runs 281 days from Oct 15 to around Jul 22, spanning the end of the midterm election year into the pre-election year.
- Percent Profitable is 100.0%, with 10 winners and 0 losers in the TradeWave sample.
- Annualized return across these windows is 18.67%, with a Sharpe ratio of 2.03 on end-of-window outcomes.
- TradeWave Ratio of 2.07 suggests price has typically traveled meaningfully in the long direction within the window, not just at the close.
- Worst intraperiod drawdown reached about -14.69% in 2018, showing that even strong seasonal stretches can include sharp pullbacks.
According to historical data from TradeWave.ai, this midterm-to-pre-election stretch has behaved very differently from an average year on the calendar. The next section looks at how that pattern has played out and where the upcoming Oct 15 window fits into the broader election cycle.
How has S&P 500 (SPX) traded in the Oct 15 to late-July midterm window?
The Oct 15 to late-July window has been one of the S&P 500’s most consistent bullish stretches, with gains in 10 of the last 10 midterm election-year cycles and average returns of 18.9%. Today the index sits at 7,109.14, about 0.5% below its 52-week high of 7,147.52, leaving it near the top of its recent range as this powerful seasonal regime approaches.
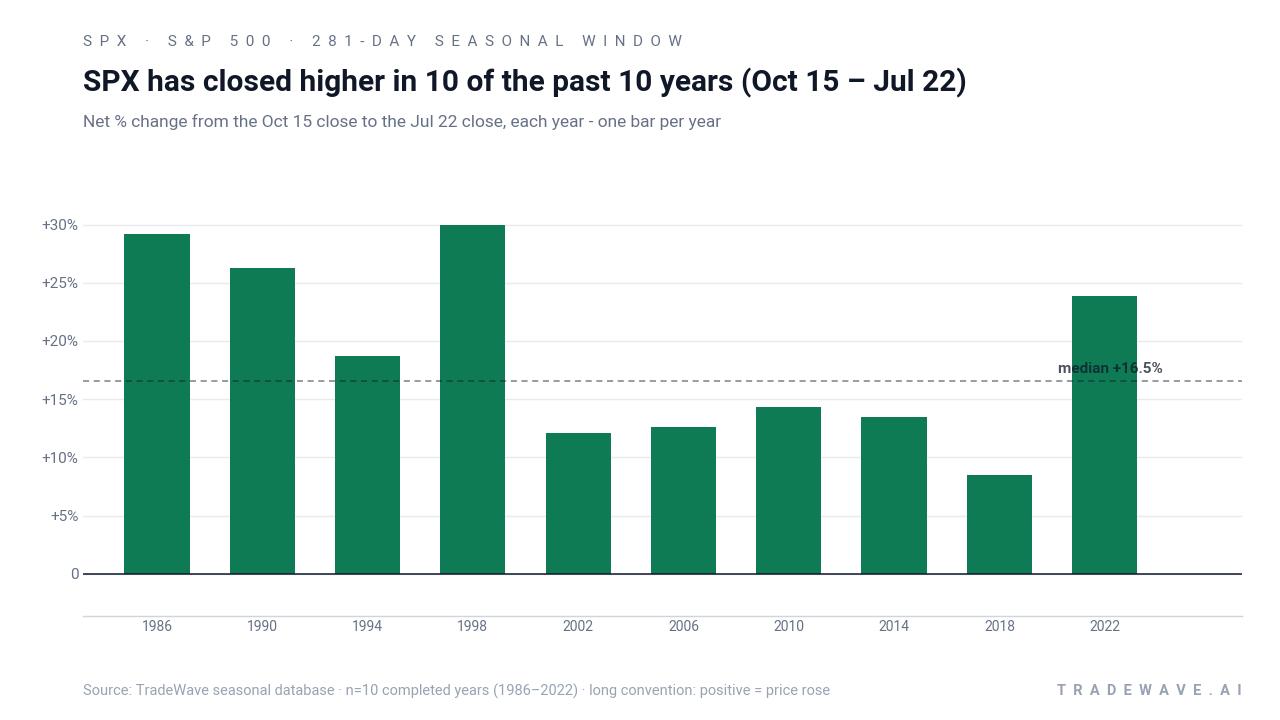
Grouping the data by the presidential election cycle matters here because this 281-day stretch straddles the end of the midterm election year and the start of the year before the presidential election, a phase that has often coincided with friendlier policy tone and improving risk appetite. In this sample, every midterm-year Oct 15 entry through the following July has rewarded long exposure, even when the broader macro backdrop looked shaky.
Across the 10 completed windows since 1986, the S&P 500’s average gain of 18.9% comes with a median profit of 16.52%, which means the typical outcome has been a mid-teens advance rather than a single outlier skewing the numbers. The annualized return of 18.67% over these slices is well above what investors usually expect from the index over a full year, and the Sharpe ratio of 2.03 points to unusually strong risk-adjusted performance for this specific calendar span.
The per-year breakdown shows how consistent that strength has been. The weakest outcome in the set was 8.52% in 2018, a year that still finished higher despite a maximum intraperiod drawdown of -14.69%. At the other end, 1998 delivered a 29.93% net gain with a best intraperiod run-up of 35.59%, while 2022 posted a 23.84% advance as the market climbed out of that year’s bear-market trough.
Yearly net and intraperiod swings show how upside and drawdowns have coexisted inside this long window.
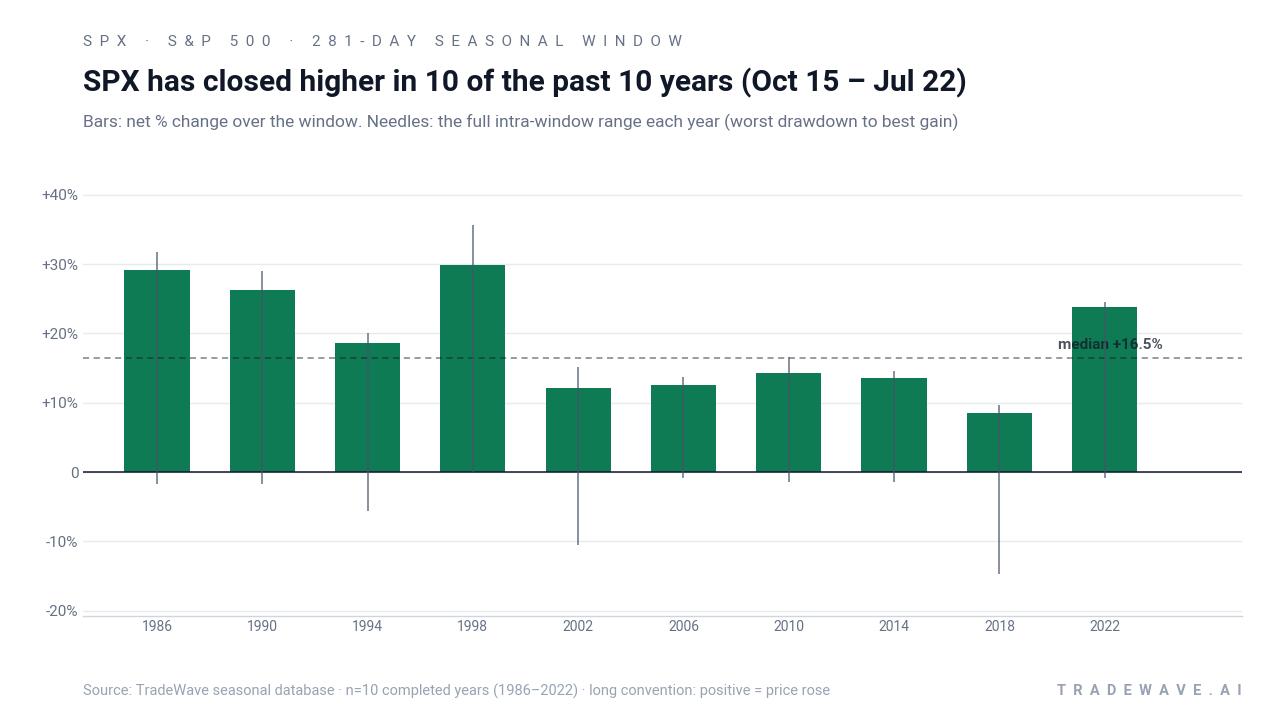
The combined net / MFE / MAE profile shows a clear pattern: in most years, the S&P 500 has pushed to double-digit peak gains at some point in the window, while the worst adverse moves have usually stayed in the mid-single digits, with 2018 as the main outlier. That mix of strong maximum favorable excursions and generally contained maximum adverse excursions is what drives the high TradeWave Ratio of 2.07 for a long setup.
Stacking the windows compounds that effect. Reinvesting only during this Oct 15 to late-July stretch across the 10 midterm-election samples would have produced a cumulative gain of about 453.96%, according to the TradeWave seasonal database, even though the strategy is out of the market for the rest of each year. Add it up: this is a long seasonal regime, not a quick trade, and historically it has behaved like a durable tailwind.
History does not guarantee future results; adverse excursions can still be large inside winning windows, and a 100% past hit rate does not rule out a loss in the next cycle.
Why does S&P 500 (SPX) follow this seasonal pattern?
One likely driver is the way the policy and earnings calendar lines up between late in the midterm election year and the year before the presidential election. Analysts often point to reduced political uncertainty after midterms, combined with fiscal support and improving corporate guidance, as catalysts for risk-on behavior in this phase. The pattern may also reflect institutional portfolio rebalancing and sector rotation into growth and cyclicals as visibility on regulation and interest rates improves heading into the next presidential race.
What is driving S&P 500 (SPX) today?
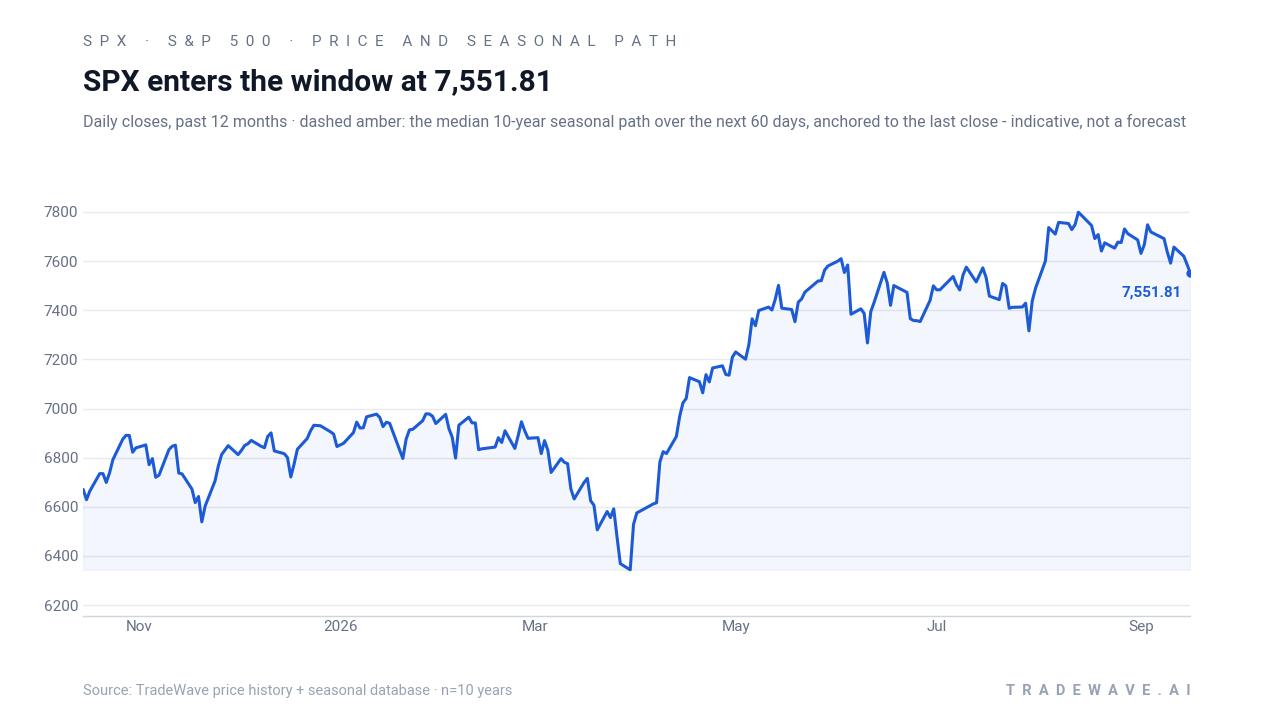
The S&P 500 closed the prior session at 7,109.14, down 0.24% on the day and sitting about 10.4% above its 52-week low of 6,316.91 while hovering just under its 7,816.70 52-week high.[1] The index has been grinding higher in recent weeks as investors balance optimism about modest 2026 gains with concerns over elevated U.S. debt levels, China/Taiwan tensions, and persistent Middle East risks that could still trigger a pullback toward key moving averages.[1]
Macro surveys point to expectations for roughly high-single-digit S&P 500 gains this year, but they also flag geopolitical risk and oil-driven inflation as the main spoilers.[1] Elevated crude prices tied to Middle East developments have already influenced sector rotation inside the index, lifting energy names while pressuring rate-sensitive pockets when inflation worries flare.[1] At the same time, technology remains the favored sector among many investors, keeping the S&P 500’s leadership narrow and leaving the benchmark more vulnerable if a handful of mega-cap names stumble.
The chart below situates the latest move in its recent multi-month context alongside a historical seasonal projection.
What should traders watch as the Oct 15 window approaches?
The first marker is the calendar itself: Oct 15 is the formal start of this 281-day seasonal regime, and the historical pattern suggests that behavior from late October through the following summer has mattered more than any single day. Traders will be watching whether the index can hold above key support zones if volatility spikes around geopolitical headlines or inflation data, since past midterm cycles have still delivered strong window-long gains despite interim drawdowns.
Second, the election-cycle backdrop shifts as 2026 wraps up. The market is concluding the midterm election year and moving into the year before the presidential election, a phase that has often coincided with friendlier policy tone and stronger equity performance. If the S&P 500 continues to trade near record highs into year-end while breadth improves beyond mega-cap technology, that would rhyme with the historical pre-election-year seasonal trend captured in this window.
Finally, the way the index behaves inside the window will be the real test of this pattern. A path that features normal pullbacks but ultimately delivers a mid-teens or better gain into late July would be consistent with the last 10 midterm-election samples. A deeper, sustained break that fails to recover by next summer would mark a clear departure from the historical script and signal that macro forces such as geopolitics, oil-driven inflation, or policy surprises have overwhelmed the usual seasonal tailwind.[1]
Sources
About this seasonal analysis
Seasonal pattern data is sourced from TradeWave.ai, which analyzes historical price behavior across annual calendar windows going back up to 30 years. Read the full data methodology or the book The 100-Year Pattern by Afshin Moshrefi (2026 edition). Past performance of seasonal patterns does not guarantee future results. This article is for informational purposes only and does not constitute investment advice.