IBM Eyes Seasonal Rally After 15 Straight Midterm Winter Gains
IBM is deep in the red for 2026, but an Oct 24–Feb 14 seasonal window that has never lost in past midterm election years is coming into view.
Price as of Sep 23, 2026: $232.76 (last close).

What is the seasonal pattern for IBM (IBM)?
IBM has risen in 15 of 15 midterm-year Oct 24–Feb 14 windows, with an average gain of 15.53% in winning years.
- 15 for 15 in this window, averaging 15.53% gains in winning years across the last 15 midterm election cycles.
- Seasonal direction is bullish for a 114-day stretch from Oct 24 through Feb 14, aligned with a long trade setup.
- Percent Profitable is 100.0%, with 15 winners and 0 losers in the historical sample.
- Median profit of 15.96% and a Sharpe ratio of 1.52 point to unusually strong risk-adjusted returns for this IBM trading window.
- The TradeWave Ratio of 1.87 signals that price has typically traveled meaningfully in the long direction within the window, even before final closes.
- Individual years have still seen notable drawdowns inside the window, so intraperiod volatility remains a key risk despite the perfect win record.
According to historical data from TradeWave.ai, IBM’s behavior in late midterm election years has followed a remarkably consistent seasonal script. The next section looks at how that script has played out in prior Oct 24–Feb 14 windows and what it could mean for the coming quarter.
How has IBM (IBM) traded in the Oct 24–Feb 14 midterm-year window?
IBM has closed higher in every single Oct 24–Feb 14 window across the last 15 midterm election years, averaging a 15.53% gain over each 114-day stretch. Today the stock finished at 232.76, up 0.6% on the session, leaving it down about 26.0% for 2026 and well below its 52-week high near 327.74. That gap between a bruising year-to-date slide and a historically strong winter seasonal pattern is what makes this upcoming IBM trading window stand out.
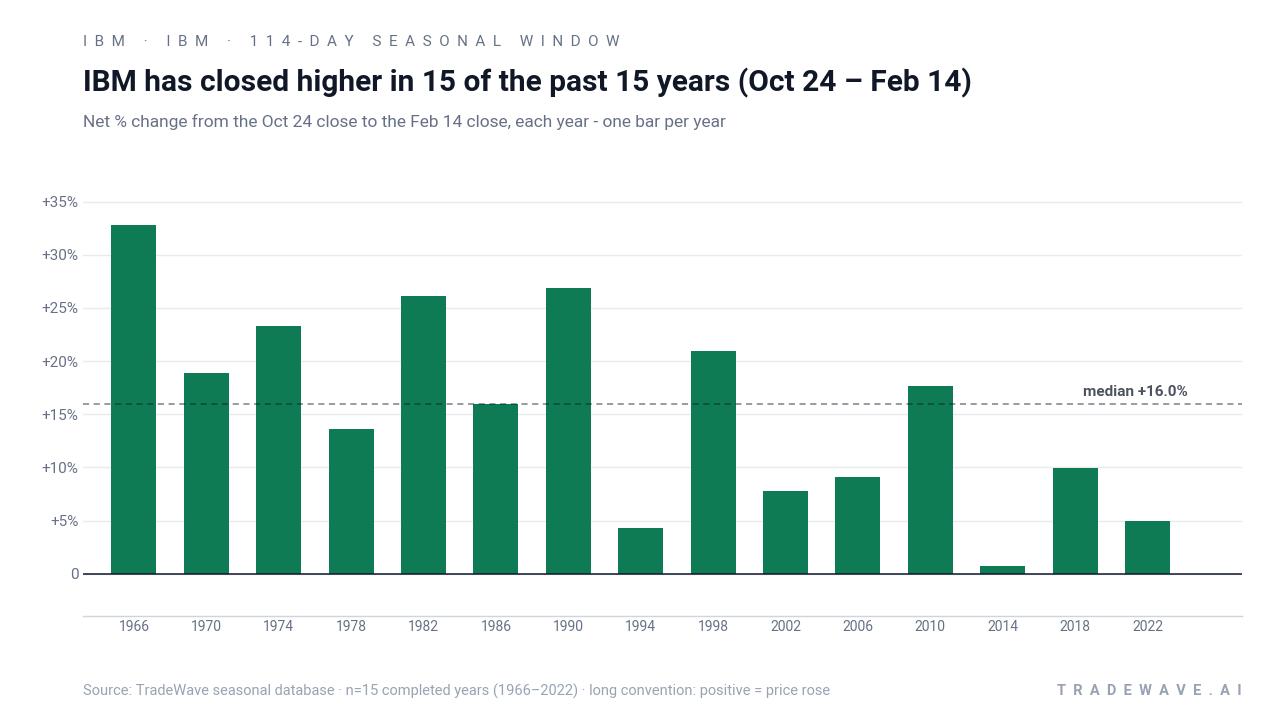
Grouping the data by the presidential election cycle matters here because this window sits at the handoff from the midterm election year into the year before the presidential election, a phase that has often coincided with friendlier policy tone and stronger risk appetite. In IBM’s case, the Oct 24–Feb 14 slice of the calendar has lined up with that transition in each of the last 15 midterm cycles, and the historical seasonality shows a clear bullish bias for longs during this period.
Across those 15 completed windows, the Percent Profitable is 100.0%, with 15 winners and 0 losers, and the median profit clocks in at 15.96%. Average gains of 15.53% over roughly four months are sizable for a mature technology stock, especially when every single midterm-year iteration has finished in the green. For a long trade direction, that kind of clean win-loss record is rare and makes this IBM seasonal trend stand out even among strong patterns.
The per-year breakdown shows that not every window was a home run, but the floor has been high. The softest outcome in the sample was a 0.69% gain in 2014, while stronger years such as 1990 delivered a 26.89% net return over the same calendar stretch. Add it up and stacking this 114-day window across the 15 midterm election years compounds to a cumulative return of 732.55%, which is what the cumulative chart captures.
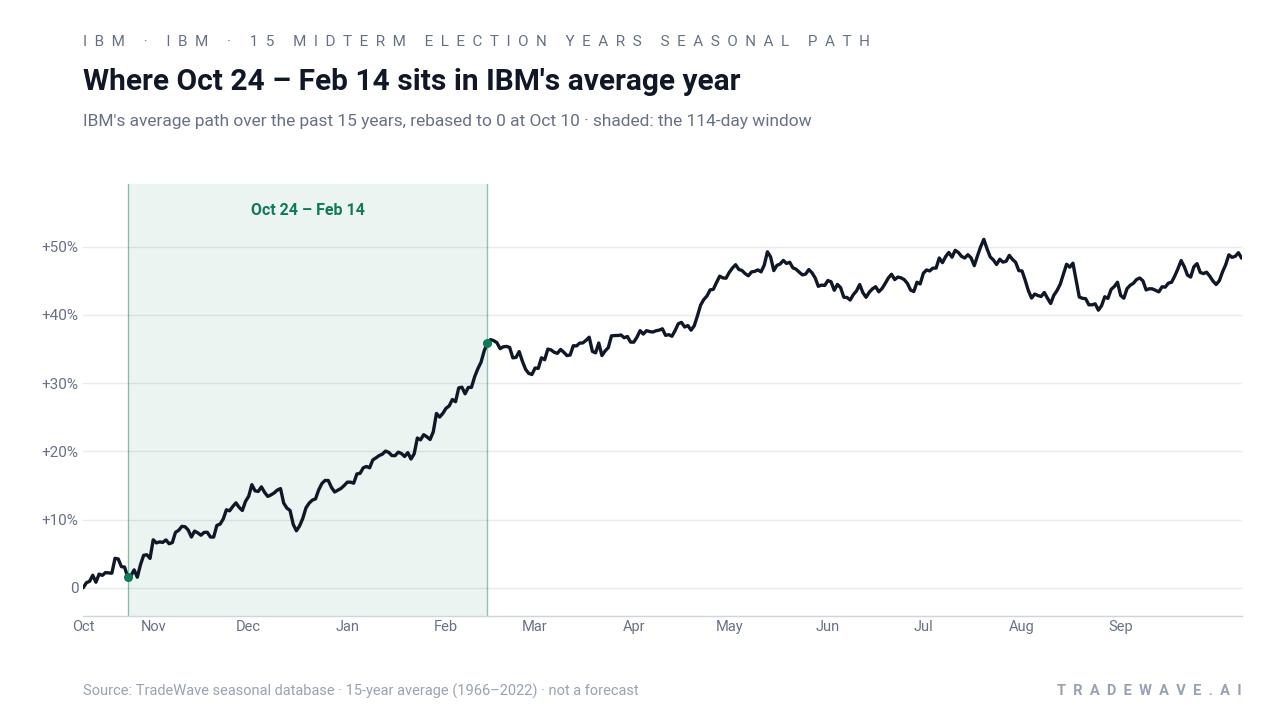
The historical seasonal average path suggests that IBM’s gains in this window have tended to accrue steadily rather than in a single spike. The shaded region on the trend chart shows a climb that often starts early in the window and continues into the new year, consistent with a long-biased pattern that benefits from both year-end positioning and early pre-election-year optimism.
Year-by-year ranges of best and worst moves inside the window show how much room IBM has had to run and how deep drawdowns have gone before finishing higher.
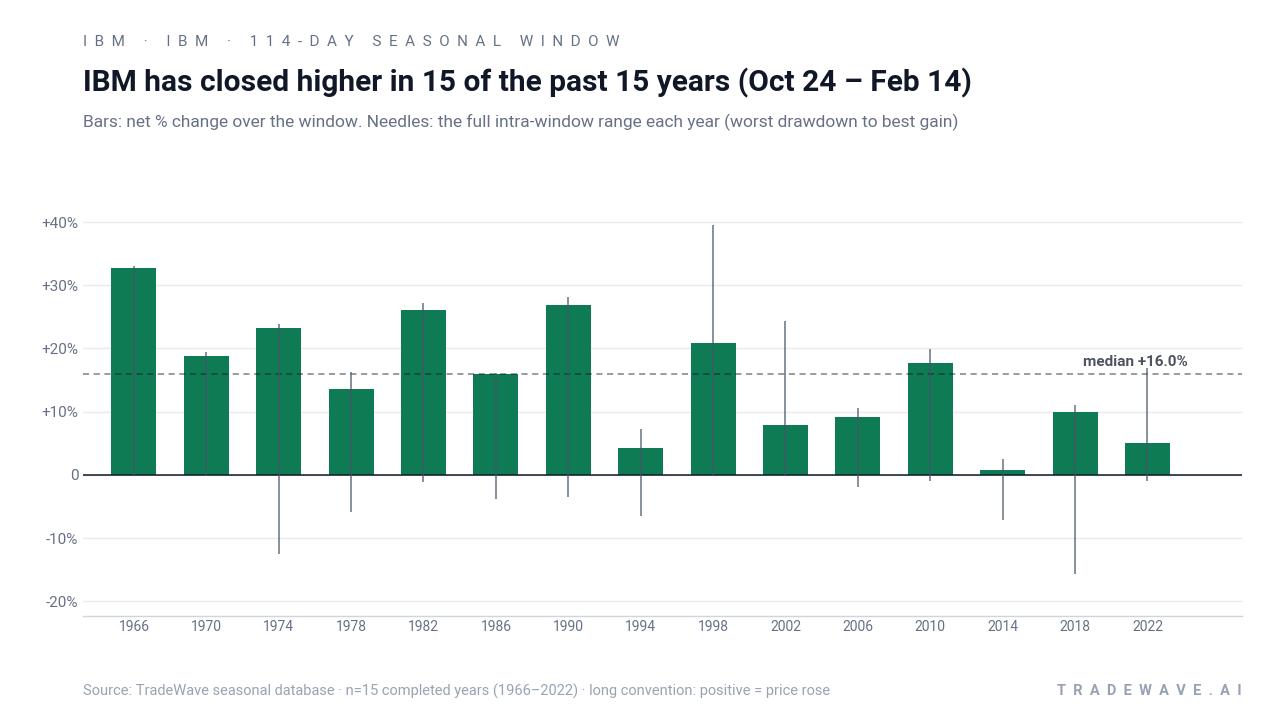
The bar-and-needle chart combines net returns with the full intraperiod range, from maximum adverse move to maximum favorable move, for each year. In stronger years such as 1998, IBM’s best intraperiod gain reached 39.48% while the worst drawdown was negligible, showing a powerful upside skew. In choppier years like 2018, the stock still finished up 9.92% but endured a 15.66% drawdown at one point, a reminder that even winning windows can involve sharp setbacks before the final close.
History does not guarantee future results; adverse excursions can be large even in winning windows, and traders should treat the 100.0% win rate as context, not a promise.
Why does IBM (IBM) follow this seasonal pattern?
One likely driver is the clustering of IBM’s earnings and guidance updates around late October and January, which can reset expectations into year-end and the start of the pre-election year. Analysts have also pointed to institutional portfolio rebalancing and sector rotation into large-cap technology during this phase, especially when policy risk looks more contained heading into the presidential election cycle. The pattern may also reflect corporate IT budgeting, as large clients finalize spending plans and often commit to infrastructure and software deals in the final quarter and early in the new year.
What is driving IBM (IBM) today?
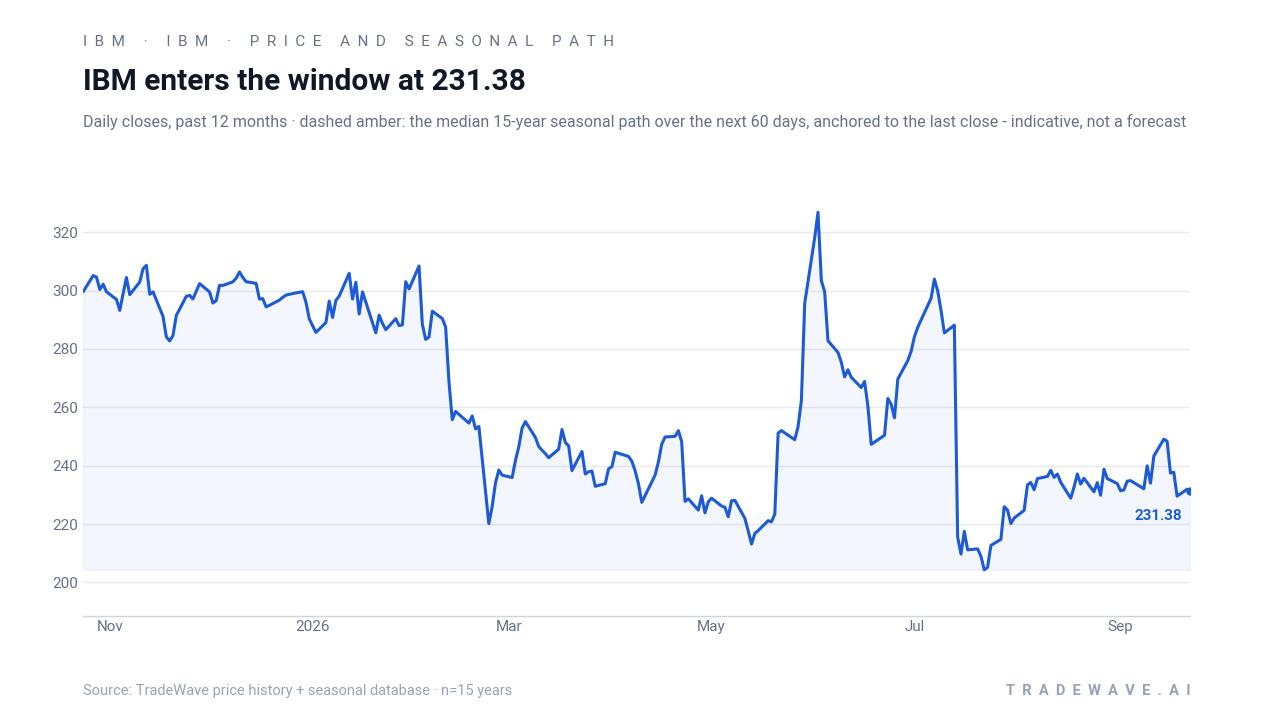
IBM closed Thursday at 232.76, up 0.6% on the day, but the stock remains roughly 26.0% lower year to date after a punishing summer slide. In July 2026, IBM preannounced that second-quarter revenue and earnings would miss Wall Street expectations, citing customers shifting capital spending toward AI servers, storage and memory and away from some of its traditional software and mainframe offerings, and the stock dropped more than 25% following that warning.[1][3][4][5]
That earnings reset came after a strong run into mid-2026, when IBM had notched record closing highs as investors crowded into AI and infrastructure plays.[6] The reversal has left the shares trading well below those peaks and has forced investors to rethink how IBM fits into the broader technology and AI infrastructure rotation, where spending is flowing toward hardware-heavy buildouts while software budgets feel the squeeze.[3]
Macro-wise, the story is less about broad recession fears and more about how corporate IT budgets are being reprioritized. Reuters reported in July 2026 that IBM and peers were seeing pressure in software and mainframe segments as clients diverted funds to AI infrastructure, a theme that has shaped the sector’s seasonal outlook heading into the final quarter of the midterm election year.[3] For IBM, that means the upcoming Oct 24–Feb 14 seasonal window will play out against a backdrop of shifting demand, tighter budgets in some legacy lines, and elevated scrutiny of execution after the Q2 warning.[1][3][4][5]
The chart below situates the latest move in its recent multi-month context and overlays the median historical seasonal path for the next 60 days.
What should traders watch as IBM approaches this seasonal window?
First, the calendar: the 114-day window opens on Oct 24 and runs through Feb 14, so any shift in price behavior as that date approaches will be watched against the backdrop of the 15-for-15 historical record. Traders will be looking to see whether IBM can stabilize above its recent lows and start to track closer to the historical seasonal path, or whether post-warning selling pressure persists into the start of the window.[1][3][4][5][6]
Second, the policy and macro calendar into year-end matters because this window straddles the end of the midterm election year and the start of the year before the presidential election, a phase that has often coincided with friendlier liquidity and risk-taking. Any signs that corporate IT budgets are loosening again, or that AI infrastructure spending is broadening rather than cannibalizing software, would interact directly with IBM’s historical seasonality and could influence how closely this cycle tracks the past pattern.[3]
Finally, watch how IBM trades around its next major updates and sector newsflow: if rallies on positive headlines are sustained rather than faded, that would be more consistent with prior strong Oct–Feb windows. If, instead, bounces continue to be sold and drawdowns deepen even as the seasonal window opens, that would mark a clear break from the historical IBM seasonal trend and signal that fundamentals are overpowering the usual election-cycle pattern.[1][3][4][5][6]
Sources
- Yahoo Finance - IBM stock plummets more than 25% on Q2 earnings warning
- CNBC - IBM tops third-quarter estimates and lifts guidance, but stock drops
- Reuters - IBM warns AI boom is squeezing software budgets; shares slump in sector rout
- Barron's - IBM Cuts Revenue Outlook Following Historic Stock Drop
- Barron's - What’s Next for IBM Stock After 25% Collapse
- Barron's - IBM Stock Notches Highest Close on Record. This Time It’s Not About Quantum.
- Forbes - What’s Happening With IBM Stock?
About this seasonal analysis
Seasonal pattern data is sourced from TradeWave.ai, which analyzes historical price behavior across annual calendar windows going back up to 30 years. Read the full data methodology or the book The 100-Year Pattern by Afshin Moshrefi (2026 edition). Past performance of seasonal patterns does not guarantee future results. This article is for informational purposes only and does not constitute investment advice.