Analysts Turn Record-Bullish on S&P 500 (SPX) Just Before Historic Oct-Jul Upswing
The S&P 500 is hovering near record highs as it approaches a 269-day midterm-to-pre-election seasonal window that has delivered gains in every one of the past 15 cycles.

What is the seasonal pattern for S&P 500 (SPX)?
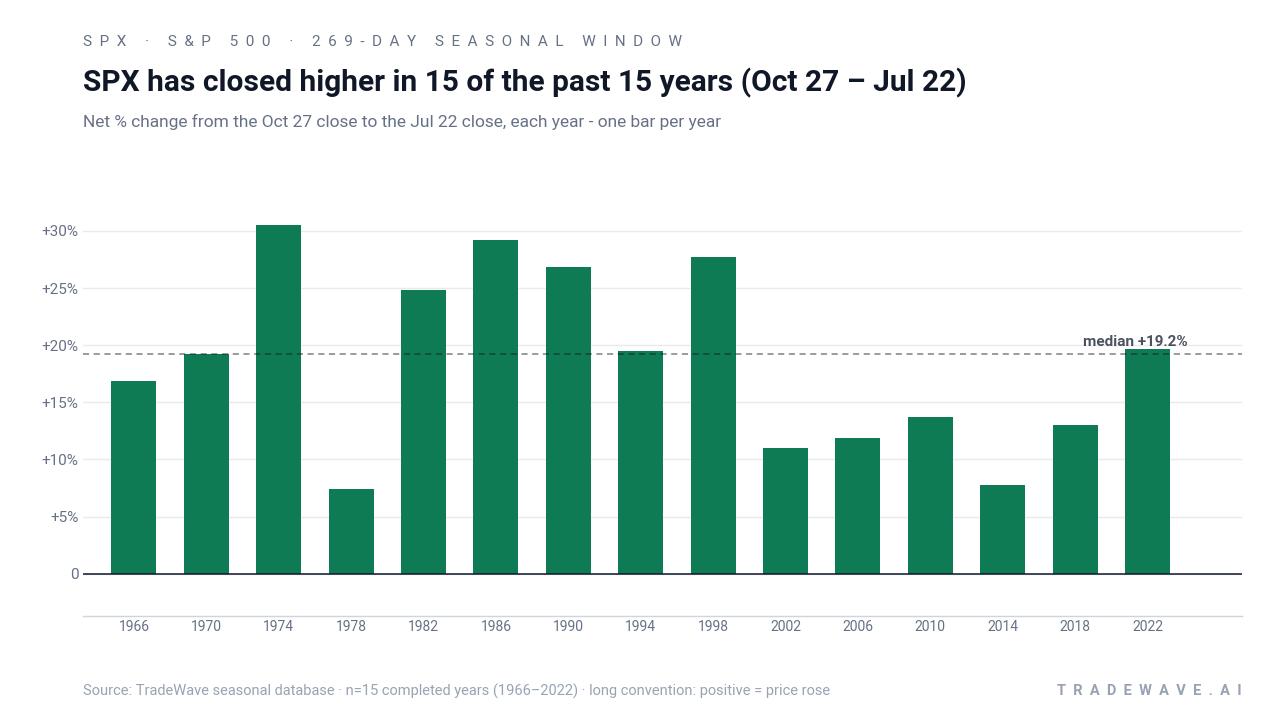
S&P 500 has risen in 15 of 15 midterm-to-pre-election windows starting Oct 27, with an average gain of 18.61% in winning years.
- 15 for 15 in this window, averaging 18.61% gains in winning years across the last 15 midterm election cycles.
- The upcoming 269-day trading window runs from Oct 27 through late July and has historically favored long exposure in SPX.
- Percent Profitable is 100.0%, with 15 winners and 0 losers across the sample.
- Median profit of 19.24% and a Sharpe ratio of 2.01 point to unusually strong, consistent risk-adjusted returns.
- The TradeWave Ratio of 2.08 signals that price has typically traveled meaningfully in the trade direction within the window.
- Individual years have still seen notable drawdowns inside the window, with adverse moves reaching double digits in weaker cycles.
According to historical data from TradeWave.ai, this midterm-to-pre-election stretch has behaved very differently from an average year on the calendar. The next section walks through what that long-run pattern has looked like and how it frames the coming 269-day window.
How has S&P 500 (SPX) traded in the midterm-to-pre-election window?
The seasonal window that begins on Oct 27 has produced gains for the S&P 500 in every one of the past 15 midterm election years, with average returns of 18.61% over 269 days. The index heads toward that window trading at 7,121.57, up 12.78% year to date and sitting about 8.9% below its 52-week high of 7,816.70.[2] That combination of a strong historical tailwind and a market that is already up double digits for the year makes this particular iteration of the pattern especially important to watch.
Grouping the data by presidential election cycle matters here because this window sits squarely in the handoff from the midterm election year into the year before the presidential election, a phase that has often coincided with friendlier policy tone and looser financial conditions. In prior cycles, that backdrop has lined up with stronger risk appetite and a tendency for broad indices like SPX to grind higher rather than chop sideways.
Historically, this 269-day stretch has been a long-biased regime for the index. Percent Profitable is 100.0%, with 15 winners and 0 losers, and the median gain of 19.24% is slightly higher than the average, which tells you the typical outcome has been a solid double-digit advance rather than a pattern dominated by a few outliers. The trade direction is explicitly long, so years with strong rallies are favorable outcomes for the pattern, while any hypothetical down year would be a clear break from the historical script.
The per-year table shows how that plays out in individual cycles. In 1998, for example, SPX gained 27.75% from the Oct 27 entry to the late-July exit, with a best intraperiod run-up of 33.32% and only a shallow 0.53% drawdown from entry at any point in the window. By contrast, 2002 still finished up 10.99% but saw a worst intraperiod decline of 11.38% from the starting level, a reminder that even “winning” years can feel rough in the middle.
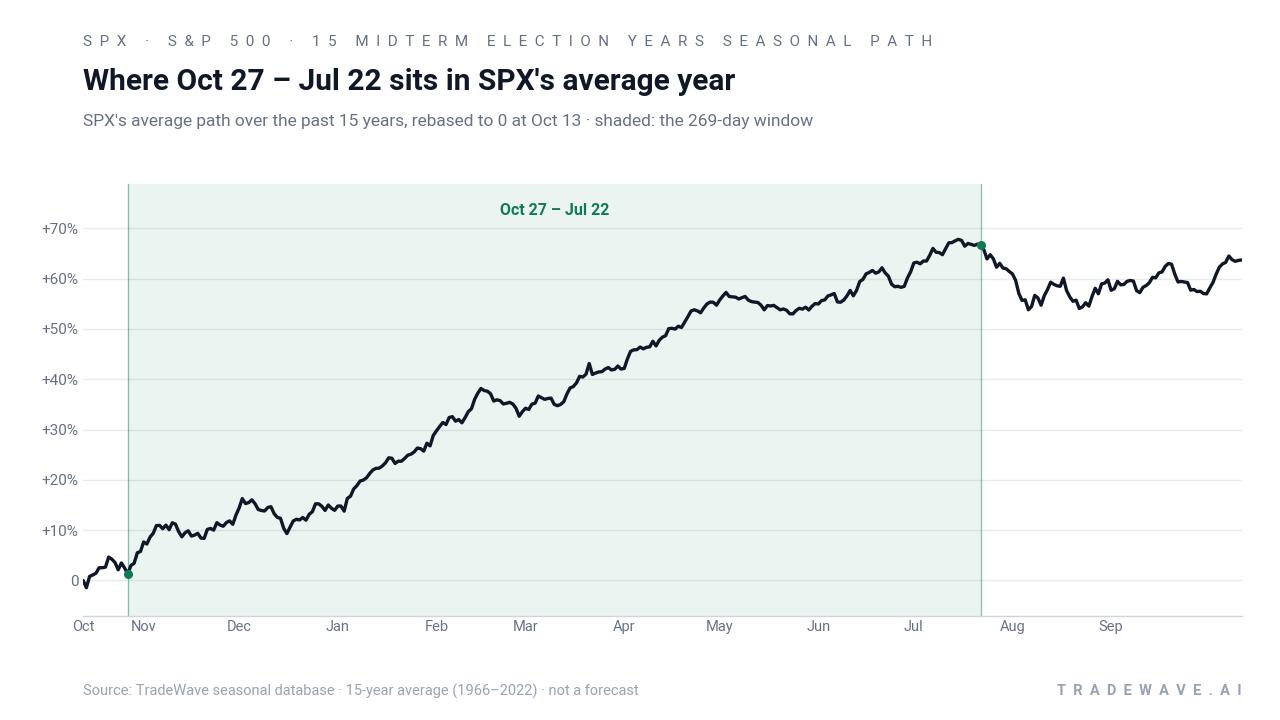
The historical seasonal average, built from these 15 midterm election years, shows the index tending to firm through late autumn, accelerate into the turn of the year, and then add gains more gradually into early summer. That profile is consistent with a backdrop where earnings revisions, fiscal dynamics and positioning often improve as investors look ahead to the pre-election year, which has itself been one of the stronger phases of the four-year cycle in many studies.
Year-by-year ranges show how much room there has been between the best rallies and the worst drawdowns inside this window.
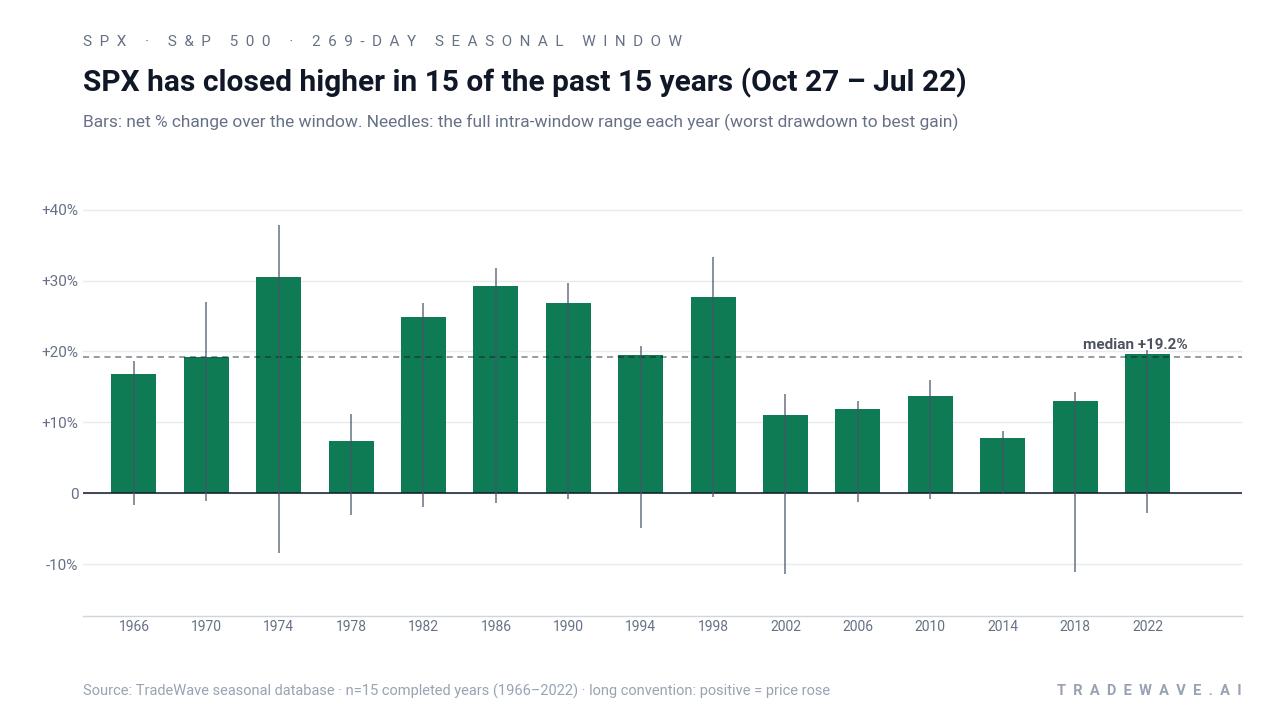
The combined net/MFE/MAE view shows a clear pattern: in most years, the maximum favorable move within the window has been meaningfully larger than the final net gain, while the maximum adverse move has usually been contained to single digits but has occasionally stretched into low double digits. That is what you would expect from a long-biased regime where pullbacks have tended to be buyable, yet the path has not been a straight line. Add it up and the cumulative return from stacking this window across the 15 cycles reaches 1,155.16%, which is unusually strong for any systematic slice of the calendar.
History does not guarantee future results; adverse excursions can still be large inside this window even when the final outcome is positive.
Why does S&P 500 (SPX) follow this seasonal pattern?
This pattern may reflect a mix of earnings season clustering, fiscal policy and institutional positioning around the presidential cycle. One likely driver is that the year before the presidential election has often featured more market-friendly policy tone and clearer guidance, which can support risk assets after the uncertainty of the midterm year. Portfolio managers also tend to rebalance and add equity exposure into year-end and early in the pre-election year when earnings visibility improves, reinforcing the historical midterm-to-pre-election seasonal trend.
What is driving S&P 500 (SPX) today?
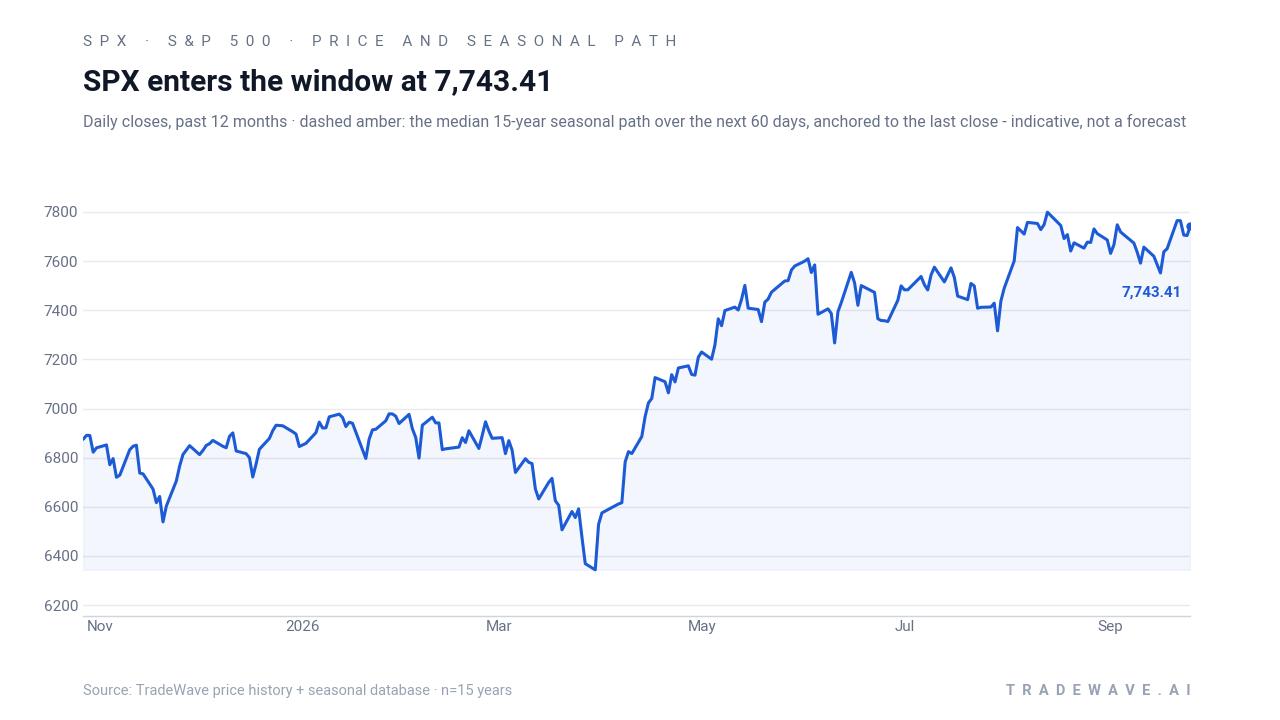
The S&P 500 ended the prior session at 7,121.57, up 0.17% on the day and 12.78% so far in 2026, leaving it about 8.9% below its 52-week high of 7,816.70 and comfortably above the 52-week low of 6,316.91.[2] That climb has unfolded against a backdrop of very bullish analyst sentiment, with one July report noting that nearly 60% of S&P 500 constituents carried Buy ratings and that bottom-up EPS growth forecasts for the index were running well above historical norms, a setup that can leave little room for disappointment if earnings or macro data slip.[1]
The chart below situates the latest move in its recent multi-month context alongside the median seasonal path.
In July 2026, analysts were already warning that such stretched expectations and a high concentration of Buy ratings could set the stage for a “summer failure” if results did not keep pace with the optimism.[1] Earlier in the year, technical work pointed to a market that had improved on shorter-term charts but still faced bearish signals on monthly and quarterly time frames, including downside targets around 6,150, underscoring the gap between long-term caution and the index’s strong year-to-date performance.[3] That tension between lofty earnings hopes, lingering technical concerns and an approaching historically strong seasonal window is the backdrop as SPX moves through the final weeks of the midterm election year.
Sources
About this seasonal analysis
Seasonal pattern data is sourced from TradeWave.ai, which analyzes historical price behavior across annual calendar windows going back up to 30 years. Read the full data methodology or the book The 100-Year Pattern by Afshin Moshrefi (2026 edition). Past performance of seasonal patterns does not guarantee future results. This article is for informational purposes only and does not constitute investment advice.