8-for-8 Midterm Run: Costco (COST) Has Averaged 17.58% Gains From Oct. 22 to Aug. 1
Costco is rallying after a strong earnings beat just weeks before it enters a midterm-year seasonal window that has never produced a losing year, sharpening the focus on how the stock trades into next summer.
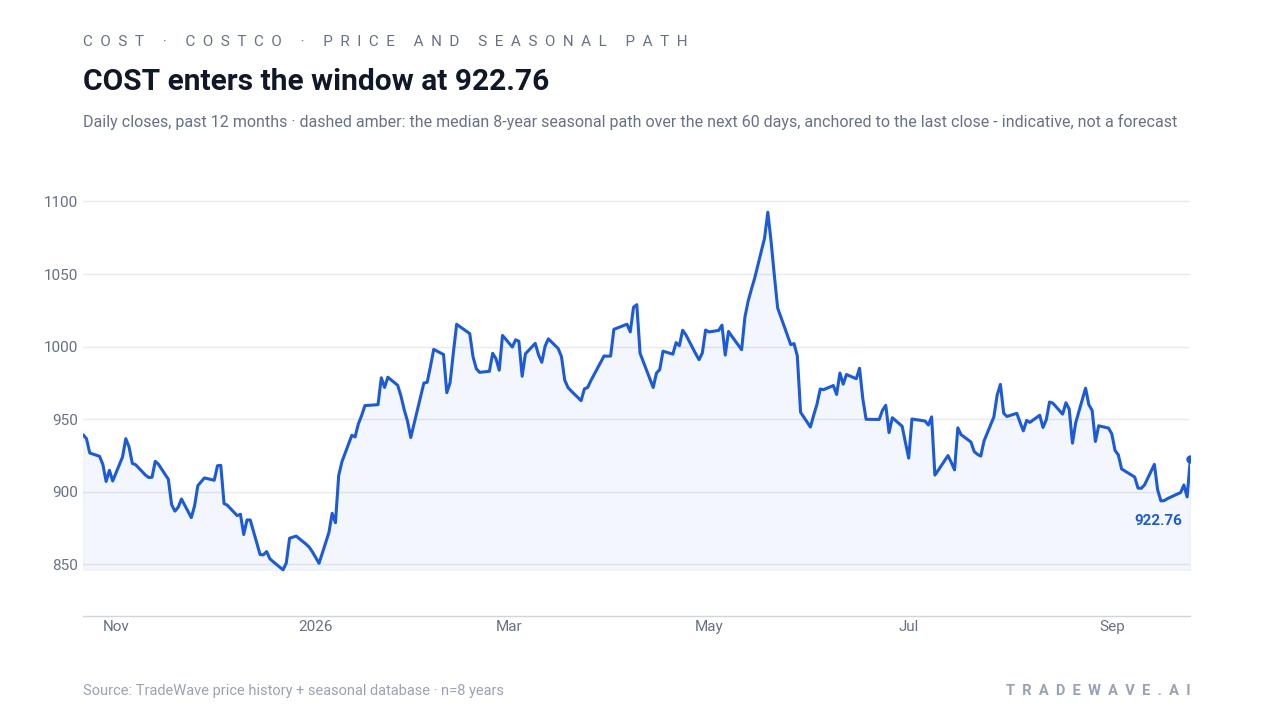
Price as of Sep 25, 2026: $922.76 (last close).
What is the seasonal pattern for Costco (COST)?
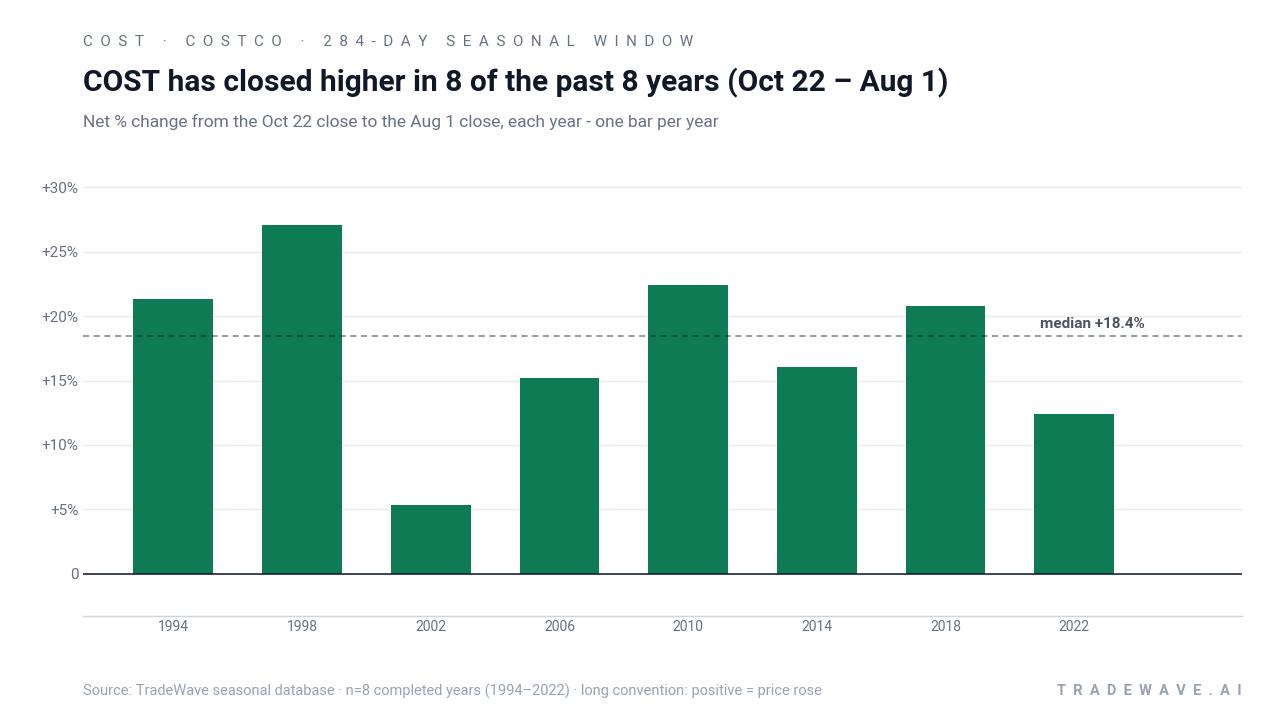
Costco has risen in 8 of 8 midterm-election-year windows running from Oct. 22 to Aug. 1, with an average gain of 17.58% in winning years.
- 8 for 8 in this window, with Costco gaining an average 17.58% across all completed midterm-year cycles.
- Seasonal window runs 284 days from Oct. 22 to Aug. 1, covering the handoff from the midterm election year into the year before the presidential election.
- Percent Profitable is 100.0%, with 8 winners and 0 losers in the historical sample.
- Average winner profit is 17.58%, compounding to a 260.9% cumulative return when the window is stacked across the eight cycles.
- Intraperiod swings have been meaningful, with individual years showing double-digit peak gains and, in some cases, sizeable drawdowns before finishing higher.
- The pattern aligns with a broader consumer and policy backdrop that has often favored membership retail as markets transition from midterm uncertainty into pre-election-year growth.
According to historical data from TradeWave.ai, this specific Oct. 22 to Aug. 1 stretch has behaved very differently from an average year for Costco. The next section walks through what that election-cycle pattern has looked like and how it frames the coming months.
How has Costco (COST) traded in the Oct. 22 to Aug. 1 midterm-year window?
Costco has risen in 8 of the last 8 midterm-election-year windows starting on Oct. 22, averaging a 17.58% gain over 284 days. Shares finished the prior session at $922.77, up 2.9% on the day and about 15.6% below their 52-week high, after a post-earnings surge. That combination of a flawless historical win record and a stock that is still off its highs gives this upcoming Costco trading window unusual weight for investors watching the consumer sector.
The presidential election cycle matters here because this pattern only looks at the last eight midterm election years, then follows Costco through the transition into the year before the presidential election. That is often when Washington policy uncertainty fades, fiscal and monetary settings stabilize, and risk appetite in consumer and retail stocks tends to improve.
Historically, this 284-day Costco seasonal trend has been firmly bullish for long exposure. Percent Profitable sits at 100.0%, with 8 winners and 0 losers, and the average profit of 17.58% matches the all-years result because there have been no losing windows in the sample. The median outcome of 18.43% is close to the average, which suggests the gains have been relatively clustered rather than driven by a single outlier year.
The per-year table shows how those returns have played out. The strongest window came in 1998, when Costco gained 27.05% between the Oct. 22 entry and the Aug. 1 exit, with a best intraperiod run-up of 61.64% from the starting level. At the other end of the spectrum, 2002 delivered the weakest net result at 5.31%, and that year also saw one of the deepest intraperiod drawdowns, with the worst move from entry reaching a 22.46% decline before the stock recovered to finish higher.
That mix of strong final gains and sometimes sharp swings shows up in the volatility profile. The annualized return across the eight cycles is 17.4%, while the standard deviation of outcomes is 6.79%, and the Sharpe ratio of 2.13 points to unusually strong risk-adjusted performance for this Costco seasonal pattern. The TradeWave Ratio of 1.53 indicates that, within the window, price has typically traveled meaningfully in the trade direction, reflecting substantial intraperiod upside moves even beyond the final close.
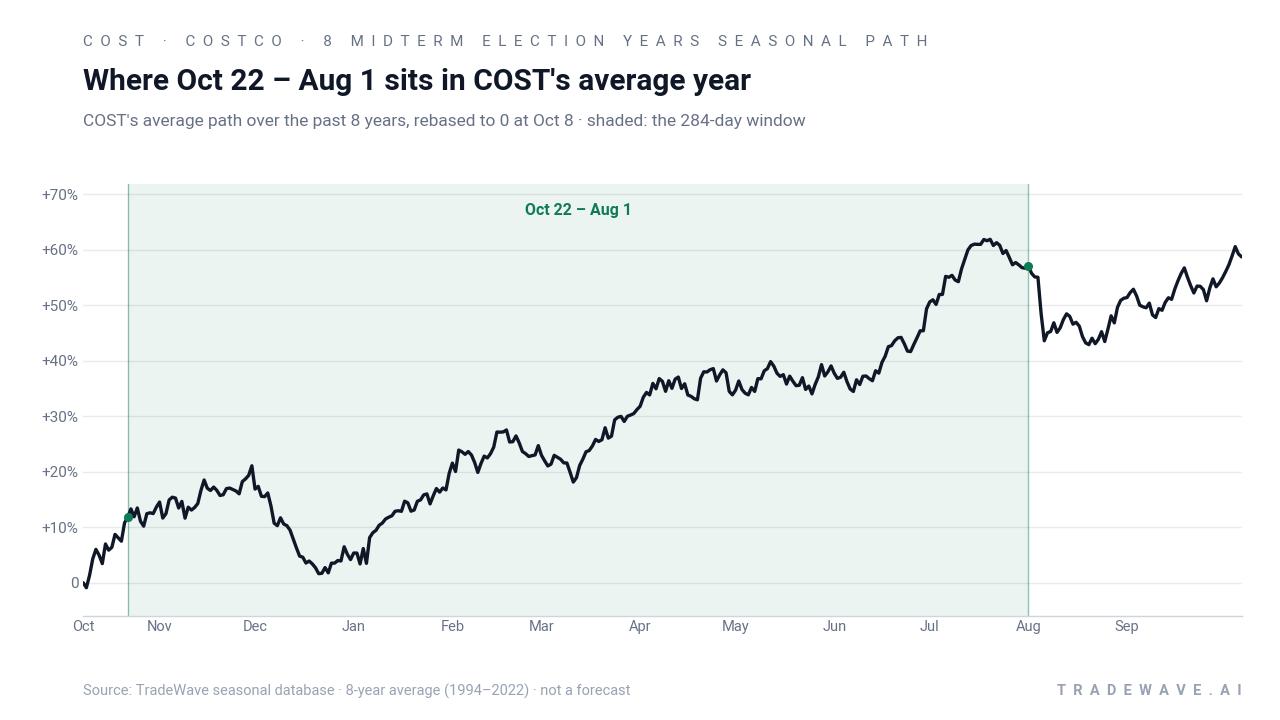
The historical seasonal average chart suggests that Costco’s gains in this window have tended to build gradually rather than in a single burst. In prior cycles, the stock has often firmed through the late fall, accelerated into the holiday and early-year period, and then continued to grind higher into the summer, consistent with a long trade that benefits from both consumer spending and improving macro visibility.
Year-by-year ranges show how much Costco has typically swung inside the window before locking in those gains.
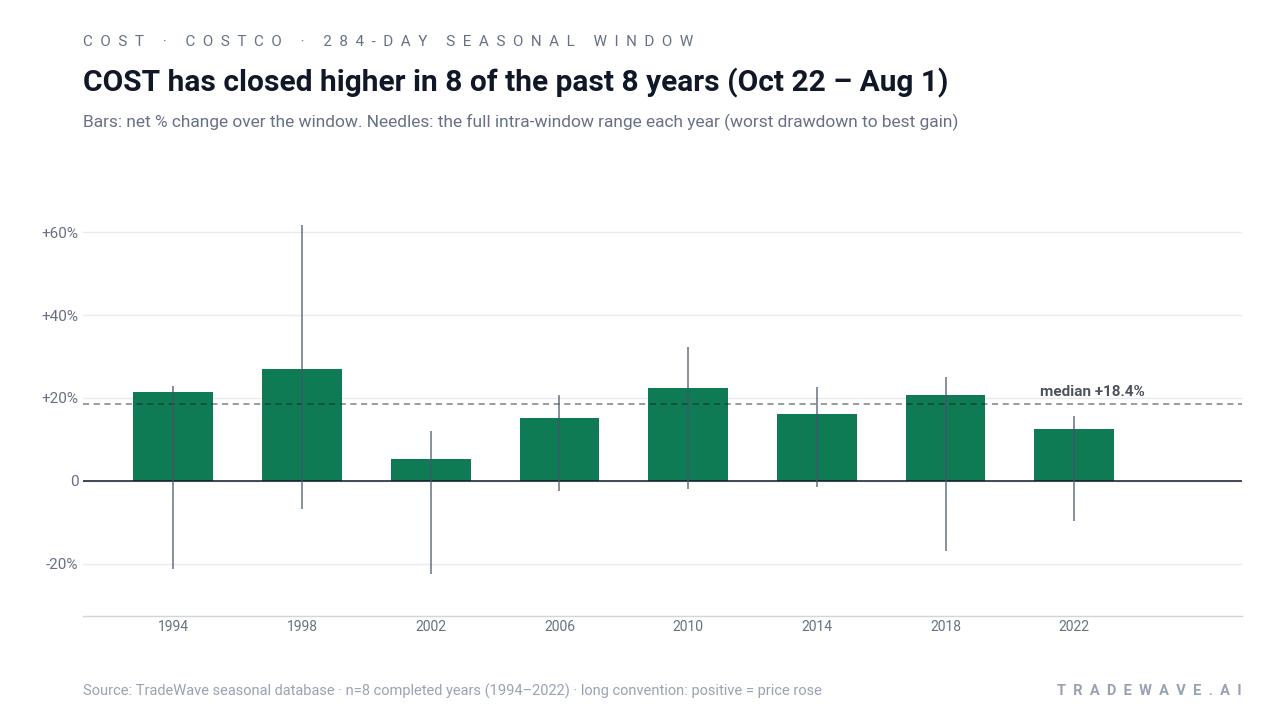
The combined net, best-case, and worst-case bar chart underlines that even a perfect win record has come with real risk. In several years, Costco’s maximum favorable move within the window has pushed well beyond the final gain, while the maximum adverse move has at times reached double-digit losses from the entry before the stock recovered. That profile fits a long pattern where upside has ultimately prevailed, but where timing and tolerance for drawdowns have mattered.
History does not guarantee future results; adverse excursions can be large even in winning windows, and past seasonal behavior may not repeat.
Why does Costco (COST) follow this seasonal pattern?
One likely driver is the clustering of Costco’s fiscal calendar and earnings reports around the holiday season and into the first half of the following year, which can amplify moves in a stock tied closely to consumer spending. Analysts have also pointed to institutional portfolio repositioning around midterm elections, with investors often rotating back into defensive growth and membership retail as policy uncertainty clears. The pattern may also reflect recurring consumer cycles, as Costco’s value-focused model tends to benefit when households lean into bulk buying and membership renewals during periods of elevated living costs.
What is driving Costco (COST) today?
Costco closed at $922.77 on Sep 25, up 2.9% on the day, as investors digested a fresh set of quarterly results that topped Wall Street expectations. The stock is trading above its 50-day moving average of $934.15 and has pulled back from a 52-week high near $1,093, leaving it about 15.6% below that peak while still well above the 52-week low around $836.66. The latest move follows a fiscal fourth-quarter report on Sep 24 that delivered revenue of $95.7 billion and adjusted earnings per share of $6.75, both ahead of consensus, helped by strong e-commerce growth and a one-time $0.15 per-share benefit from tariff refunds under IEEPA.[1]
Fresh earnings have reinforced the core Costco story that has powered the stock’s long-term uptrend. Net sales for the 16-week quarter rose 11.2% year over year to $93.9 billion, underscoring resilient demand for value-oriented staples even as consumers remain sensitive to higher living costs.[1] Earlier in the year, Costco also beat holiday-quarter comparable sales estimates, with membership fees and digital channels contributing meaningfully to growth, a reminder that the company’s subscription model and online reach continue to differentiate it within big-box retail.[3] Sector analysts have highlighted that membership fees are a key profit driver and help cushion margins against promotional pressure, which can matter in choppy macro environments.[4]
Macro context has been supportive as well. Resilient holiday-season demand for affordable essentials and value items has helped Costco navigate inflationary pressure, with shoppers trading down from higher-priced formats but still spending on bulk purchases and private-label goods.[3] At the same time, tariff refund dynamics tied to IEEPA have provided a modest, non-recurring tailwind to earnings, while also reminding investors that trade policy shifts can ripple through retailer profit models.[1] Against that backdrop, Costco’s current price strength heading into a historically powerful seasonal window gives traders a clear set of levels to watch: whether the stock can hold above recent support in the high $800s and how it behaves as the Oct. 22 window opens.
The chart below situates the latest move in its recent multi-month context and overlays the median historical seasonal path for the next 60 days.
What should traders watch as this Costco seasonal window approaches?
First, the calendar. The 284-day window begins on Oct. 22, just as markets move from the concluding midterm election year into the year before the presidential election, a phase that has often coincided with stronger risk appetite and more supportive policy tone. How Costco trades around that date, especially after a strong earnings beat, will show whether investors are leaning into the historical pattern or fading it.
Second, price levels. Traders will be watching whether Costco can reclaim and hold above its 50-day moving average near $934 and then challenge resistance closer to the $1,000 mark. A pattern of higher lows into the start of the window would rhyme with prior cycles where the stock entered the Oct. 22 date with constructive momentum, while a break back toward the mid-$800s would signal a more cautious setup.
Third, macro and policy catalysts. Any shifts in trade policy, tariff regimes, or consumer spending data could interact with Costco’s membership-driven model in ways that either reinforce or blunt the historical seasonality. Updates on tariff refund processes and broader discussions around import levies will be particularly relevant given the recent IEEPA-related earnings boost.[1] Consumer confidence readings and retail sales reports through the holiday season will also help determine whether the backdrop resembles prior strong midterm-to-pre-election transitions.
Finally, behavior inside the window will be key. In past cycles, Costco has sometimes endured sizeable drawdowns before finishing the window with solid gains, so traders will be watching not just direction but also the depth and timing of any pullbacks. If the stock rallies into and through the Oct. 22 start date and then follows a path of steady, stair-step advances with contained downside, that would be consistent with the historical 8-for-8 record. A sharp break that fails to recover, by contrast, would mark a clear departure from the established Costco seasonal trend and signal that this midterm-year pattern may be changing.
Sources
- Yahoo Finance - Costco tops Q4 estimates: Revenue hits $95.7B on massive e-commerce surge
- Seeking Alpha - Costco beats sales and profit expectations as comparable sales continue to surge
- Reuters - Costco Wholesale beats holiday-quarter comparable sales estimates on resilient demand
- Yahoo Finance - Costco’s Entire Profit Model Threatened As Customer Sues For Refund
About this seasonal analysis
Seasonal pattern data is sourced from TradeWave.ai, which analyzes historical price behavior across annual calendar windows going back up to 30 years. Read the full data methodology or the book The 100-Year Pattern by Afshin Moshrefi (2026 edition). Past performance of seasonal patterns does not guarantee future results. This article is for informational purposes only and does not constitute investment advice.