Options Leverage Keeps S&P 500 (SPX) Fragile Heading Into Historically Bullish Oct 31 Stretch
The S&P 500 is hovering just below record territory as it heads toward a 265-day midterm-to-pre-election seasonal window that has never posted a loss in this dataset.

What is the seasonal pattern for S&P 500 (SPX)?
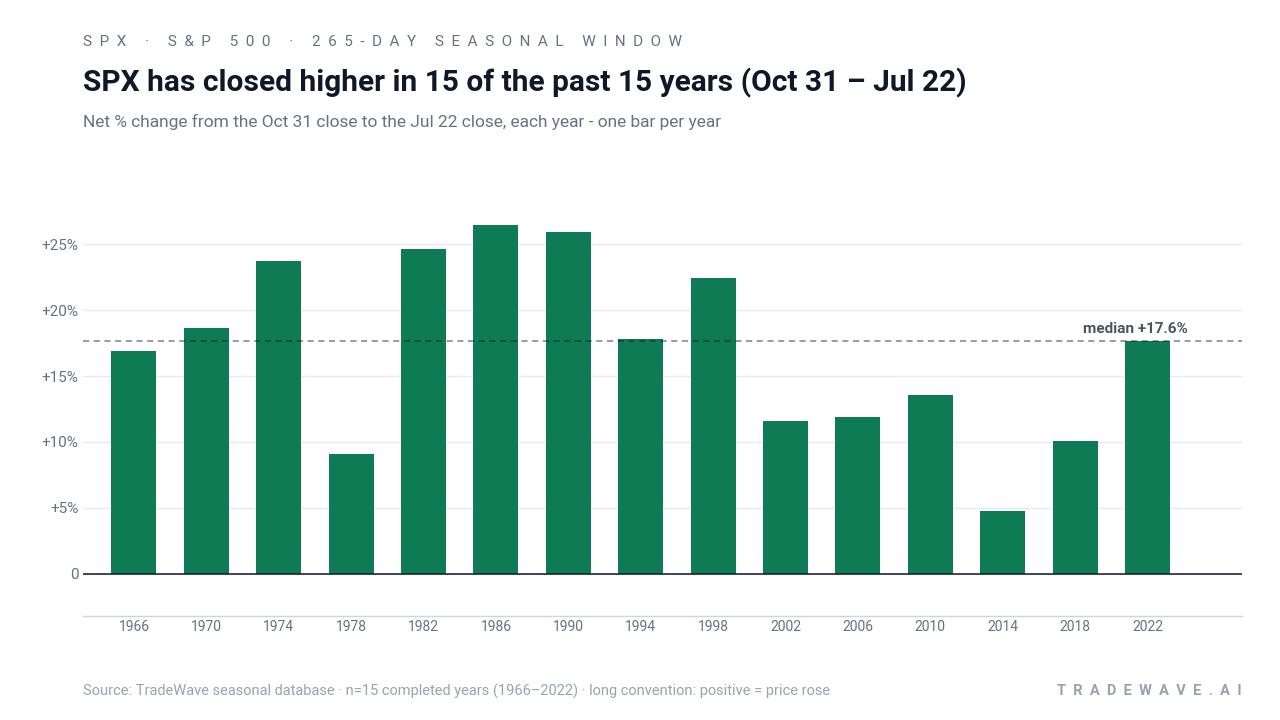
S&P 500 has risen in 15 of 15 midterm-to-pre-election windows starting Oct. 31, with an average gain of 17.01% in winning years.
- 15 for 15 in this window, with S&P 500 averaging 17.01% gains across all winning years.
- Seasonal window runs from Oct 31 through late July, spanning 265 calendar days in the presidential midterm election year cycle.
- Percent Profitable is 100.0%, with 15 winners and 0 losers across the last 15 midterm election years in this pattern.
- Average winner gain of 17.01% comes with a Sharpe ratio of 2.1, indicating strong risk-adjusted returns for this long setup.
- The TradeWave Ratio of 2.19 suggests price has typically traveled meaningfully in the trade direction within the window, beyond just the final close.
- Individual years have still seen notable drawdowns inside the window, with adverse moves reaching double digits before recovering in some cycles.
According to historical data from TradeWave.ai, this upcoming stretch behaves very differently from an average year for the index, with a distinct midterm-to-pre-election profile that traders rarely see laid out in one place.
How strong is the upcoming seasonal window for S&P 500 (SPX)?
S&P 500 has closed higher in every one of the last 15 midterm election years during the Oct 31 to late-July window, averaging gains of 17.01% for long exposure. The index finished the prior session at 7,109.14, leaving it about 0.5% below its 52-week high of 7,147.52 and roughly 12.6% above its 52-week low of 6,316.91. Elevated options activity and leverage have previously been flagged as making the market more fragile to abrupt swings, which could amplify how this long seasonal regime plays out in practice.[1]
The pattern is built on the last 15 midterm election years, a phase where policy uncertainty tends to fade and fiscal and regulatory agendas for the back half of the presidential term are clearer. That backdrop often coincides with a shift from defensive positioning in the early midterm months to more risk-on behavior as investors look ahead to the pre-election year, which has historically been one of the strongest parts of the cycle for equities.
This specific window begins on Oct 31 and runs 265 days into late July, overlapping the long midterm-to-pre-election regime often referred to as the “100-Year Pattern” in seasonal work on the S&P 500. In this dataset, the long trade direction has been rewarded every time, with 15 winners and no losing years, and a median gain of 17.63% that is close to the average, suggesting the results are not just driven by one or two outliers.
Looking at individual years, the strongest outcomes include 1986, 1990 and 1998, where the index logged net gains of 26.43%, 25.95% and 22.43% respectively over the window. Even the softer years, such as 2014’s 4.76% rise, still finished positive, which is unusual for such a long stretch that includes multiple earnings seasons, Fed meetings and geopolitical shocks.
The intraperiod path has not been a straight line. In 2002, for example, S&P 500 gained 11.56% from entry to exit, but at one point was down 10.94% from the starting level before recovering. In 2018, the index finished the window up 10.08% but endured a worst drawdown of 13.47% along the way, underscoring that even “all green” seasonal windows can contain sharp air pockets.
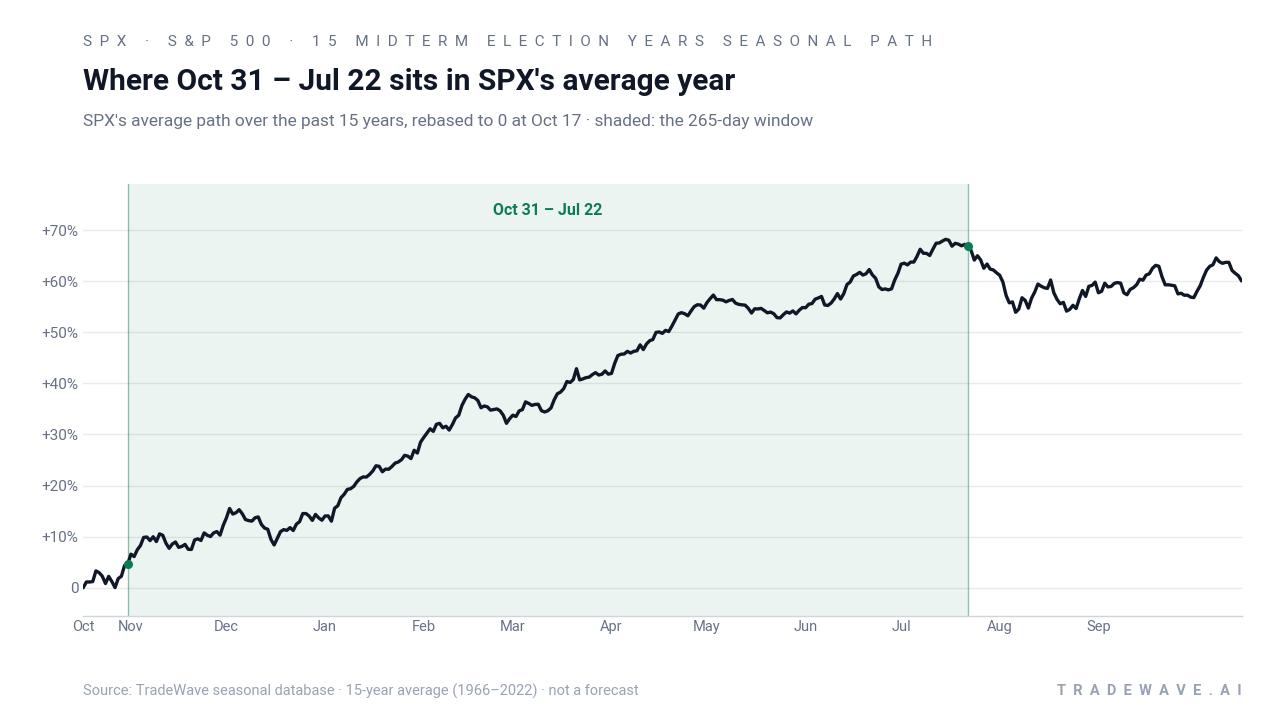
The combined net, best-case and worst-case moves by year show how upside and downside have coexisted inside this bullish window.
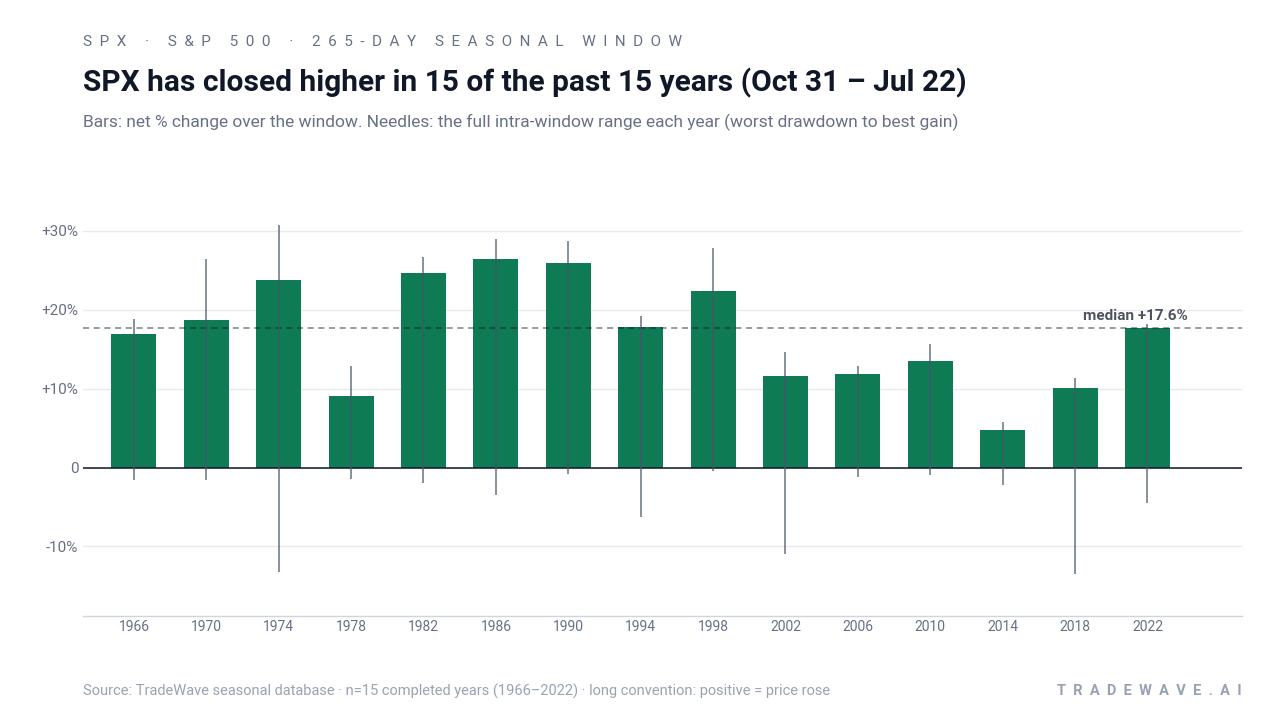
The bar-and-range profile shows that maximum favorable moves have often pushed into the mid-teens or higher, while maximum adverse moves have at times reached high single digits or low double digits before the index finished the window in the green. That combination of sizable MFE and meaningful MAE is typical of a long bullish regime that still contains tradable pullbacks and volatility spikes.
History does not guarantee future results; adverse excursions can be large even in winning windows, and past seasonal strength does not eliminate macro or policy risk.
Why does S&P 500 (SPX) follow this seasonal pattern?
One likely driver is the way the presidential election cycle shapes policy visibility and risk appetite, with midterm election years often seeing heavy political noise early on and clearer fiscal and regulatory paths by late autumn. Analysts have also pointed to institutional portfolio rebalancing, as managers shift from defense to offense heading into the historically strong pre-election year, and to earnings season clustering that tends to reward growth expectations in the first half of that year. The result is a recurring pattern where the Oct 31 to late-July stretch in midterm election years has leaned strongly bullish for the S&P 500, even as it has contained sharp interim drawdowns.
What is driving S&P 500 (SPX) today?
S&P 500 slipped 0.24% in the prior session to 7,109.14, leaving it about 0.5% below its 52-week high of 7,147.52 and well above its 52-week low of 6,316.91. The pullback comes against a backdrop of lingering geopolitical risk in the Middle East and concern that markets may be pricing a best-case outcome on Iran and US negotiations, leaving room for disappointment if talks falter.[1] Strategists have also warned that elevated options activity and leverage have made the index more vulnerable to abrupt swings, with one February analysis from Goldman Sachs lifting the estimated risk of another sizable drawdown after a bout of volatility and slowing momentum.[1]
In June 2026, Bank of America highlighted technical signals suggesting the S&P 500 could struggle in the third quarter, flagging a potential downside scenario of up to 6% as breadth narrowed and leadership concentrated in large technology names.[3] Earlier in the year, reports detailed a sharp, isolated spike in S&P 500 e-mini futures volume minutes before a market-moving social media post from President Trump, alongside allegations of insider trading and calls for more transparency around White House transaction reports.[2] Those episodes fed into a broader narrative about market structure, where heavy use of options and rapid-fire positioning can turn political headlines into outsized index moves.
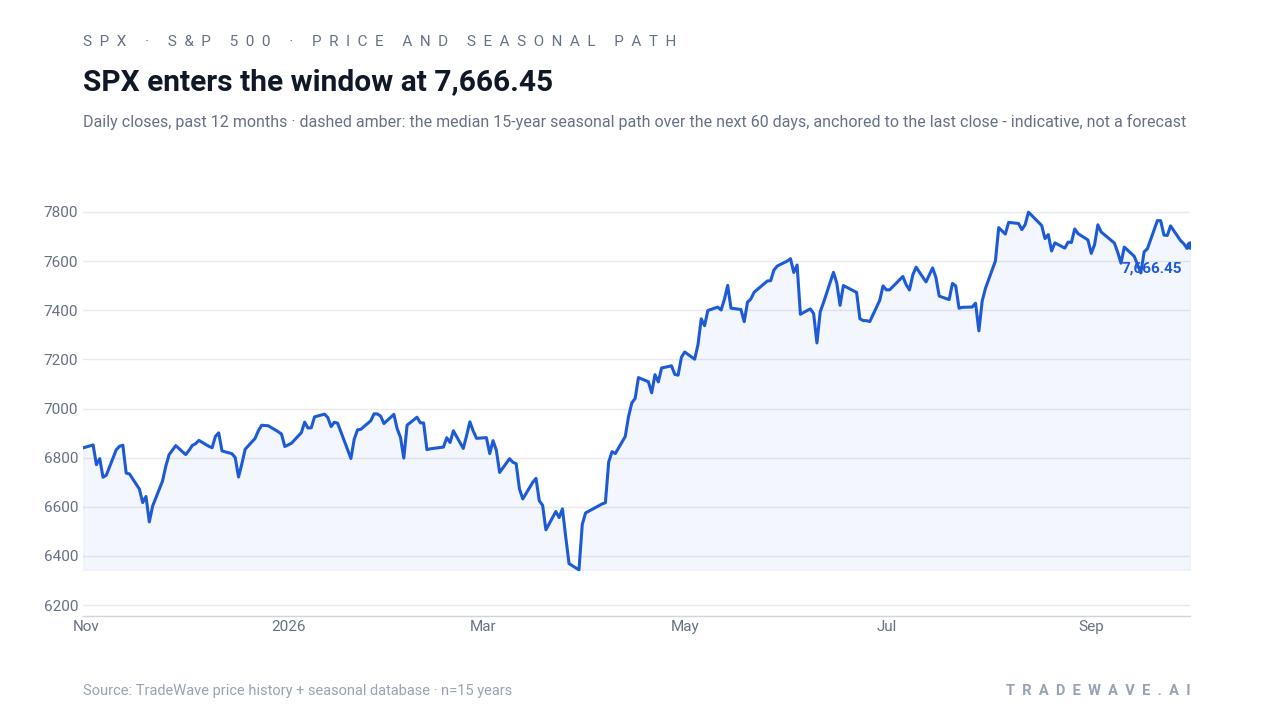
The chart below places the latest consolidation against the past year of trading and the median 60-day seasonal path.
What should traders watch as this S&P 500 seasonal window approaches?
First, the calendar: the 265-day midterm-to-pre-election window opens on Oct 31, so the next few weeks are about positioning rather than execution. How the index behaves into that date will shape how stretched or under-owned it is as the historical tailwind kicks in. A market that drifts sideways near the highs sets up a different risk-reward profile than one that corrects 5% to 6% into the start of the window.
Second, watch policy and geopolitical headlines, especially around the Middle East and US fiscal debates, which have been cited as key swing factors for risk sentiment.[1] Any breakdown in negotiations or surprise in the policy calendar that sparks a volatility spike could create the kind of intraperiod drawdowns that past midterm-year windows have absorbed before finishing higher.
Third, keep an eye on options activity and futures volume around major news events. Earlier in 2026, analysts pointed to extremely elevated S&P 500 options trading and unusual futures volume spikes tied to political headlines, raising questions about how leverage and potential information advantages might be shaping intraday moves.[1][2] If that pattern of heavy options flow and sudden volume bursts persists into and through the Oct 31 window, it could magnify both the favorable and adverse excursions that have historically defined this seasonal stretch.
Finally, the key confirmation signal for this historical pattern will be whether pullbacks inside the window continue to resolve higher, as they have in prior midterm election years. A sequence where 5% to 10% dips are bought and the index grinds to new highs into the pre-election year would rhyme with the past. A break of that behavior, especially if accompanied by fading breadth and sustained options-driven stress, would be an early sign that this cycle may be diverging from the long-term seasonal script.
Sources
- Business Insider - Stock Market Outlook: Signal of Deeper S&P 500 Sell-Off Are Flashing
- Yahoo Finance - Trump Insiders 'Getting Richer' Off S&P 500 Spike: Adam Schiff Demands White House 'Transaction Reports' Ahead Of Iran Pivot Post
- Yahoo Finance - BofA warns the S&P 500 is flashing technical signals that a ...
About this seasonal analysis
Seasonal pattern data is sourced from TradeWave.ai, which analyzes historical price behavior across annual calendar windows going back up to 30 years. Read the full data methodology or the book The 100-Year Pattern by Afshin Moshrefi (2026 edition). Past performance of seasonal patterns does not guarantee future results. This article is for informational purposes only and does not constitute investment advice.