S&P 500 Technology Sector SPDR (XLK) Has Risen in 6 of 6 Midterm Oct-May Windows, Averaging 12.02%
S&P 500 Technology Sector SPDR is approaching a late-October seasonal window that has delivered gains in every midterm-year sample, just as tech leadership and AI demand keep the sector in focus.

What is the seasonal pattern for S&P 500 Technology Sector SPDR (XLK)?
S&P 500 Technology Sector SPDR has risen in 6 of 6 midterm-year Oct 25–May 3 windows, with an average gain of 12.02% in winning years.
- 6 for 6 in this window, with S&P 500 Technology Sector SPDR averaging 12.02% gains across all completed midterm-year cycles.
- Seasonal window runs 191 days from Oct 25 to May 3, covering the handoff from the midterm election year into the pre-election year.
- Percent Profitable is 100.0%, with 6 winners and 0 losers in the historical sample.
- Average winner profit is 12.02%, supported by a Sharpe ratio of 3.87 that signals unusually strong risk-adjusted returns.
- The TradeWave Ratio of 2.66 indicates that price has typically traveled meaningfully in the long direction within the window, not just at the close.
- Intraperiod swings have been real, with some years seeing double-digit drawdowns before finishing higher, so timing and risk controls still matter.
According to historical data from TradeWave.ai, this late-October stretch has behaved very differently from an average tech month in prior midterm election years. The next section walks through how that pattern has played out and where the risk has tended to cluster.
How has S&P 500 Technology Sector SPDR (XLK) traded from late October into May?
From late October of midterm election years through early May of the following pre-election year, S&P 500 Technology Sector SPDR has posted gains in every one of the last six cycles, averaging a 12.02% advance over the 191-day window. That stretch begins again on Oct 25, with XLK coming off a strong one-month move of 7.99% and sitting close to its 52-week high of 198.54. Grouping the data by the presidential election cycle matters here because this window captures the policy shift from a concluding midterm election year into the historically more risk-on pre-election year, when fiscal and regulatory visibility often improve for large-cap tech.
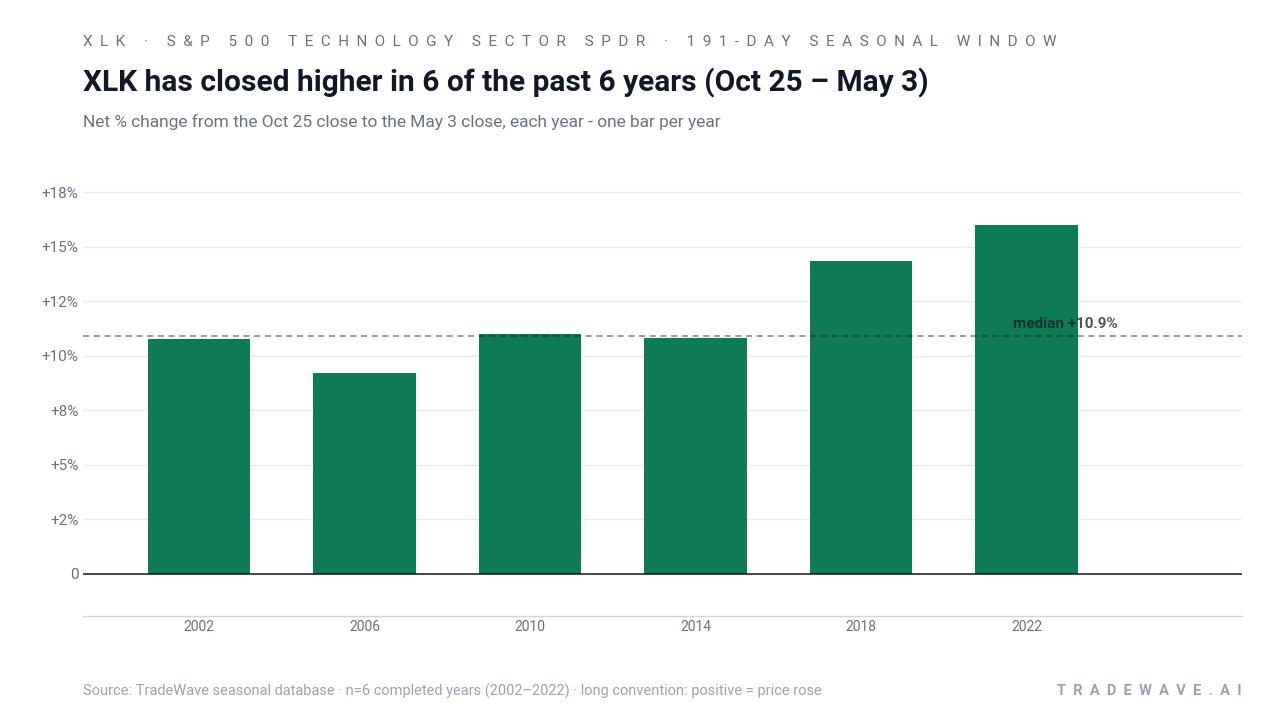
Across the six midterm-year samples from 2002 through 2022, the trade direction for this pattern is firmly long. Percent Profitable sits at 100.0%, with 6 winners and 0 losers, and the average profit of 12.02% matches the all-years average because there were no down windows. The median outcome of 10.9% shows that the gains have not been driven by a single outlier year, and an annualized return of 11.99% with a 2.57% standard deviation translates into a Sharpe ratio of 3.87, which is high for a single recurring slice of the calendar.
The per-year table shows how those returns have stacked up. The weakest net gain in the sample came in 2006, when XLK still added 9.21% between Oct 25 and May 3, while the strongest year was 2022 with a 15.98% rise despite a volatile macro backdrop. In 2018, the ETF advanced 14.33% over the window, but that year also carried the deepest intraperiod stress, with a worst drawdown of 16.78% before the trade finished in the green. Add it up: compounding the six completed windows produces a cumulative gain of 97.28% for this specific midterm-to-pre-election stretch.
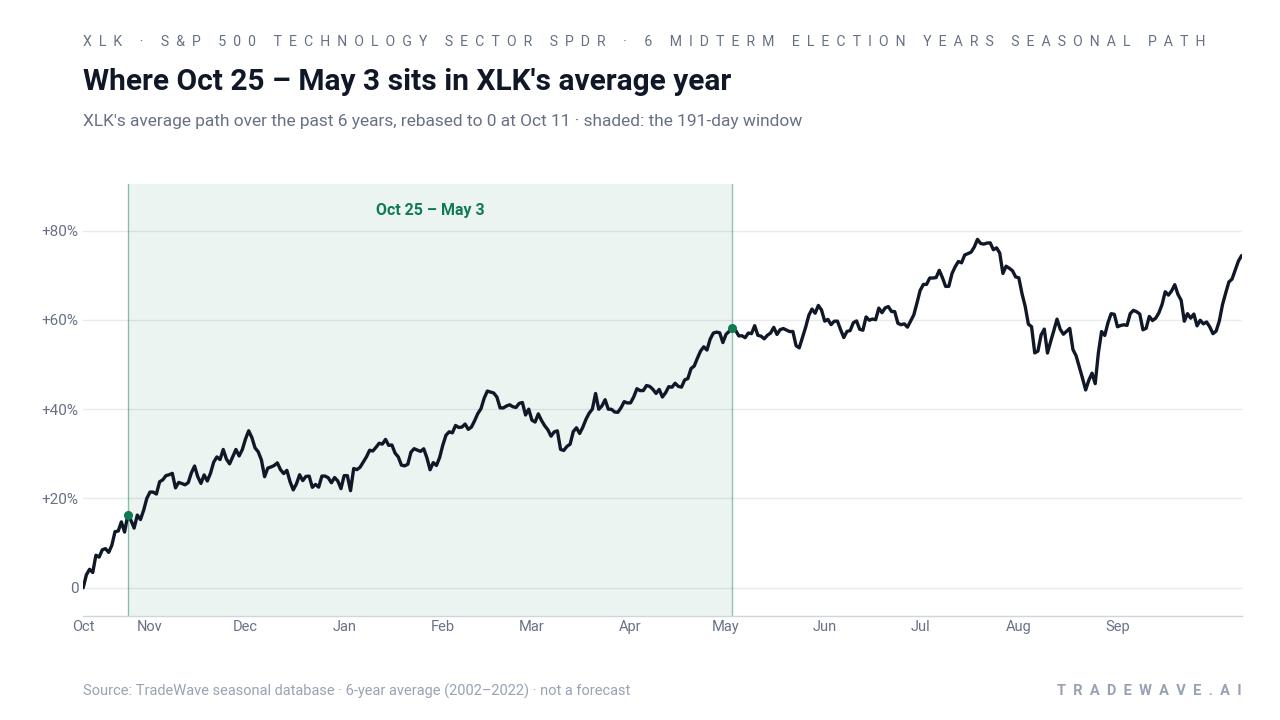
The historical seasonal average suggests that XLK’s typical path in this window is a steady grind higher rather than a single explosive burst. Returns tend to build as the calendar moves deeper into the pre-election year, consistent with the broader pattern of stronger risk appetite once midterm political uncertainty clears. The trend statistics labeled “Trend Long” at 70 and “Trend Long1” at 67 indicate that a majority of days within the window have historically leaned in favor of the long side, not just the final close.
Year-by-year bars of net returns, best rallies and worst drawdowns show how much XLK has swung inside this window before settling at those positive finishes.
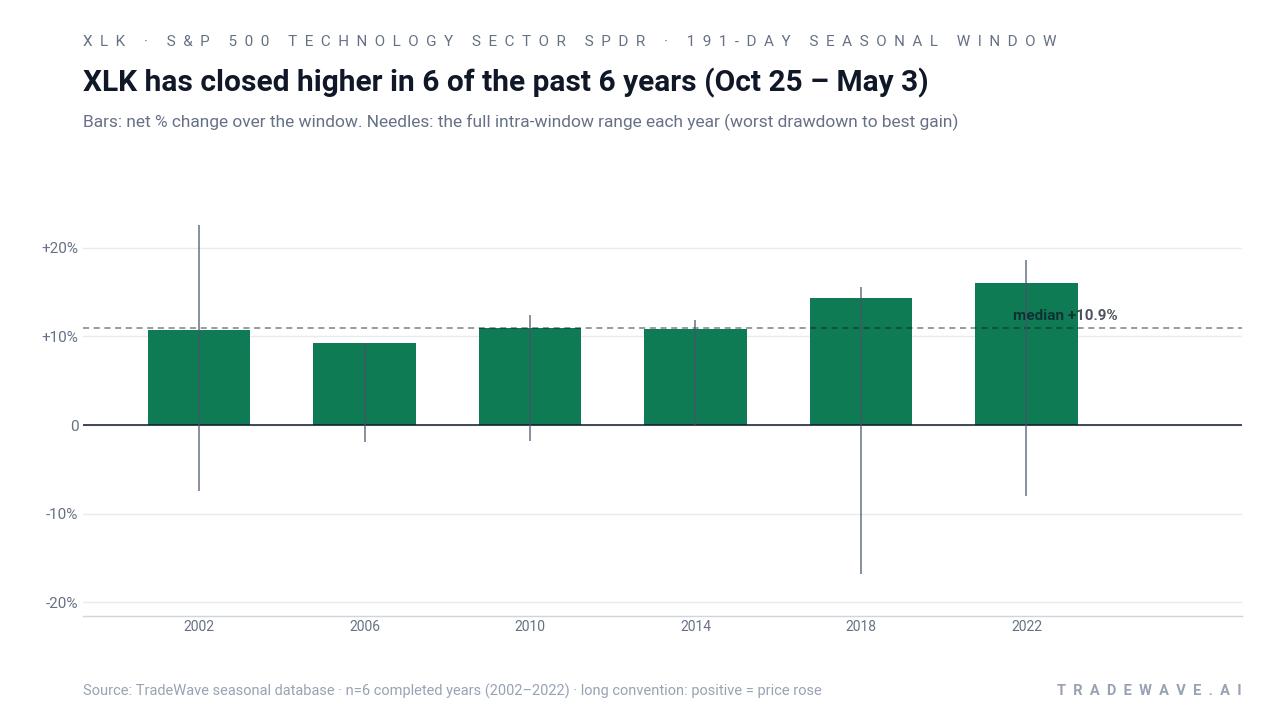
The maximum favorable move, or best intraperiod rally, has typically run ahead of the final net gain, with MFE readings such as 22.51% in 2002 and 18.64% in 2022 showing how far XLK has sometimes pushed before the window closed. On the downside, maximum adverse moves have ranged from almost no drawdown in 2014 to that 16.78% slide in 2018, underscoring that even a historically strong tech seasonal window can include sharp pullbacks. The TradeWave Ratio of 2.66 captures this dynamic by measuring how far price usually travels in the trade direction within the window, independent of where it finishes.
History does not guarantee future results; adverse excursions can be large even in winning windows, and past seasonal strength does not eliminate the risk of a different outcome in the next cycle.
Why does S&P 500 Technology Sector SPDR (XLK) follow this seasonal pattern?
One likely driver is the way the tech earnings calendar and corporate spending cycles line up with the midterm-to-pre-election handoff. Many XLK constituents guide for the coming year in late fall and early winter, and improved visibility on capital spending, AI infrastructure budgets and cloud demand can support the sector into spring. Analysts have also pointed to institutional portfolio rebalancing and sector rotation after midterm elections, as investors shift back toward growth and technology once policy risk around regulation and taxation looks more settled.
What is driving S&P 500 Technology Sector SPDR (XLK) today?
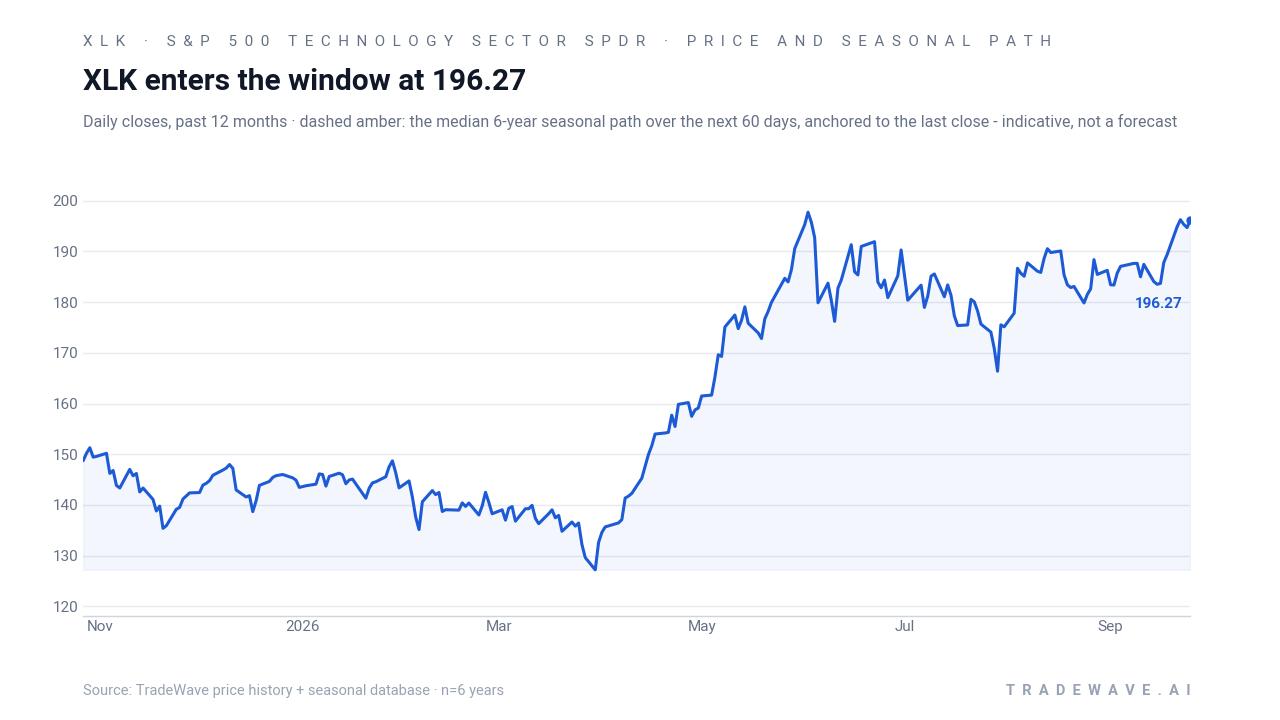
XLK’s most recent one-month gain of 7.99% comes on the back of renewed enthusiasm for AI infrastructure and semiconductor demand, themes that have kept technology at the front of the market’s leadership board. In April 2026, MarketBeat highlighted how the ETF had been trading near record highs with strong support interest emerging in the 130–135 region and elevated volume during pullbacks, as traders leaned into the sector ahead of a busy Q1 earnings season for its largest holdings.[1] Short-interest data updated in September 2026 shows an active borrow market but no clear sign of a structural squeeze or capitulation, suggesting positioning is engaged but not extreme.[2]
The chart below places that recent strength in the context of the past year and overlays the median seasonal path for the next two months.
For macro context, the sector’s backdrop remains dominated by AI-driven tech demand and the heavy weight of semiconductor and cloud giants inside XLK, which concentrate both upside and downside in a handful of names. As the calendar moves toward the Oct 25 seasonal start date, traders will be watching how those megacaps trade around earnings, guidance on AI capital expenditure and any shifts in regulatory rhetoric on data, chips and platform power. The historical pattern says this has been a favorable stretch for long exposure in prior midterm election years; the next few weeks will show whether today’s tech narrative lines up with that script or challenges it.
What should traders watch as the Oct 25 window approaches?
Three things stand out for this upcoming XLK seasonal window. First, the 52-week high near 198.54 is a natural reference point; how XLK behaves around that level into late October will shape how stretched or refreshed it looks as the 191-day pattern kicks in. Second, watch the depth of any pullbacks: prior cycles show that even winning years have seen maximum adverse moves as deep as the mid-teens, so a sharp shakeout would not be unusual in historical terms. Third, monitor sector breadth and volume around key AI and semiconductor earnings updates, since strong participation across the ETF’s holdings has often been a feature of the better-performing windows.[1]
If short-interest metrics begin to trend meaningfully higher or lower from the September snapshot, that shift in positioning could either amplify or blunt the usual seasonal tendency.[2] A build in short interest into the window would raise the odds of squeeze-like rallies if the historical pattern of midterm-to-pre-election strength reasserts, while a steady or declining borrow base would point to a cleaner, less crowded backdrop. Either way, the Oct 25 start date marks the opening of a historically powerful regime for XLK, and the way price, volume and positioning behave inside that window will tell traders whether this cycle is tracking the last six or writing a new chapter.
Sources
About this seasonal analysis
Seasonal pattern data is sourced from TradeWave.ai, which analyzes historical price behavior across annual calendar windows going back up to 30 years. Read the full data methodology or the book The 100-Year Pattern by Afshin Moshrefi (2026 edition). Past performance of seasonal patterns does not guarantee future results. This article is for informational purposes only and does not constitute investment advice.