Macy's, Inc. (M) Has Fallen in 9 of 10 Years in This 55-Day Spring Short Window
Macy's, Inc. is stepping into a historically bearish 55-day stretch just as the stock jumps on Q4 earnings and trades well below its 52-week high, raising the stakes for traders watching the turnaround story.

Seasonal window
Macy's, Inc. has delivered profitable short setups in 9 of the past 10 years during this 55-day spring window, with winning years averaging 17.25% gains for the short side. The new iteration begins today with the stock at $17.72, up 4.7% on the session and down about 26.7% from its 52-week high of $24.16, leaving it deep in negative territory for 2026 with a 23% year-to-date decline. That combination of a fresh bounce, a sharp drawdown from last year’s highs and a historically one-sided seasonal pattern gives traders a very specific calendar backdrop to weigh against Macy’s turnaround narrative.
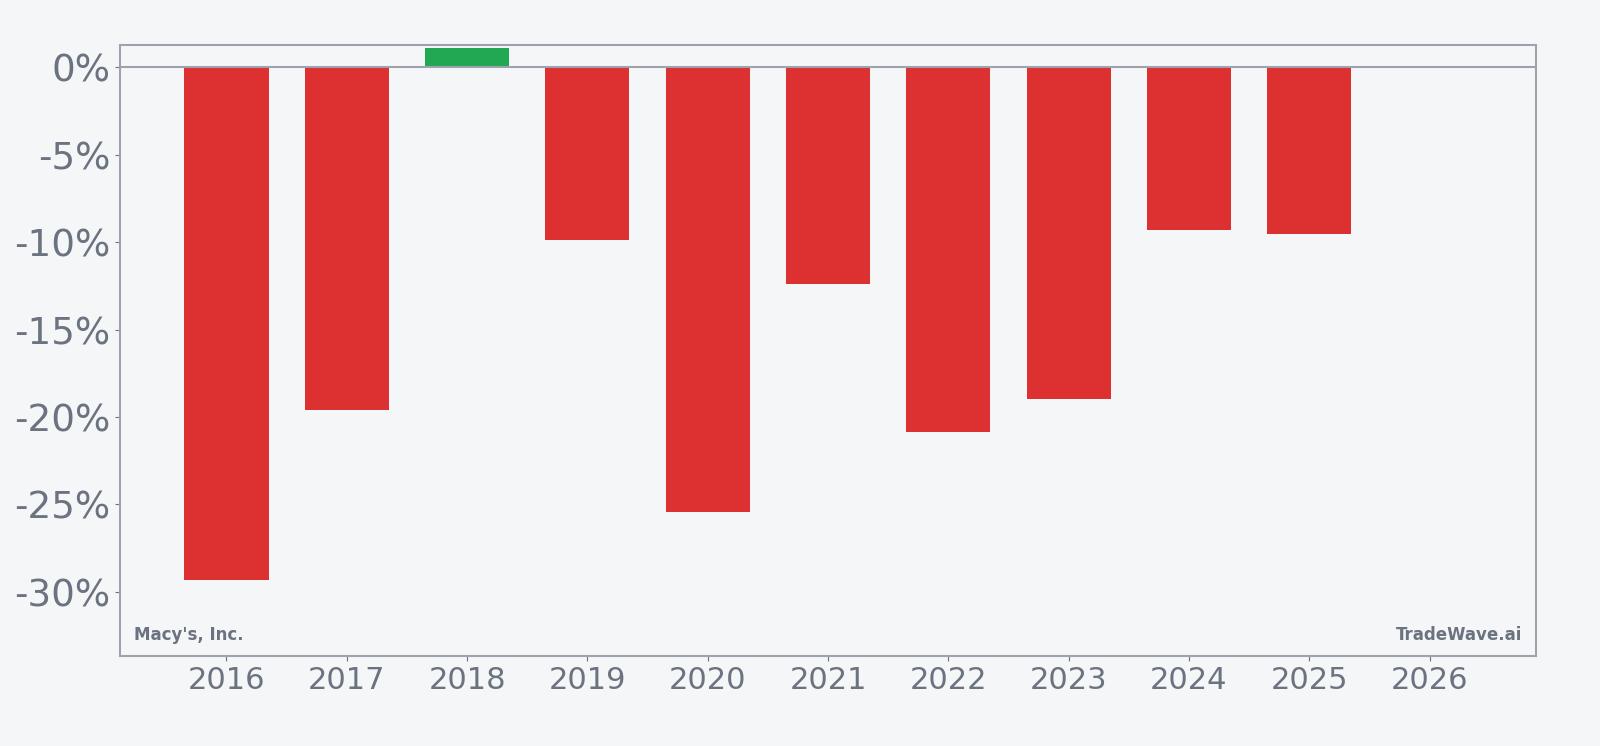
Historically this has been a cleanly bearish stretch for Macy’s when traded from the short side. Across the past decade, 9 years finished in the green for shorts and only 1 year ended as a loss, giving a 90% success rate with 9 winners and 1 loser. Average gains in those winning years came in at 17.25%, while including the lone losing year still leaves an all-years average of 15%, which is unusually strong for a 55-day window.
The per-year breakdown shows how consistent that pattern has been. The strongest year for shorts was 2016, when Macy’s fell 29.31% from entry to exit during the window, while 2020 delivered a 25.41% net decline in the stock price over the same slice of the calendar. The only losing year for the short setup was 2018, when Macy’s finished the window up 1.13%, even though intraperiod swings were much larger.
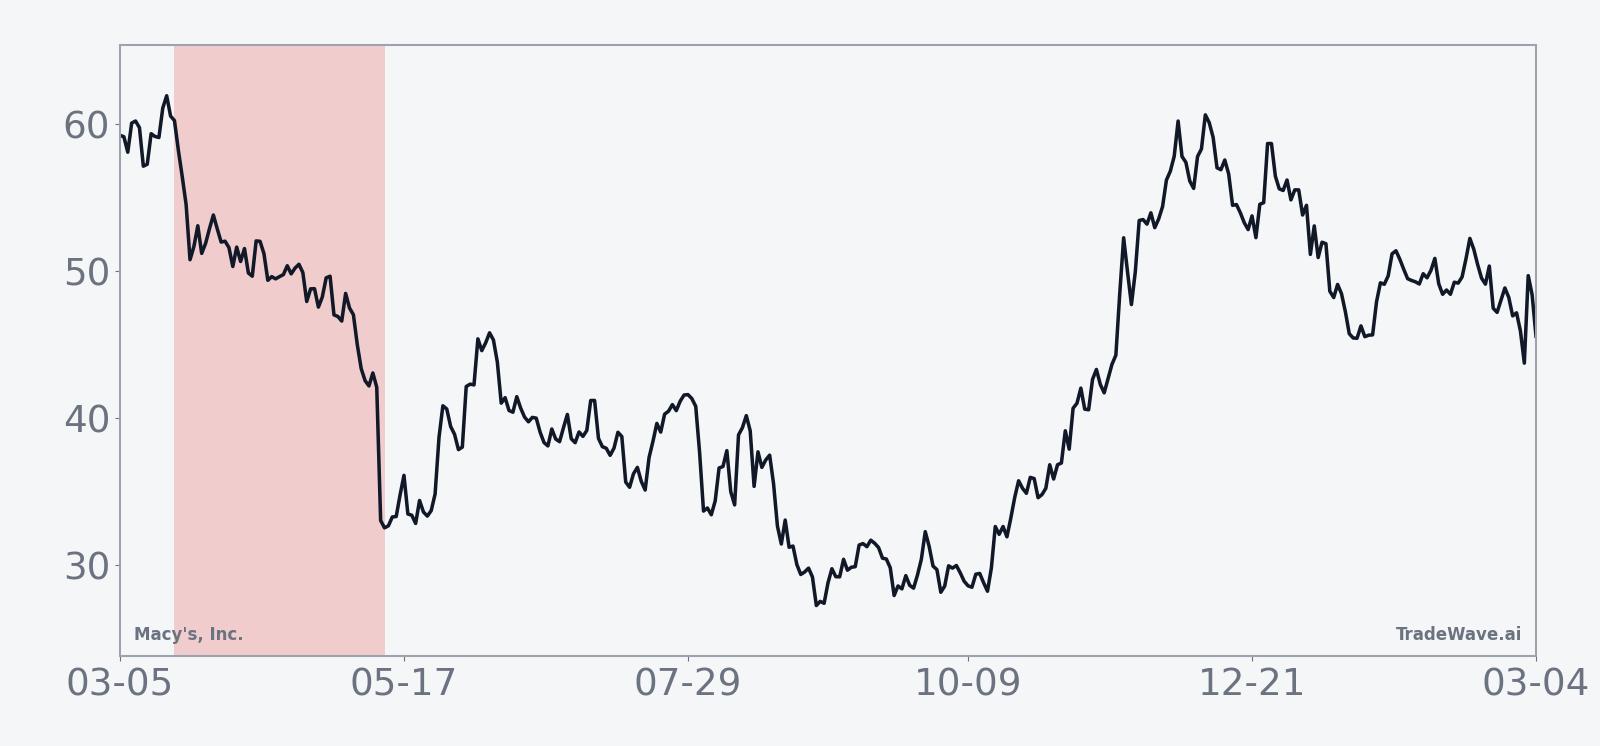
The historical average path suggests that weakness has tended to build rather than arrive in a single air pocket. The seasonal trend line slopes lower across most of the 55 days, with relatively few stretches of sustained countertrend strength. For traders, that points to a pattern where rallies inside the window have historically been sold rather than extended into new legs higher.
A closer look at intraperiod swings shows how far Macy’s has typically moved in both directions before the window closes.
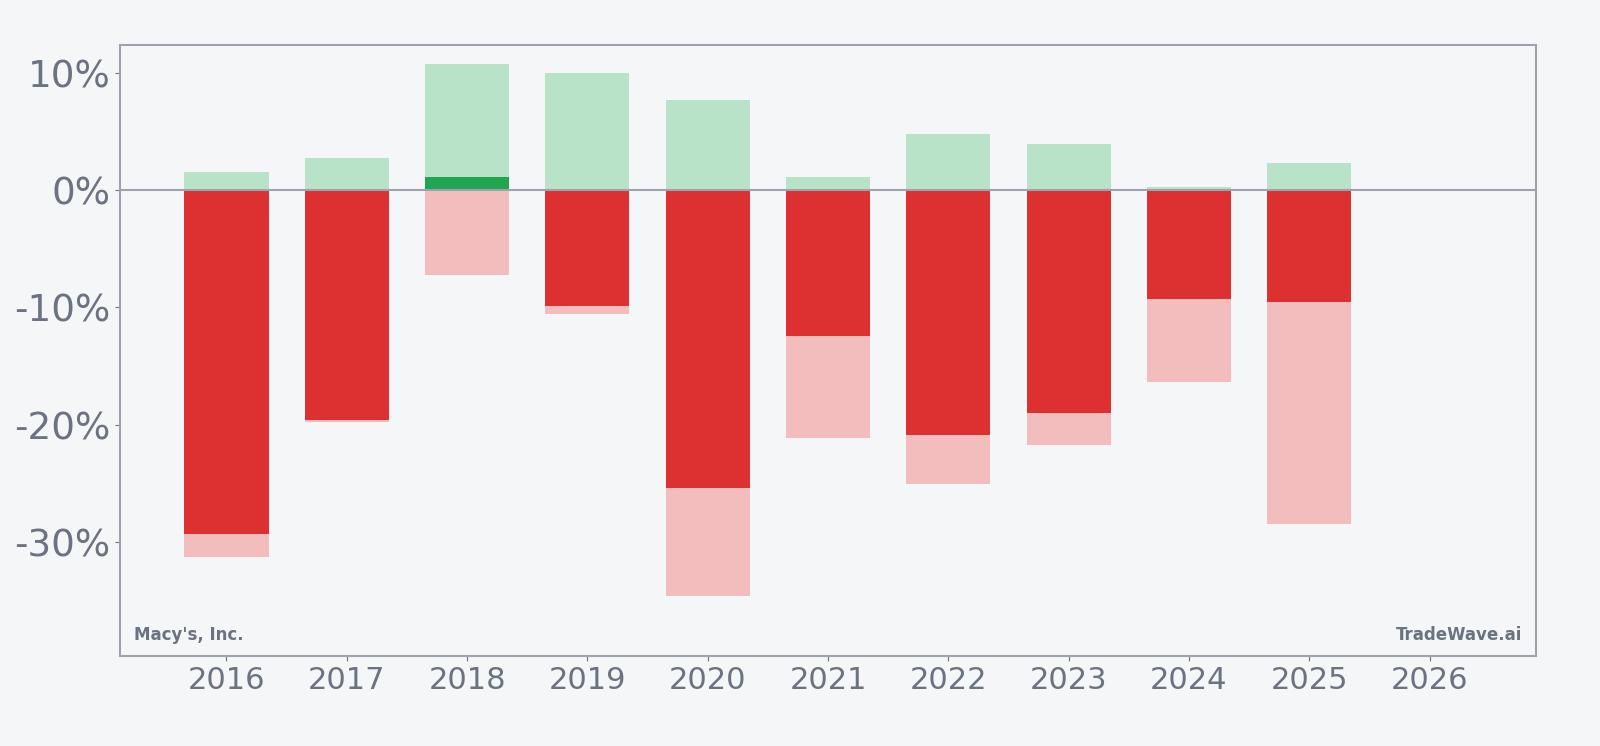
The maximum favorable move and maximum adverse move profile underlines how volatile this window can be even when the final result favors shorts. In 2016, for example, the best intraperiod move in the trade direction was a 1.56% gain for the short, but the worst drawdown from entry reached 31.23% against the position before the stock ultimately finished down 29.31%. In 2020, the short side saw a 7.62% best-case move during the window, while the worst intraperiod move against the trade was a 34.53% spike higher before Macy’s rolled over and closed the period sharply lower.
That pattern of large adverse swings alongside strong final declines repeats across many years. Even in 2024, when the net move for shorts was a relatively modest 9.29% gain, the worst intraperiod move against the trade was a 16.34% rally before the stock faded. Add it up and this is a window where the short side has usually been rewarded, but only after sitting through sizable countertrend moves.
History does not guarantee future results, and intraperiod drawdowns can be large even in winning windows, so position sizing and risk controls matter as much as the seasonal edge.
Key takeaways
- Macy’s 55-day spring window starting Mar 19 has historically favored shorts, with 9 winners and 1 loser for a 90% success rate.
- Winning short years have averaged 17.25% gains, while the all-years average including the lone loss is still a strong 15%.
- Trade direction is short, and the TradeWave Ratio of 2.42 points to meaningful travel in the trade direction inside the window.
- Intraperiod swings have been violent, with some years showing adverse moves above 30% before the stock ultimately rolled over.
- The pattern’s Sharpe ratio of 1.64 signals unusually strong risk-adjusted returns for this specific calendar slice.
- Today’s window opens with Macy’s up 4.7% on the day but still down 23% year to date and well below its 52-week high.
According to historical data from TradeWave.ai, this particular 55-day stretch has behaved very differently from an average spring for Macy’s, with a clear short-side bias that most investors do not have on their radar.
Price and near-term drivers
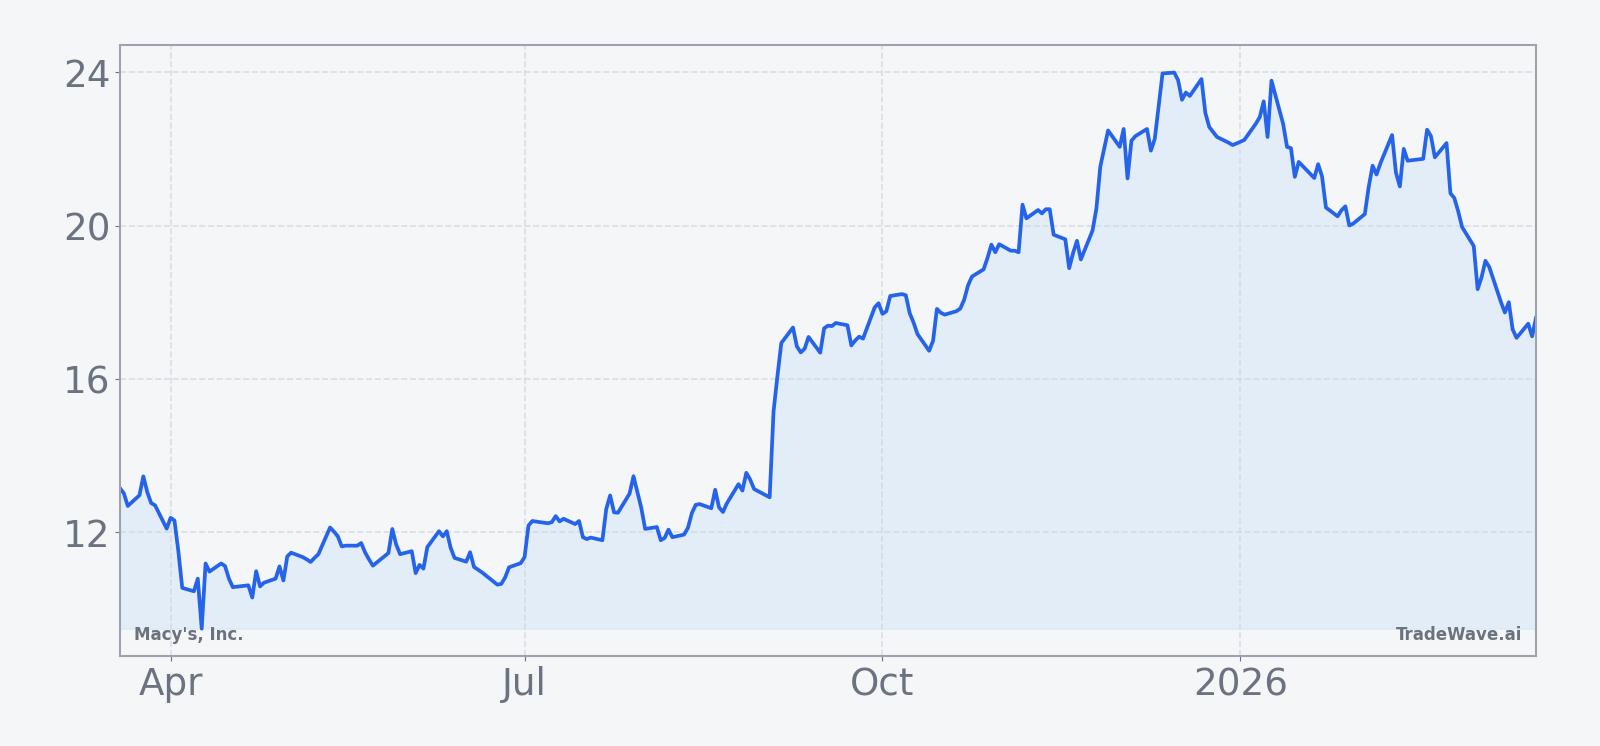
Macy’s shares closed Thursday at $17.72, up 4.7% after the company reported Q4 results and laid out a cautious sales outlook for the year ahead.[2] The stock has dropped about 26.7% from its 52-week high of $24.16 and is down 23% so far in 2026, even after a 34.1% gain in 2025 that came on heavy trading volume.[1] That reversal leaves Macy’s trading below its 50-day moving average of $20.52 and highlights how quickly sentiment has swung on the department-store chain.
The chart below situates the latest move in its recent multi-month context.
The latest quarter gave bulls and bears something to work with. On Mar 18, Macy’s posted solid Q4 earnings, with comparable sales rising and net income improving, but management warned that sales are expected to fall this year even as store revamps at Bloomingdale’s and Bluemercury progress.[2] A separate report the same day noted that strong fourth-quarter results were tempered by concerns over tariffs and geopolitical risks, including the Iran war, which could weigh on consumer confidence and margins.[4]
Those comments follow a year of aggressive restructuring. In Sep 2025, Macy’s raised its annual sales and profit forecasts as its turnaround plan, focused on upgrading stores and leaning into higher-end concepts, began to gain traction despite intense retail competition and tariff uncertainty.[5] Back in Dec 2025, the company surprised Wall Street by reporting sales growth and a profit, helped by better-than-expected efforts to blunt tariff impacts and strong performance at Bloomingdale’s and Bluemercury.[1] Another Dec 2025 update highlighted Macy’s strongest growth in more than three years but flagged a cautious stance on the holiday season as discretionary spending showed signs of strain.[3]
On the earnings front, Macy’s most recent full quarter before Q4 showed Q3 2025 revenue of $4.91 billion, ahead of the $4.71 billion consensus, with adjusted EPS of 9 cents versus expectations for a 13-cent loss.[1] Net income fell 60.7% to $11 million, but management raised full-year net sales guidance to a range of $21.48 billion to $21.63 billion and lifted adjusted EPS guidance to $2.00 to $2.20, targeting flat to 0.5% comparable sales growth.[1] Analysts tracked by FactSet via CNBC carry a Buy consensus rating on the stock, even as the company signals that revenue will likely contract this year while profitability improves.[2]
Macro and sector forces remain a swing factor. Macy’s has been working to reduce tariff exposure, and those efforts have so far worked better than expected, cushioning earnings against trade-related shocks.[1] At the same time, management continues to cite economic uncertainty, including pressure on discretionary spending and geopolitical risks, as reasons for a guarded outlook.[4] Within retail, the company is fighting for share in an overcrowded landscape, leaning on luxury and beauty through Bloomingdale’s and Bluemercury, which delivered a 3.2% increase in comparable sales in one recent period.[3][5]
Valuation and positioning context
With the stock trading well below its recent highs and under its 50-day moving average, Macy’s sits in a kind of no-man’s land between last year’s momentum and this year’s reset. The 34.1% gain in 2025 on heavy volume suggests that investors were willing to pay up for the turnaround story when guidance was moving higher and tariff fears were easing.[1][5] The 23% year-to-date slide into the new seasonal window shows how quickly that optimism can fade when management talks about falling sales and macro risks, even if profitability is improving.[2][4]
Street positioning reflects that tension. A Buy consensus from analysts suggests that many still see value in the shares at current levels, especially if the store revamp and luxury focus continue to drive mix and margin improvements.[2][5] At the same time, the lack of a clear, up-to-date consensus price target and the company’s own guidance for lower sales underscore that this is not a simple growth story. For traders, that mix of cautious fundamentals and supportive analyst sentiment is the backdrop against which the historically bearish spring window is opening.
What to watch in this window
For the next 55 trading days, the key question is whether Macy’s trades more like its historical spring pattern or more like a typical post-earnings recovery. The seasonal record says this window has usually rewarded shorts, with 9 winning years out of 10 and average gains of 17.25% in those years, but the path has often involved sharp rallies against the trade before the stock rolled over. Traders will be watching whether any early strength from the latest Q4 report fades quickly or holds above the 50-day moving average.
Price levels matter. A sustained move back toward the 50-day average near $20.52 would signal that buyers are willing to look through management’s warning about falling sales and focus on margin progress and the store revamp.[2] Failure to hold recent gains, especially if the stock breaks below the recent lows carved out during the 22.18% one-month slide, would look more like the historical pattern in which rallies inside this window have been sold.
Fundamentals and headlines will also shape how this seasonal stretch plays out. Any updates on tariffs, consumer spending or geopolitical risks that change the outlook for discretionary retailers could quickly shift sentiment, particularly given Macy’s exposure to higher-end shoppers and its efforts to reduce tariff impacts.[1][4] On the company side, progress reports on store remodels, Bloomingdale’s and Bluemercury growth, and any tweaks to guidance will be key tells on whether the turnaround is still on track.[2][3][5]
Finally, traders should keep an eye on volume and follow-through after big daily moves. The 34.1% gain in 2025 came with heavy trading activity, showing how quickly positioning can swing when the narrative shifts.[1] If this year’s spring window sees similar volume spikes on down days, that would rhyme with the historical pattern of strong short-side performance. If instead the stock grinds higher on solid volume and shrugs off intraperiod pullbacks, it would mark a rare break from a decade-long seasonal script.
Sources
- MarketWatch, "Macy’s surprises Wall Street by reporting sales growth and a profit, but the stock pulls back" (Dec 3, 2025)
- CNBC, "Macy's expects sales to fall this year, even as store revamp shows progress" (Mar 18, 2026)
- CNBC, "Macy’s posts strongest growth in more than 3 years, but strikes cautious note on holidays" (Dec 3, 2025)
- AP News, "Macy's posts strong 4Q results but a reserved outlook reflects uncertainty around tariffs, Iran war" (Mar 18, 2026)
- Reuters, "Macy's turnaround progress boosts annual forecasts, shares jump" (Sep 3, 2025)