New CEO’s Tech Push at Target Corporation (TGT) Meets a Historically Strong Midterm Spring Run
Target Corporation is heading into a historically strong 40-day midterm-year stretch just as the retailer works through a turnaround after another weak sales quarter.

Key takeaways
- A 40-day seasonal window for Target Corporation tied to midterm election years begins on Mar 23 and has historically favored long positions.
- Across the last 8 midterm cycles, the stock finished this window higher in 7 years and lower in 1 year, for an 88% win rate.
- Winning years in this stretch averaged gains of 5.04%, while including the lone losing year brings the all-years average to 4%.
- Intraperiod swings have been meaningful, with several years showing mid-window drawdowns before recovering into positive finishes.
- The pattern sits against a challenging fundamental backdrop, with Target posting another quarter of falling sales and outlining a turnaround plan.
- History points to a constructive seasonal bias, but past windows also show that adverse moves can be sharp even when the final result is positive.
According to historical data from TradeWave.ai, this upcoming midterm-year stretch has behaved differently from a typical spring for Target, with a clear directional tilt that most investors never see in standard charts.
Seasonal window
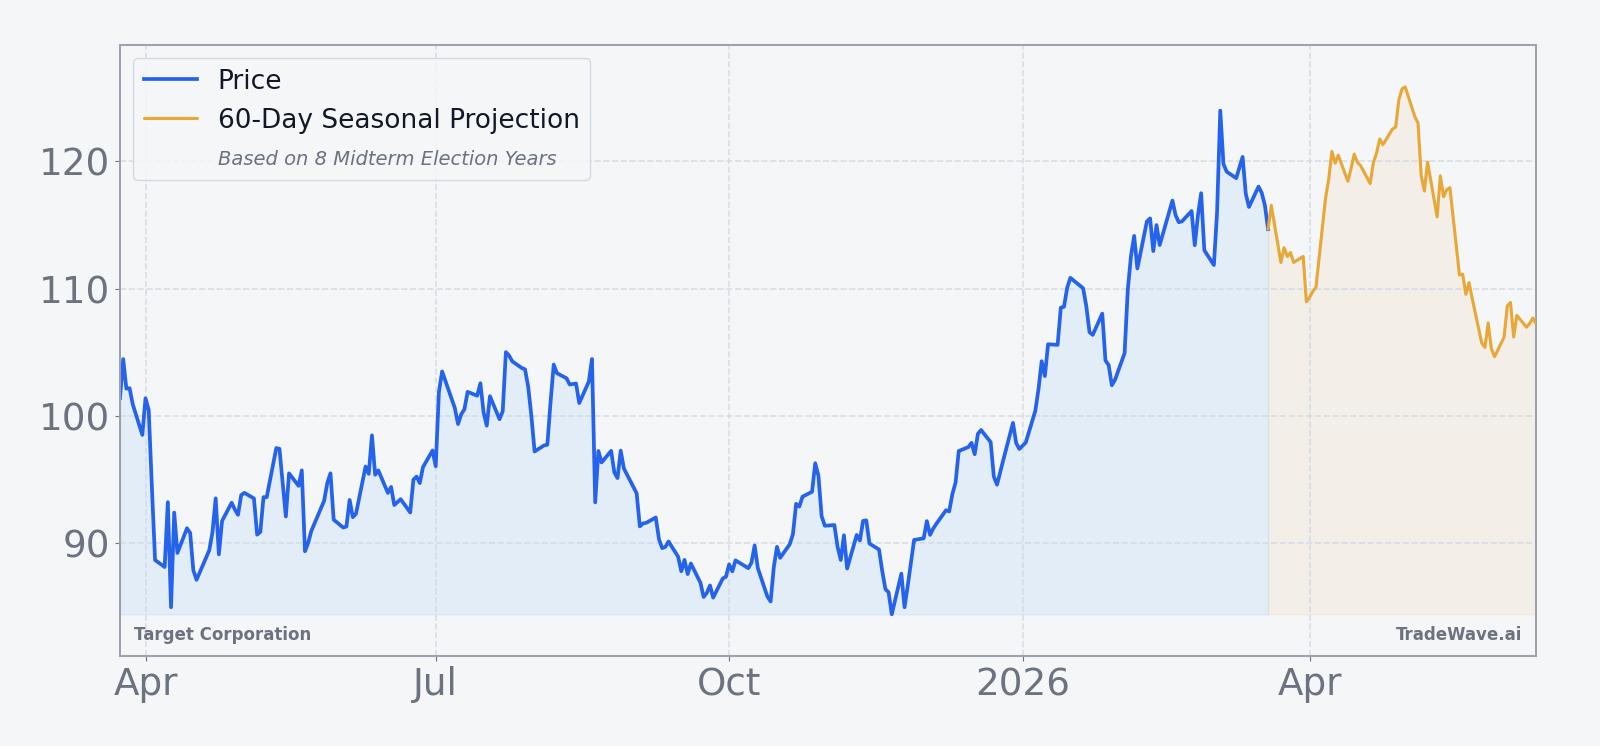
Target Corporation has risen in 7 of the last 8 midterm election years during this 40-day window, averaging 5.04% gains in the winning runs. Shares closed Friday at 114.47, leaving the stock about 9.2% below its 52-week high of 126.00 and well above its 52-week low of roughly 81.48.[2] Option activity has leaned moderately bearish in recent sessions as traders positioned around the stock’s pullback and ongoing uncertainty, a contrast with the historically positive bias in this specific slice of the calendar.[2]
The pattern is built on the last 8 midterm election years, a phase of the presidential cycle when policy noise, spending debates and rate expectations often reshape consumer and retail sentiment. Grouping by this cycle matters for a company like Target because midterm years frequently coincide with shifting fiscal priorities and regulatory scrutiny that can alter traffic, pricing power and investor appetite for big-box retail risk.
This seasonal window begins on Mar 23 and spans 40 trading days. Historically, during this period, Target Corporation has shown a strong upside tendency for long exposure, with an 88% Percent Profitable rate built from 7 winners and 1 loser across the sample. The trade direction for this pattern is explicitly long, so those 7 positive years represent favorable outcomes for the setup, while the single down year marks the main historical miss.
Average winner gains of 5.04% compare with an all-years average of 4%, which folds in the modest 0.39% loss from the weakest year. Avg Profit reflects winners only, while Avg Profit - All includes every year in the sample, so the relatively small gap between the two suggests that the lone losing year did not deliver a major hit compared with the typical upside. The median profit of 5.22% and a Sharpe ratio of 1.56 for this window underline that returns have been both positive and relatively consistent on a risk-adjusted basis.
Looking at individual years, 2022 stands out as the strongest example, with a 6.03% net gain and a maximum favorable move of 17.6% from the entry price before settling back by the end of the window. On the other side of the spectrum, 2006 delivered the only negative finish, down 0.39%, and saw a worst intraperiod drawdown of 5.24% from entry, showing that even a small final loss can hide a much rougher ride along the way.
The intraperiod profile is best understood through maximum favorable excursion and maximum adverse excursion, which track the best and worst moves from the entry point during the window. In several years, including 1994, 2010 and 2018, Target saw favorable runs of roughly 5% to 9% while the worst drawdowns stayed closer to 1% to 3%, a combination that historically rewarded patience in the trade direction. In others, such as 2002 and 2022, the stock experienced deeper adverse moves of around 5% before recovering, underscoring that even winning years have demanded tolerance for volatility.
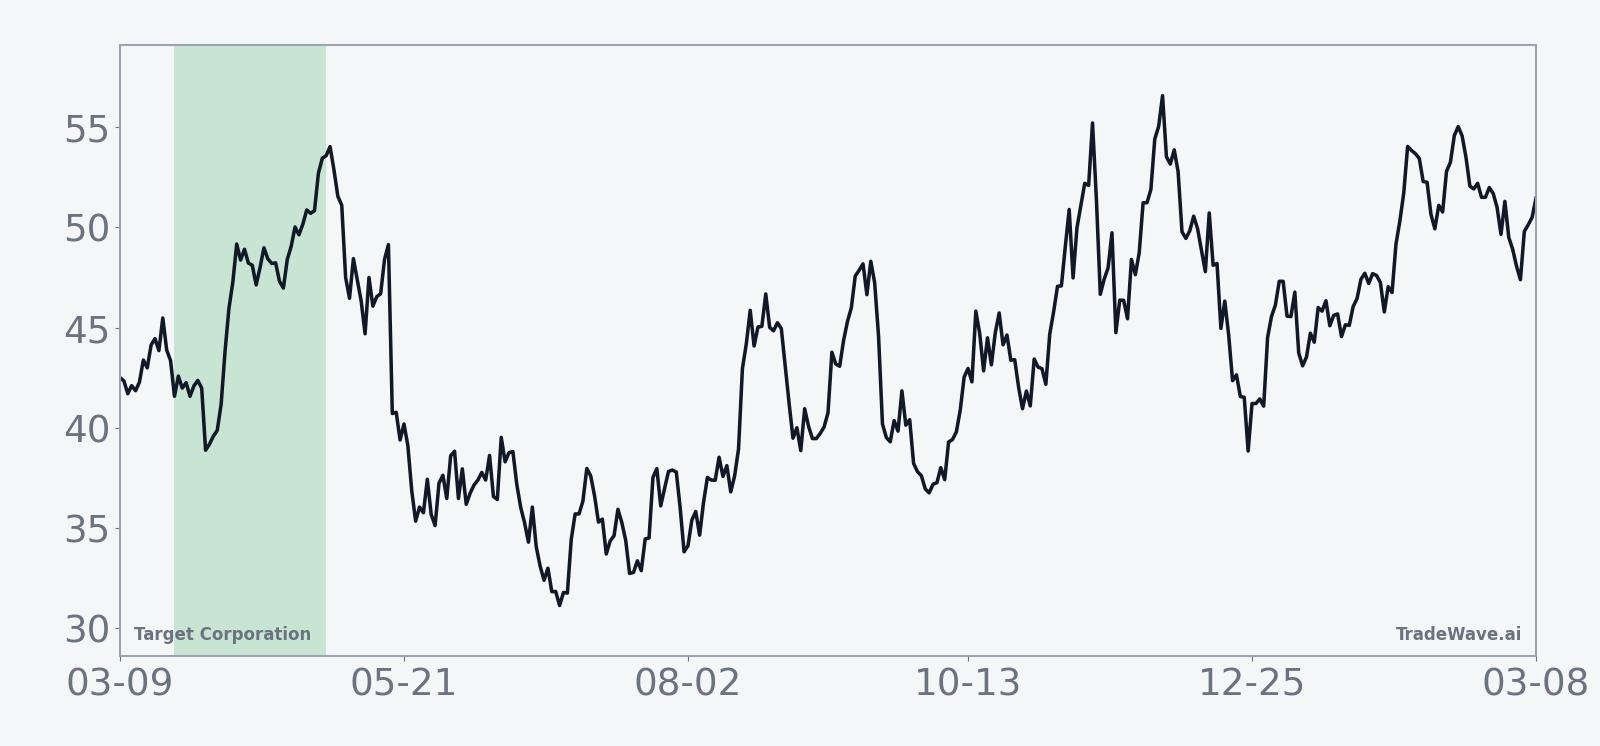
The historical seasonal trend chart for this window shows gains that tend to build gradually rather than in a single burst, with strength often clustering in the middle portion of the 40-day span. That pattern suggests prior cycles have seen choppy early action followed by a more persistent grind higher, which fits with the idea of investors digesting macro headlines and company-specific news before leaning back into the name.
The cumulative return view across all eight midterm-year windows adds up to a 40% total gain for the pattern, reinforcing that the bias has not been driven by just one outlier year. Instead, multiple cycles have contributed meaningfully, with the cumulative line stepping higher in several distinct midterm periods rather than spiking once and flattening out.
Year-by-year bars with maximum favorable and adverse moves show how often upside has outweighed drawdowns.
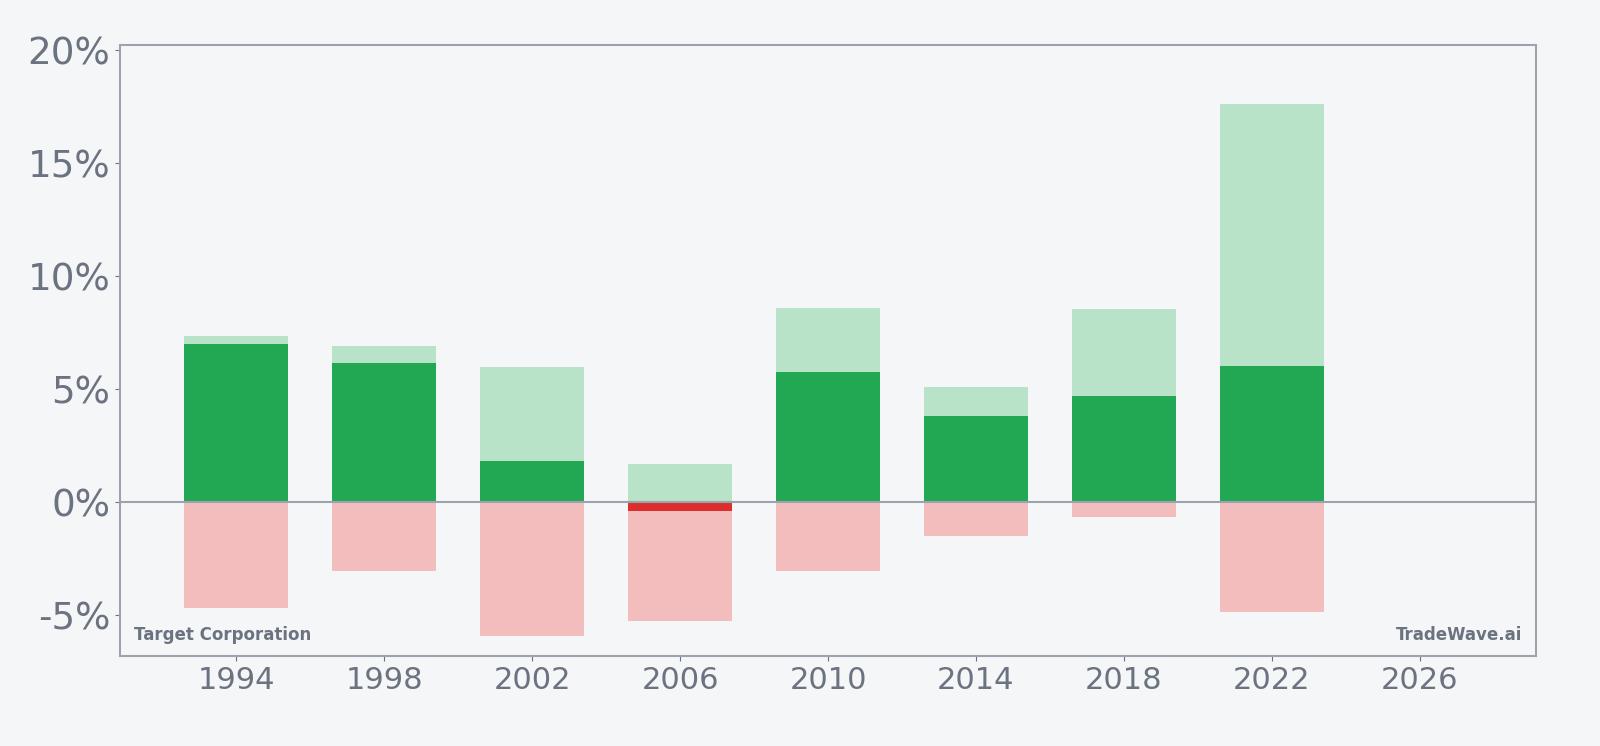
History does not guarantee future results, and the worst intraperiod drawdowns in this window have at times been sizable even in years that ultimately finished higher.
Price and near-term drivers
Target shares slipped 0.5% Friday to 114.47, extending a modest one-month decline of 1.03% and leaving the stock trading between its 52-week high of 126.00 and low near 81.48.[2] The stock is hovering just above its 50-day moving average of 112.67 on solid 20-day average volume of about 6.4 million shares, a sign that investors are still active in the name even as the turnaround story grinds on.[2]
The latest fundamental check-in came on Mar 2, when Target reported another quarter of declining sales and laid out a plan to spend more on stores and technology under new CEO Michael Fiddelke.[3] Comparable sales for the quarter to Nov 1 fell 2.7%, revenue landed at 105.242 billion and earnings per share reached 8.24, underscoring that profitability has held up better than top-line momentum.[3] Management guided to a rebound in sales this year as those investments ramp, but investors have so far treated the story cautiously, with the stock stuck well below its prior cycle highs.
The operational backdrop has been tough. In Oct 2025, Target announced plans to eliminate about 1,800 corporate roles as part of a restructuring aimed at streamlining projects and sharpening focus on core initiatives.[1] The company has also been squeezed by a fiercely competitive retail landscape, with Walmart and Amazon pressuring prices and logistics, and by softer store traffic and spending patterns that have weighed on many big-box peers.[1][4]
Investor pressure has been building alongside those challenges. In Dec 2025, Reuters reported that hedge fund Toms Capital had built a stake in Target, adding activist scrutiny to the mix as sales continued to slide.[11] That kind of shareholder presence can accelerate strategic shifts, from portfolio pruning to capital allocation changes, which in turn can amplify volatility around earnings and key macro data points.
Options traders have been leaning cautiously bearish at times, with reports of mixed sentiment as the stock traded lower into late 2025 and early 2026.[2] For a name with a historically strong midterm-year seasonal window, that positioning sets up an interesting tension between what the calendar has delivered in prior cycles and how investors are hedging the current one.
The chart below situates the latest move in its recent multi-month context.
What to watch as the window opens
The next 40 trading days will test whether Target’s midterm-year pattern can reassert itself against a more complicated fundamental story. Historically, this window has favored longs, with 7 winners out of 8 and a solid 4% average gain across all years, but prior cycles also show that the path to those gains has rarely been smooth.
Traders will be watching how the stock behaves around key levels as the window begins. The first marker is the 50-day moving average near 112.67, which has been a short-term reference point for buyers and sellers.[2] A sustained move back toward the 52-week high at 126.00 during the window would rhyme with the historical pattern of mid-window strength, while a break back toward the low 100s would look more like the lone losing year in the sample.
On the news front, any updates on store investments, technology spending or the pace of restructuring could act as catalysts, especially given the activist presence and the company’s guidance for a sales rebound.[1][3][11] Macro data on consumer spending and inflation will also matter, since they feed directly into how investors handicap big-box margins and traffic trends.
Finally, options flow bears watching. If the moderately bearish positioning that has shown up around recent pullbacks persists or intensifies as the seasonal window opens, it could either cap rallies or set the stage for short-covering if the stock starts to track its historical midterm-year bias higher.[2] A shift toward more balanced or bullish options activity during the window would signal that investors are giving the turnaround and the seasonal tailwind more benefit of the doubt, while a continued build in downside hedges would suggest skepticism that this cycle will look like the last eight.
Sources
- Yahoo Finance: Target Restructures Workforce: Will the Bold Move Pay Off? (Oct 24, 2025)
- CNBC: Check out Target Corp's stock price (TGT) in real time (Dec 23, 2025)
- WSJ: Target Sales Just Fell Again. Now Its New CEO Plans for Turnaround. (Mar 3, 2026)
- MarketWatch: Target sales disappoint as store traffic and spending decline (Nov 19, 2025)
- CNBC: Final Trade: AAPL, ANF, FCX, TGT (Jul 1, 2025)
- Reuters: Target faces activist investor pressure amid sales decline (Dec 26, 2025)