Tariffs Hit Volumes as FedEx (FDX) Enters a Weak 20-Day Midterm-Year Window
FedEx is moving through a 20-day midterm-election-year stretch that has often leaned lower, even as the stock trades near recent highs and remains sensitive to growth scares.

Key takeaways
- FedEx is in a 20-trading-day window that historically favors short setups during midterm election years.
- The pattern covers the last 8 midterm election years, with 6 winners and 2 losers for the short side, or 75% profitable trades.
- Average gain in winning years is 4.56% for shorts, while the all-years average, including losers, is a 3% move in the trade direction.
- Intraperiod swings have been meaningful, with several years showing sharp adverse moves before the trade worked.
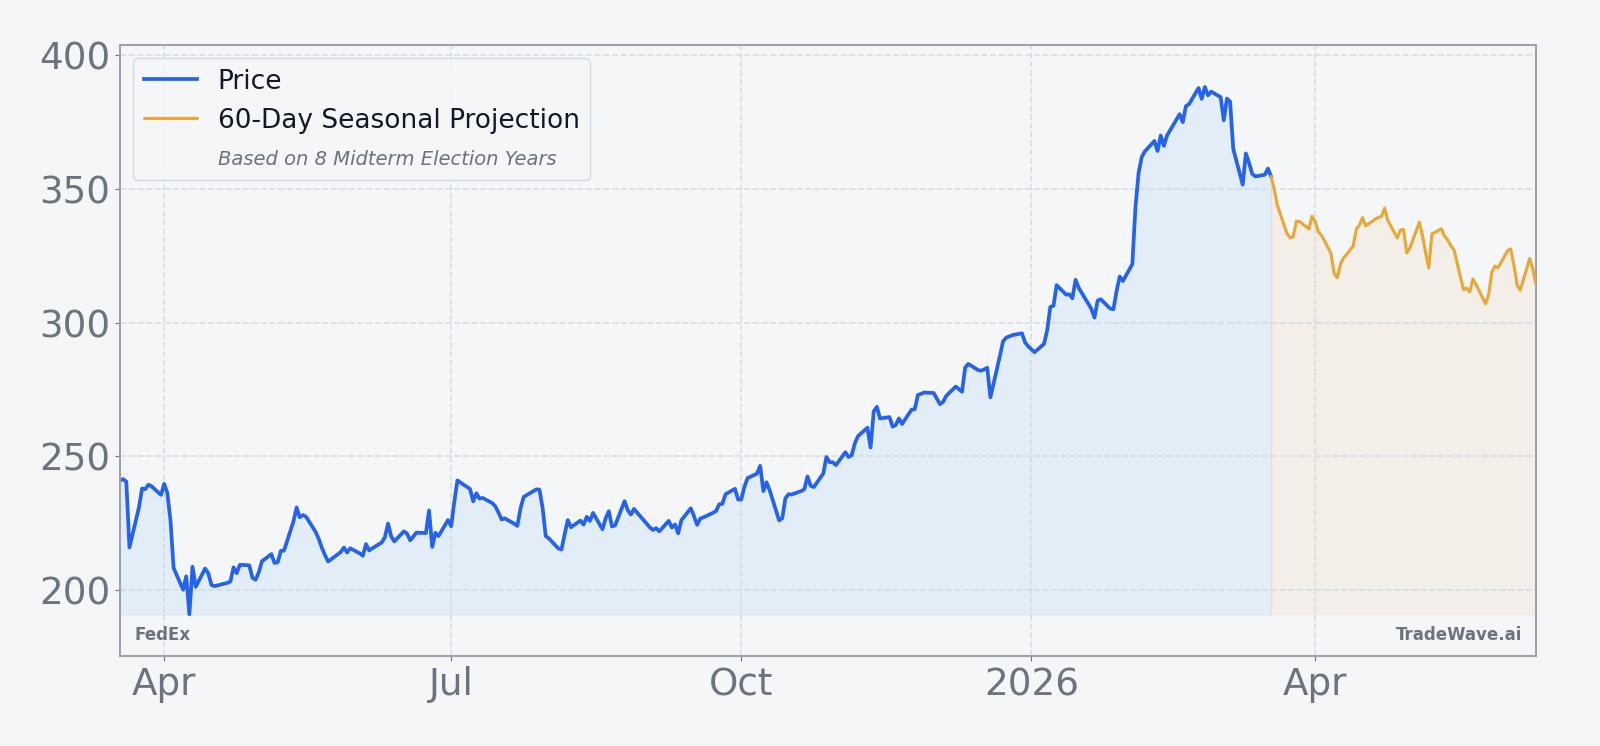
- Today FedEx closed at 356.11, up 1.8% on the day and still well below its 52-week high of 392.86.
- Macro growth scares have historically hit FedEx hard, with past drawdowns reaching roughly 35% during demand shocks.[1]
According to historical data from TradeWave.ai, this specific midterm-year stretch has behaved differently from a typical month for FedEx, with a clear directional bias that many investors overlook.
Seasonal window
FedEx is trading inside a 20-day midterm-election-year window that has historically rewarded short positions, with 6 winners and 2 losers for a 75% hit rate. The stock finished Friday at 356.11, up 1.8% on the day and about 9.4% below its 52-week high of 392.86.[1] That combination of a bearish seasonal backdrop and a price still relatively close to the top of its one-year range gives this window more bite than a routine pullback setup.
The pattern groups the last eight midterm election years, a phase of the presidential cycle that often brings policy uncertainty, shifting fiscal priorities and choppy industrial demand. For a bellwether like FedEx, that mix has tended to translate into softer price action over this specific 20-day slice, even when the broader market was not in a full-blown downturn.
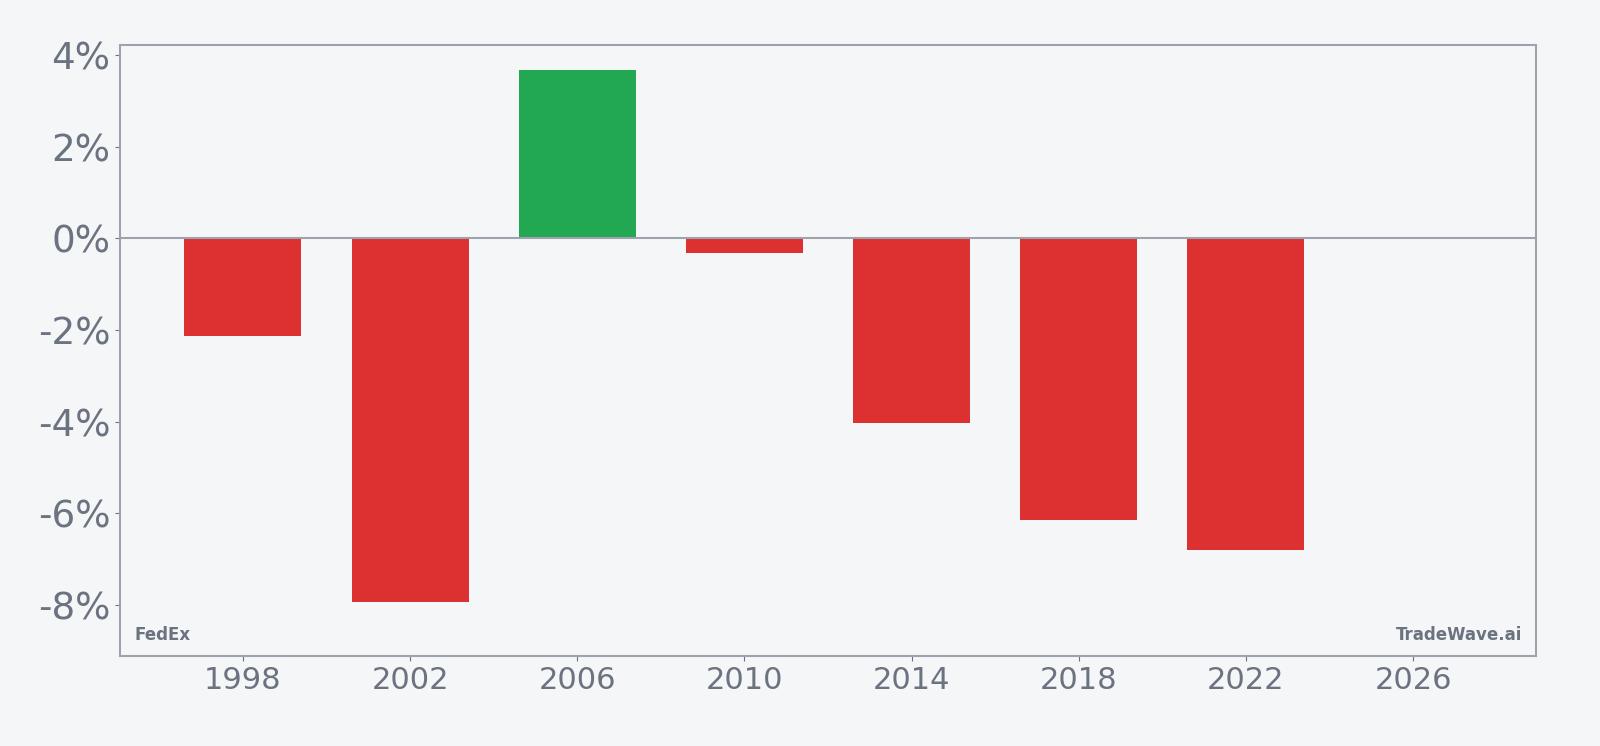
In the winning years for this short setup, FedEx has typically delivered around a 4.56% move in the trade direction by the end of the window, while including all years, winners and losers together, the average outcome is a 3% move in favor of shorts. That gap between the winners-only average and the all-years figure reflects the fact that losing years have been smaller in magnitude than the best shorts, which is what you want to see if you are evaluating the pattern’s consistency rather than betting on a single big hit.
Intraperiod behavior has not been gentle. In 1998, for example, the trade finished with a 2.13% gain for shorts, but the worst drawdown from entry reached 13.12% before the move came back in line with the pattern. In 2022, the window produced a 6.81% gain for shorts, yet the maximum favorable excursion hit 10.35%, showing that even in strong years the stock could overshoot to the downside before bouncing.
The historical seasonal trend line for this window slopes modestly in favor of shorts, with weakness often clustering in the middle of the 20-day span rather than right at the start. That profile suggests that in prior midterm years, traders who pressed the move too early sometimes had to sit through noise before the downside developed.
A stacked view of net returns alongside best and worst intraperiod swings shows how much room FedEx has historically given both bulls and bears inside this window.
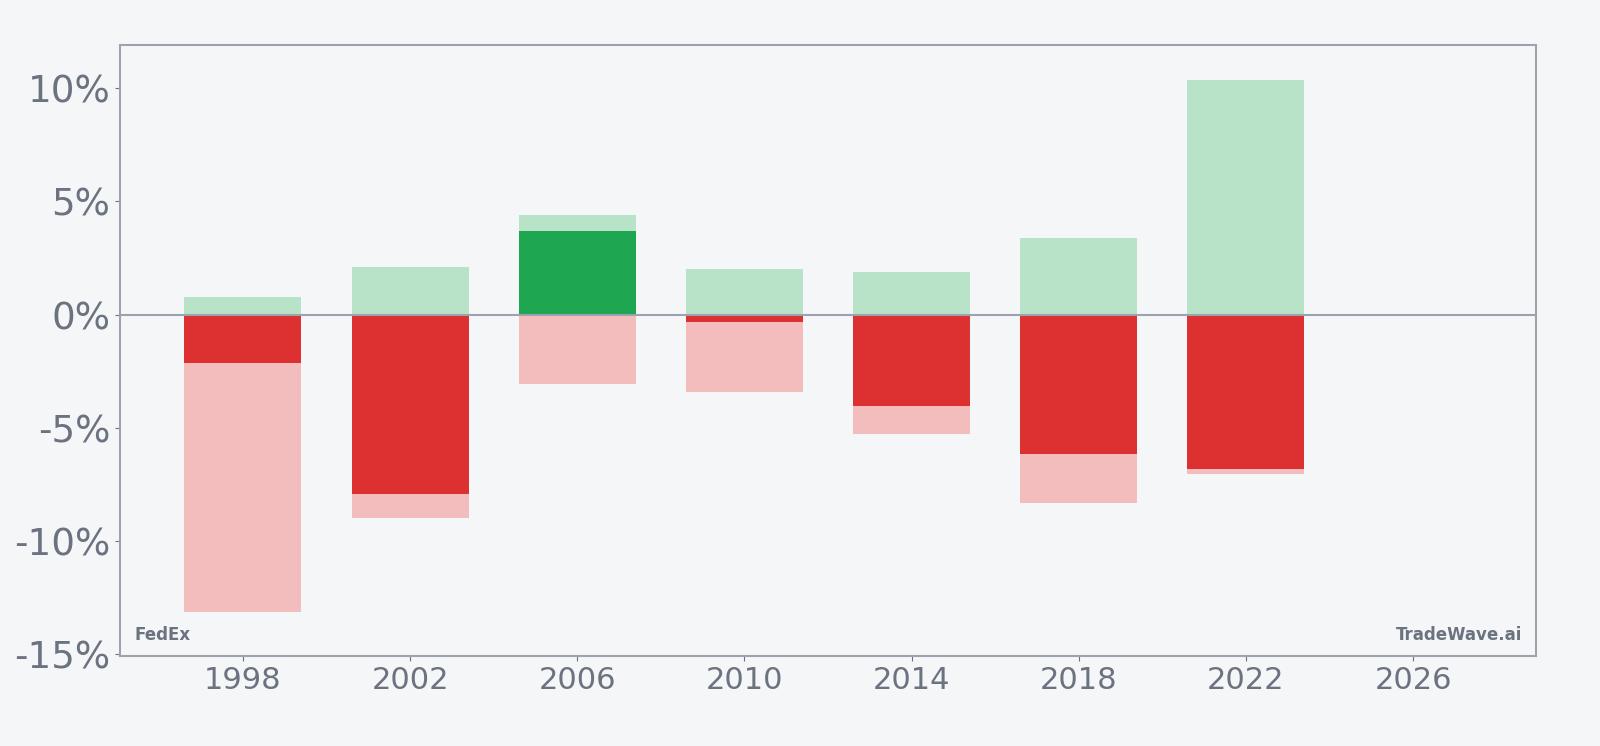
Across the individual years, the combination of net results, maximum favorable excursion and maximum adverse excursion shows a pattern of meaningful two-way risk: shorts have often seen several percentage points of adverse move before the trade worked, while the best years have delivered double-digit peak gains for the short side. The key takeaway is simple: this window has leaned bearish for FedEx in midterm election years, but it has not been a straight line.
History does not guarantee future results, and even in winning years the worst intraperiod drawdowns have been large enough to challenge conviction.
Price and near-term drivers
FedEx shares closed Friday at 356.11, up 6.37 points or 1.8% on the day, after trading between 344.15 and 356.67 on volume of about 4.27 million shares, well above the 20-day average of roughly 1.75 million.[1] The stock is down 7.05% over the past month but still sits about 9.4% below its 52-week high of 392.86 and far above its 52-week low near 187.45, leaving it in the upper half of its one-year range.[1]
That positioning matters because FedEx has a history of reacting sharply when investors start to price in growth scares. On Mar 16, 2026, a Forbes analysis highlighted that the stock has previously dropped as much as 35% during demand and macro shocks, underscoring how quickly sentiment can flip when industrial and trade data roll over.[1] Against that backdrop, a seasonally weak midterm-year window arriving while the stock is still elevated in its range is a setup traders will be watching closely.
Recent fundamental narratives are still shaped by last year’s tariff and demand headlines. In 2025, FedEx repeatedly trimmed its outlook and flagged tariff impacts on international volumes, while analysts pointed to a tougher industrial backdrop and rising competition from rivals like UPS.[3][4][5][6][7][8] Those stories are not fresh, but they frame why investors remain quick to punish the stock when macro data or policy headlines hint at slower global trade.
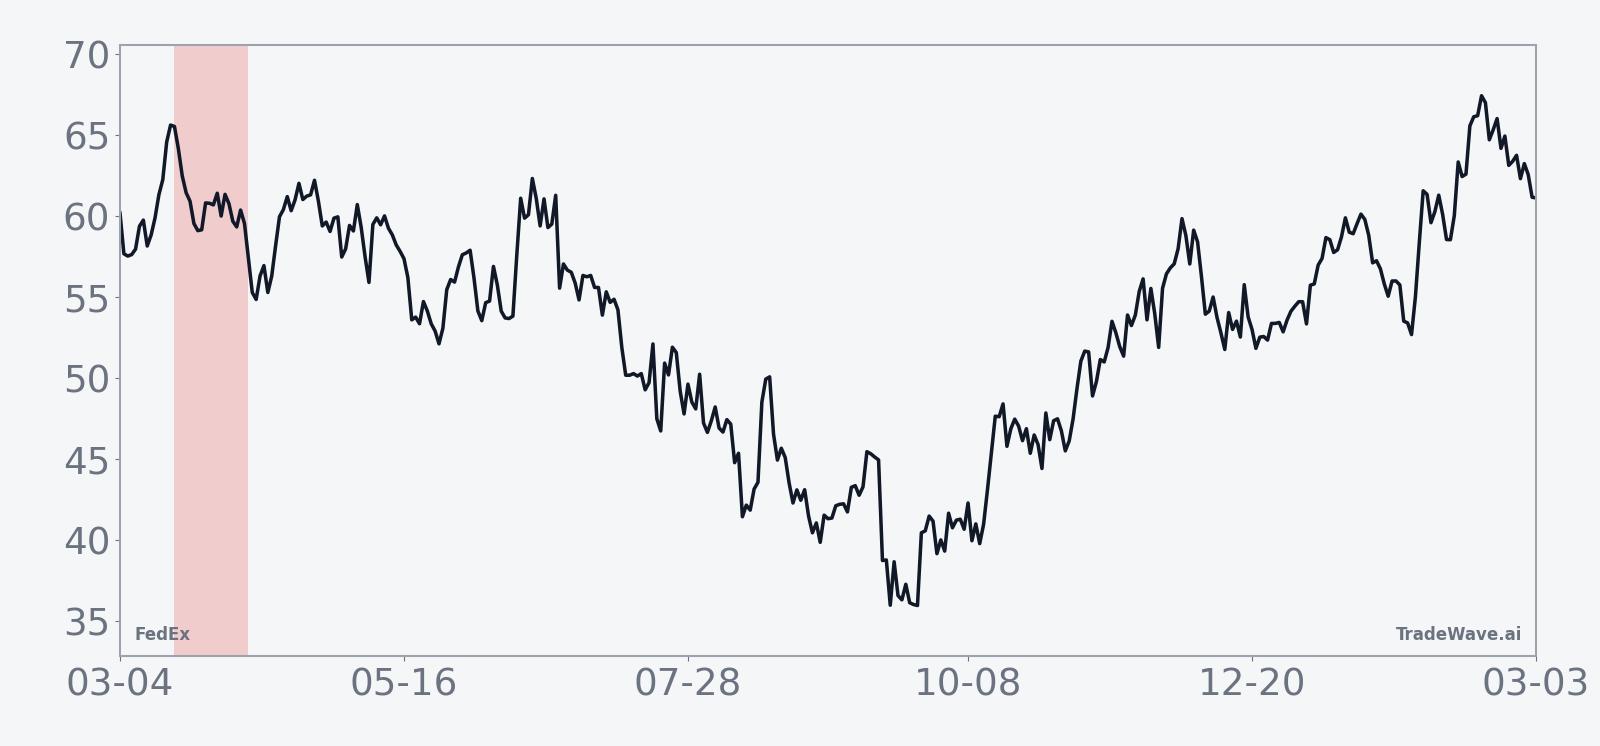
The chart below situates the latest move in its recent multi-month context.
What to watch in this window
For the rest of this 20-day stretch, the key question is whether FedEx behaves like a typical midterm-year pattern or breaks the script. Historically, the middle of the window has carried the most downside pressure for shorts, so traders will be watching for any pickup in selling as the calendar moves deeper into the period.
On the macro side, any fresh signs of slowing industrial activity or trade volumes could act as a catalyst that lines up with the seasonal bias. FedEx has shown in past cycles that when growth scares hit, the stock can move quickly, and the historical maximum adverse excursions inside this window show that volatility can cut both ways before a direction is established.
Price levels matter too. On the upside, a sustained break back toward the 392.86 high would signal that buyers are willing to look through both the seasonal pattern and macro worries. On the downside, traders will be watching how the stock behaves if it revisits the mid-300s and then the 50-day moving average around 349.05, areas that could either attract dip buyers or open the door to a deeper slide.[1]
Finally, keep an eye on volume and day-to-day range. If volatility expands and down days start to come with heavier turnover, that would look more like prior midterm-year windows where the short side worked. If instead the stock grinds sideways on light volume, it would be a sign that this cycle may be less responsive to the historical pattern. Either way, the next couple of weeks will show whether this midterm-year window remains a quiet footnote or another entry in FedEx’s record of seasonally fragile stretches.
Sources
- [1] Forbes, "How Low Can FedEx Stock Go?", Mar 16, 2026.
- [2] CNBC, "FedEx stock rises on better-than-expected earnings", Sep 18, 2025.
- [3] Reuters, "FedEx forecasts profits below analysts' target", Jun 24, 2025.
- [4] Reuters, "FedEx results top targets", Sep 18, 2025.
- [5] MarketWatch, "FedEx’s worse-than-feared outlook triggers price-target cuts", Mar 21, 2025.
- [6] CNBC, "Stay away from FedEx as competition heats up", Oct 8, 2025.
- [7] Yahoo Finance, "Watch These FedEx Price Levels", Mar 21, 2025.
- [8] Seeking Alpha, "FedEx isn't the stock to own when things go south", Mar 21, 2025.
- [9] Seeking Alpha, "FedEx rallies after topping profit expectations", Sep 18, 2025.
- [10] Seeking Alpha, "FedEx rallies after topping profit expectations", Sep 18, 2025.