Pfizer (PFE) Has Dropped in Every 59-Day Midterm Window - and a New One Just Started
Pfizer is heading into a 59-day midterm-year stretch that has rewarded shorts every time, just as shares trade near a 52-week high and investors weigh its post-COVID reset.

Key takeaways
- Pfizer has moved lower in all 6 of the last midterm election years during this 59-day window, a 100% hit rate for the short-side pattern.
- The 2026 window begins Mar 20 and runs for 59 trading days, overlapping a period when policy noise around drug pricing and tariffs has often been elevated.
- Across those six midterm-year windows, the average profit for the short setup is 5.38%, with a median move of 6.1% in the trade direction.
- Intraperiod swings have been sharp: the worst drawdowns from entry have ranged from about 5.5% to more than 13%, even in ultimately profitable short years.
- Pfizer closed at $27.32 on Mar 18, about 2.2% below its 52-week high of $27.94, after a volatile stretch tied to its obesity-drug program and a mixed 2026 outlook.[10][11]
- Trade Direction for this pattern is short, with a TradeWave Ratio of 2.79 and a Sharpe ratio of 1.83, signaling historically consistent downside bias but meaningful volatility inside the window.
According to historical data from TradeWave.ai, this specific slice of the midterm election year has behaved very differently from an average spring for Pfizer, and the next iteration starts tomorrow.
Seasonal window
Pfizer has delivered profitable short-side trades in all 6 of the last midterm election years during this 59-day window, averaging 5.38% gains for bears as the stock drifted lower. The new window begins on Mar 20 with shares at $27.32, about 2.2% below their 52-week high of $27.94 and sitting on elevated volume versus the 20-day average of roughly 38 million shares.[10][11]
Grouping the pattern by the presidential election cycle matters here because midterm years often bring heavier policy and pricing headlines for big drugmakers, from reimbursement debates to tariff threats. For a name like Pfizer that sits at the intersection of healthcare policy and global trade, those mid-cycle crosscurrents have historically lined up with a distinct spring soft patch in midterm years rather than a generic “sell in May” effect.
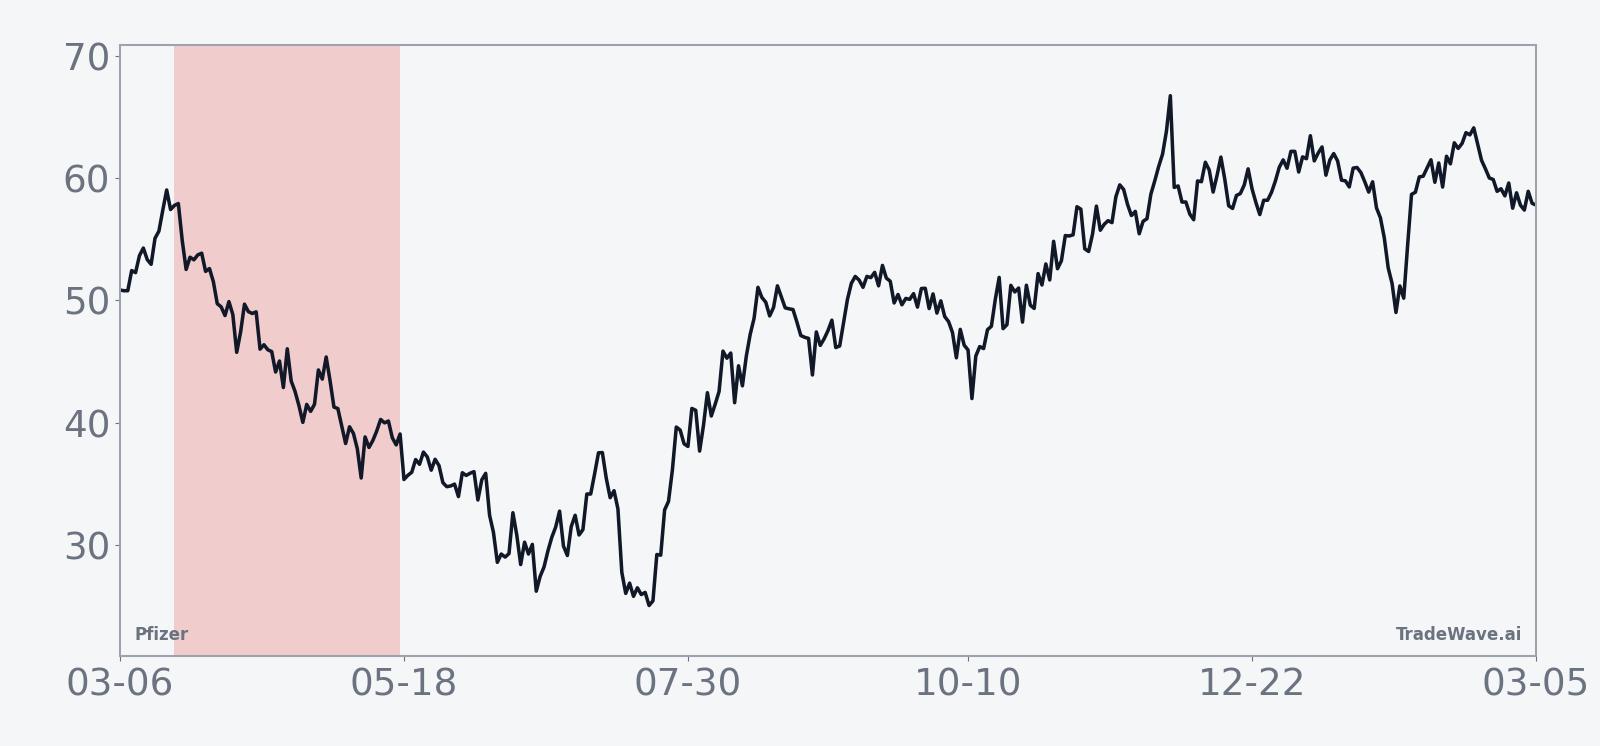
This seasonal window begins on Mar 20 and spans 59 trading days. Historically, during this period in midterm election years, Pfizer has tended to weaken in a way that has favored short positions rather than longs. The Trade Direction for the pattern is short, and every one of the six historical windows in this election-cycle grouping has ended with the stock below its entry level.
Percent Profitable for the short setup is 100%, with 6 winners and 0 losers across the lookback. Average profit for those winning short trades is 5.38%, while the median move is slightly higher at 6.1%, which points to a fairly tight cluster of outcomes rather than a single outlier year driving the stats. Cumulative return across the six midterm-year windows is 36%, which means that a systematic short approach in this slice of the calendar would have added up to sizable downside capture over the past two decades.
The intraperiod path has not been smooth. In the strongest year for shorts, 2006, Pfizer fell 7.44% from entry to exit, but the worst drawdown from the entry price during that window reached 8.65%, showing that the stock first moved against the trade before rolling over. In 2002 and 2022, the maximum adverse excursions were even deeper at 13.27% and 13.05% respectively, while the final net returns were smaller in magnitude, which underlines how painful the path could be for anyone leaning into the pattern without room for volatility.
On the favorable side, the best point-to-peak moves within the window, known as maximum favorable excursions, have ranged from about 0.23% in 2006 to 3.93% in 2022. That mix of sizable worst-case drawdowns and more modest best-case intraperiod runs suggests a grind-lower profile rather than a straight-line collapse, which fits with a defensive large-cap healthcare stock reacting to a steady drip of headlines rather than a single shock.
The historical seasonal trend chart for this window shows that most of the downside for shorts has tended to accrue in the middle third of the 59-day stretch rather than right at the start. Early days often see choppy price action with both favorable and adverse swings before the pattern leans more consistently in the trade direction. By the final two weeks, the average path flattens, implying that much of the move has usually already played out.
Looking at the cumulative return profile across the six midterm-year windows, the line slopes steadily in favor of shorts with only brief pauses, not long plateaus or reversals. That cumulative climb in short-side profits is what drives the 1.83 Sharpe ratio, a risk-adjusted measure that captures how strong the average outcome has been relative to the volatility of end-of-window returns.
The bar chart that stacks net results with both best and worst intraperiod moves makes the risk-reward tradeoff clear. In every year, the maximum adverse move from entry has been larger in magnitude than the final net gain for shorts, which means traders who stayed with the pattern had to tolerate bigger temporary losses than the profits they ultimately booked. At the same time, the fact that all six bars finish in the green for the short direction shows how persistent this midterm-year soft patch has been for Pfizer.
Add it up: six for six winning short windows, mid-single-digit average downside, and double-digit worst-case drawdowns inside the trade. History does not guarantee a repeat, but this is one of the cleaner midterm-year patterns on Pfizer’s seasonal calendar.
A second view combines yearly net results with the best and worst intraperiod swings to show how the pattern has traded inside the window.
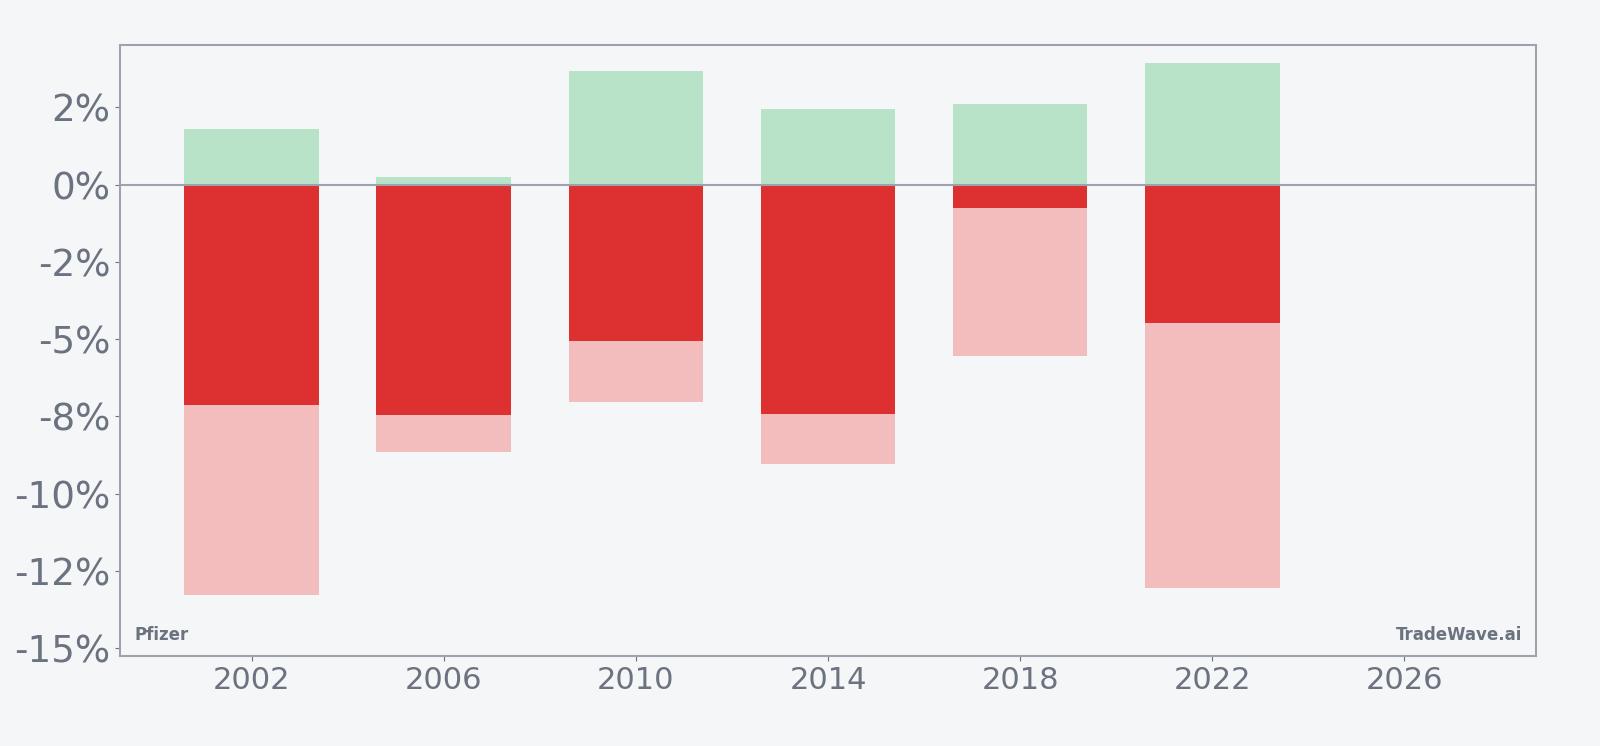
History does not guarantee future results, and the worst adverse moves within this window have been large even in years that ultimately finished as winners for the short-side pattern.
Price and near-term drivers
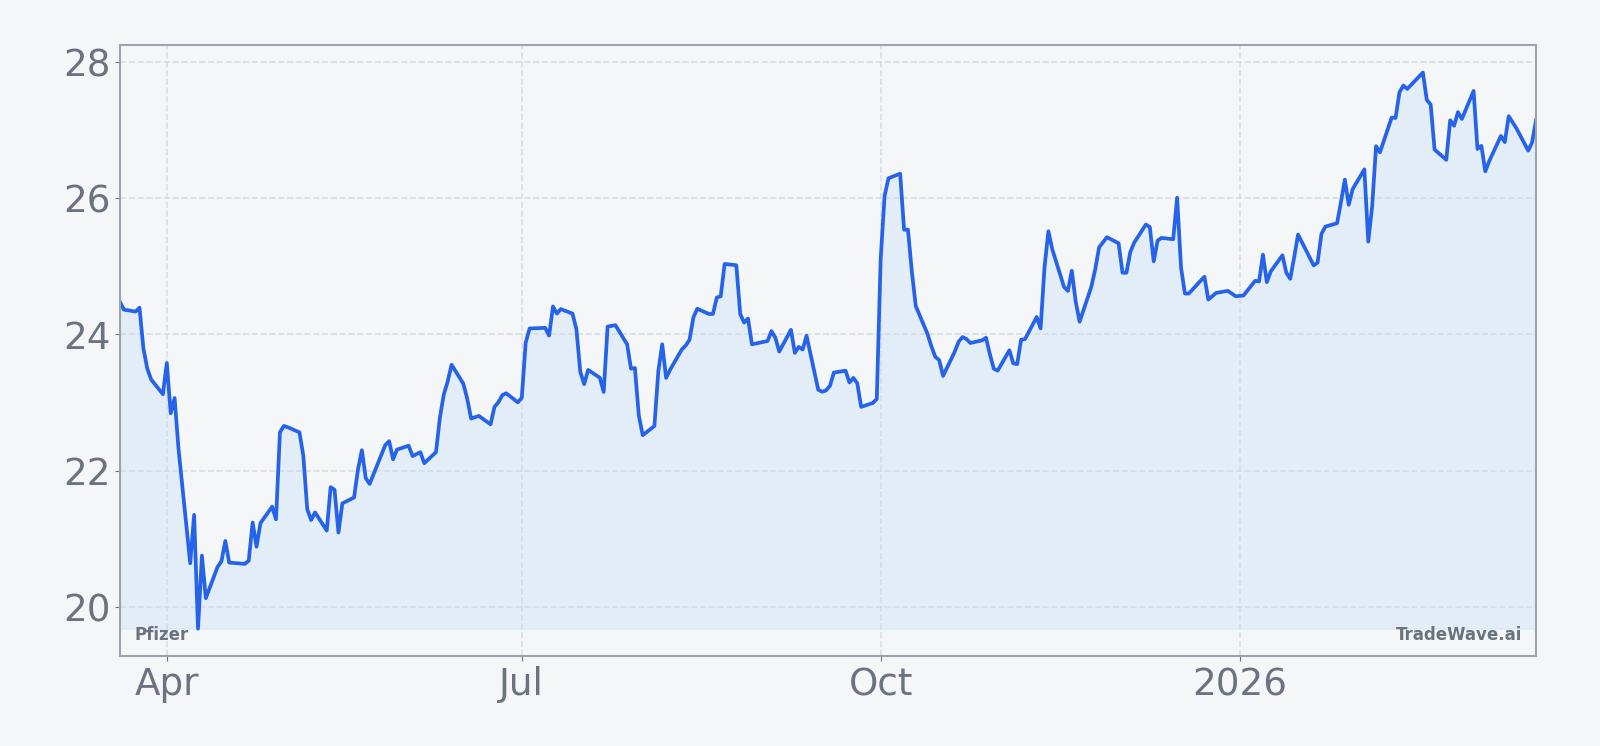
Pfizer shares last closed at $27.32, down 0.47% on Mar 18, leaving the stock about 2.2% below its 52-week high of $27.94 and well above the 52-week low near $18.18. The stock is trading slightly above its 50-day moving average of roughly $26.36, with 20-day average volume around 38 million shares, which points to a name that has stabilized after a bruising post-COVID reset but has not yet broken out decisively.[10][11]
In late January 2026, Forbes highlighted how Pfizer’s stock had lagged rivals Merck and Johnson & Johnson as investors discounted fading COVID-19 revenues and a tougher patent backdrop, leaving the company leaning more heavily on cost cuts and pipeline execution to drive earnings.[10] That underperformance has framed Pfizer as a value and turnaround story rather than a pure defensive play, even as it remains a core holding in many healthcare portfolios.
On Feb 3, 2026, The Wall Street Journal reported that Pfizer’s experimental obesity drug delivered 12.3% body weight loss in trials, but shares fell as traders focused on questions around efficacy versus competitors and potential side effects.[11] The reaction underscored how sensitive the stock has become to any signal about its next growth engine, especially in high-profile categories like weight loss where peers have already set a high bar.
Those product and pipeline questions sit on top of a macro backdrop that still includes pressure on drug pricing and periodic tariff headlines. In 2025, Pfizer executives acknowledged ongoing discussions with U.S. policymakers over pricing, even as they stressed that no firm commitments had been made, and investors have treated that policy overhang as a structural risk to margins rather than a one-off shock.[12]
The chart below situates the latest move in its recent multi-month context.
Macro and policy backdrop
Pfizer’s seasonal midterm-year pattern is unfolding against a policy calendar that remains crowded for large-cap pharma. Tariff debates and calls for lower drug prices have been recurring themes, with 2025 coverage emphasizing how the company raised its profit outlook even as it flagged uncertainty around trade and reimbursement.[4][5][7][12] That mix of cost discipline and policy risk has often translated into choppy trading rather than a clean trend.
At the same time, Pfizer is managing through a classic patent-cliff phase. Coverage in late 2025 and early 2026 pointed to weakening COVID product demand and looming expiries on key drugs, which together forced a reset of 2026 revenue and earnings expectations.[1][3][6][8][10] The company has leaned on acquisitions and new launches to fill the gap, but investors have treated each guidance update as a referendum on whether that strategy is keeping pace with the erosion of legacy cash flows.
Legal and competitive fronts add another layer. In Nov 2025, Pfizer filed a second lawsuit against Metsera and Novo Nordisk, a move that highlighted how aggressively it is defending its turf in obesity and related metabolic markets.[9] Litigation rarely drives day-to-day price action, yet it shapes how investors handicap the long-term economics of new categories that are central to the bull case.
What to watch as the window opens
For traders tracking this 59-day midterm-year window, the first thing to watch is how Pfizer behaves relative to its recent range around $27. A quick break below the 50-day moving average near $26.36 with rising volume would rhyme with prior midterm windows that saw the stock drift lower after an initial period of noise.[10][11] A firm hold above that level, especially if the stock pushes back toward the 52-week high, would mark a clear departure from the historical pattern.
Policy headlines are the second key variable. Any renewed focus on U.S. drug pricing or tariffs could revive the kind of mid-cycle pressure that has historically weighed on Pfizer during midterm years, particularly if it coincides with earnings or guidance updates.[4][5][7][12] Conversely, a quieter policy tape would test how much of the seasonal weakness has been about macro noise versus company-specific execution.
Pipeline news, especially around obesity and other high-profile programs, is the third lever. The Feb 2026 obesity-drug data showed how quickly sentiment can swing when trial results land even slightly off the market’s expectations.[11] Another round of data or regulatory milestones inside this window could either reinforce the historical pattern of midterm-year softness or overwhelm it if investors decide the pipeline is finally turning the corner.
Finally, relative performance versus peers like Merck and Johnson & Johnson will be a useful tell. If Pfizer continues to lag while the broader pharma group holds up, that would fit with a company-specific soft patch consistent with the seasonal record.[10] If the stock starts to close the gap or lead the group higher, it would signal that this midterm-year window is breaking from its six-for-six history, and traders will need to decide whether the underlying story has changed enough to justify that break.
Sources
- [1] Seeking Alpha, "Pfizer raises earnings outlook as COVID vaccine sales drive Q3 beat" (Nov 4, 2025)
- [2] Reuters, "Pfizer raises 2025 profit forecast on cost cuts, forex gains" (Aug 5, 2025)
- [3] The Wall Street Journal, "Pfizer Expects Decline in Covid-19 Drug Demand to Hurt 2026 Earnings" (Dec 16, 2025)
- [4] The Wall Street Journal, "Pfizer Raises Profit Outlook Despite Uncertainty Over Tariffs, Drug Prices" (Aug 5, 2025)
- [5] Reuters, "Pfizer raises 2025 profit forecast as cost-cutting program gains traction" (Aug 5, 2025)
- [6] Forbes, "Buy Or Sell Pfizer Stock?" (Dec 24, 2025)
- [7] Reuters, "Pfizer raises annual profit forecast" (Aug 5, 2025)
- [8] Yahoo Finance, "Pfizer (PFE): Reassessing Valuation After Cautious 2026 Outlook" (Dec 16, 2025)
- [9] Seeking Alpha, "Pfizer files second lawsuit against Metsera, Novo Nordisk" (Nov 3, 2025)
- [10] Forbes, "Pfizer vs. Merck Stock And JNJ" (Jan 27, 2026)
- [11] The Wall Street Journal, "Pfizer Stock Drops on Obesity-Drug Study Data" (Feb 3, 2026)
- [12] Reuters, "Pfizer CEO says 'no commitments' made in meetings with US governments on drug pricing" (Jun 9, 2025)