Lockheed Martin (LMT) Has Rallied 10 Straight Years in This 24-Day Spring Window
Lockheed Martin is climbing again as a 24-day spring stretch opens that has delivered gains in every one of the past 10 years, just as defense demand and a higher 2026 outlook keep the stock in focus.

Key takeaways
- A 24-day spring window starting Mar 26 has produced gains for Lockheed Martin in 10 of 10 years, a 100% hit rate for long trades.
- Average profit across those winning years is 4.6%, with cumulative gains of 56% over the decade in this specific slice of the calendar.
- The pattern is long-biased, with a Trade Direction of “long,” a TradeWave Ratio of 1.59 and a Sharpe ratio of 1.58, pointing to historically favorable risk-adjusted returns.
- Intraperiod swings have been real: in 2020 the stock’s best run-up inside the window reached 14.88%, while the worst drawdown that year hit 8.08% from entry.
- Today’s move leaves LMT about 9.8% below its 52-week high, so the seasonal tailwind is arriving with the stock still off peak levels.
- History shows no losing years in this window, but some have been shallow, with gains as low as 0.61%, and adverse excursions have occasionally been sharp before the trade finished higher.
According to historical data from TradeWave.ai, this late-March window has behaved very differently from an average month for Lockheed Martin, and the next section unpacks what that pattern has looked like over the past decade.
Seasonal window
Lockheed Martin has risen in 10 of 10 years during this 24-day window starting Mar 26, averaging 4.6% gains for long trades. The stock opened at 612.5 and finished Thursday at 624.2, up 2.3% on the day and sitting about 9.8% below its 52-week high of 692, with the seasonal stretch now underway.
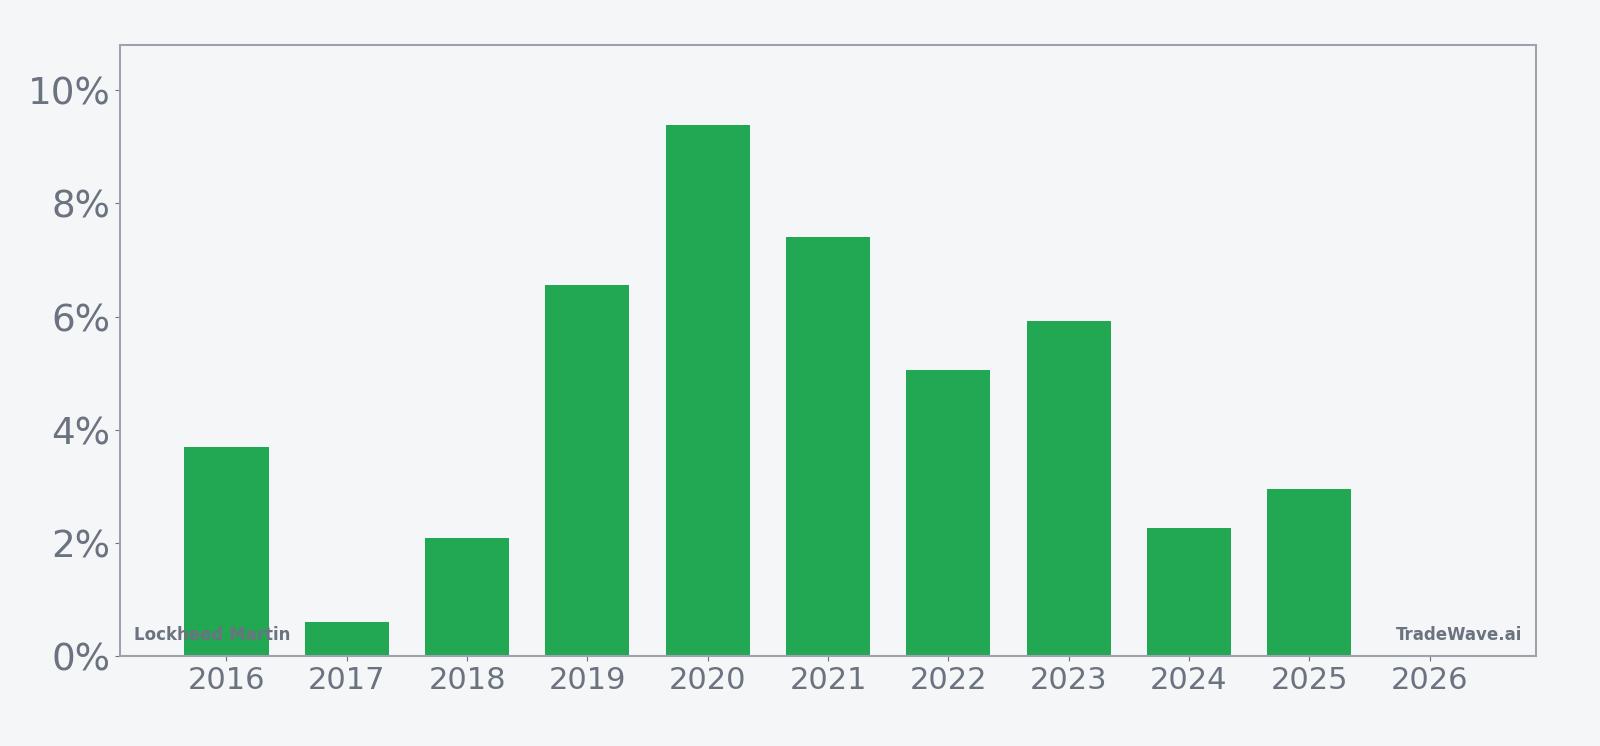
Across the 10-year sample, every iteration of this window has finished in the green for a long position, with cumulative gains of 56% when you stack the years together. The strongest close-to-close result came in 2020, when LMT returned 9.39% over the 24 days, while the softest year was 2017 with a still-positive 0.61% gain. Median profit of 4.37% sits close to the average, which suggests the pattern has not been skewed by a single outlier year.
The intraday path has been bumpier than the clean win rate suggests. In 2020, the maximum favorable move inside the window reached 14.88% from the entry price, but the worst drawdown that year also hit 8.08% below entry before the trade finished higher. In 2018 and 2025, the stock ultimately posted modest gains of 2.1% and 2.96%, yet the worst intraperiod drops were 4.78% and 5.91% respectively, showing that even “winning” years have demanded a strong stomach.
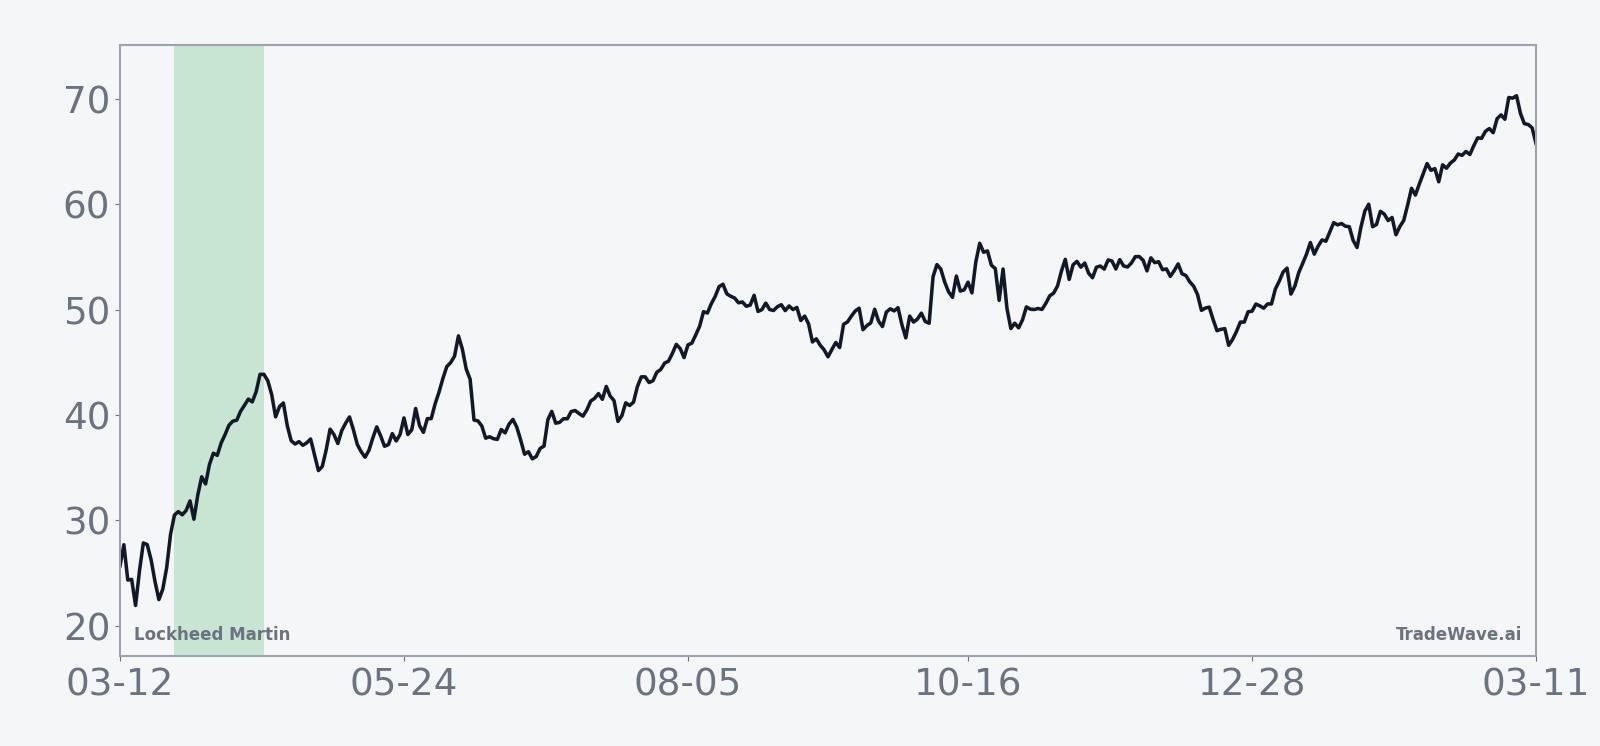
The 10-year average trend line for the window slopes steadily higher, with much of the typical gain accruing in the middle of the period rather than in a single burst at the start or end. That profile lines up with the long Trade Direction and a Sharpe ratio of 1.58, which points to historically favorable risk-adjusted returns for longs over this specific stretch.
A stacked view of yearly net returns alongside peak run-ups and worst drawdowns shows how upside and downside have traded off inside the window.
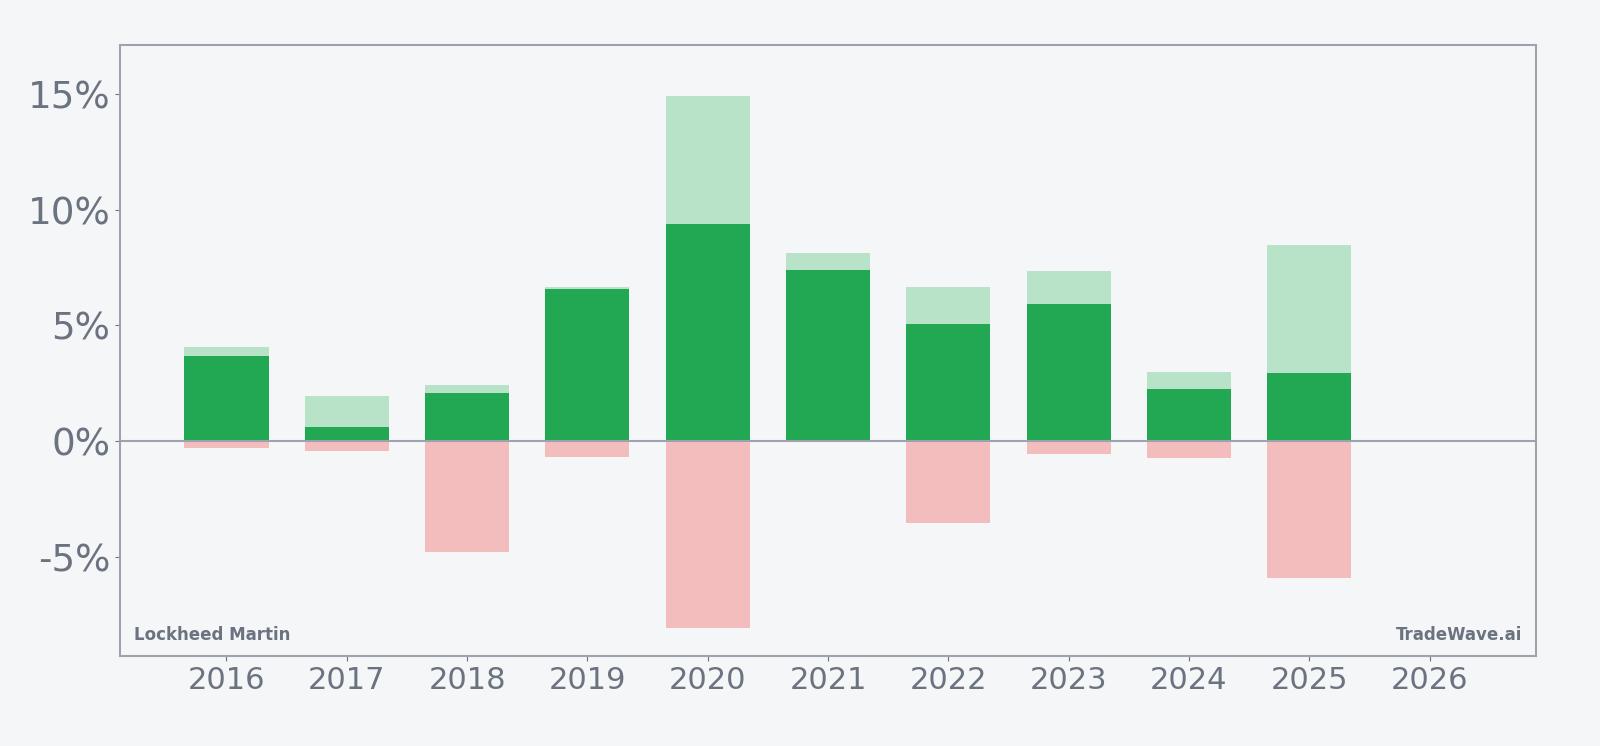
The combined net, best-case and worst-case bars show a consistent pattern of positive finishes, but with several years where the worst drawdown approached mid-single digits even as the best run-up pushed into high single or low double digits. That mix of strong maximum favorable moves and sometimes deep maximum adverse moves is what drives the TradeWave Ratio of 1.59 and underlines that this has been a high-conviction but not low-volatility window for LMT.
History does not guarantee future results, and even in a window with no losing years, adverse excursions can be large before trades finish higher.
Price and near-term drivers
Lockheed Martin shares gained 2.3% Thursday to close at 624.2, extending a rebound that still leaves the stock below its 50-day moving average of 629.81 and about 9.8% under its 52-week high of 692. The move comes with one-month performance still negative at roughly -3.6%, a reminder that the stock has been consolidating after a strong multi-quarter run.
In late January 2026, Lockheed Martin raised its 2026 outlook as sales of fighter jets and weapons systems climbed, helped by ongoing conflicts in the Middle East and the Russia-Ukraine war that are driving demand from U.S. and allied customers.[4] Management guided 2026 revenue to a range of $77.5 billion to $80 billion and projected profit per share of $29.35 to $30.25, both above prior expectations, while trimming 2025 earnings estimates after earlier program charges.[4]
The company is leaning on a record backlog and strong demand in aeronautics and missiles, which had already supported better-than-expected Q3 2025 results and a higher dividend and buyback plan.[1] That strength followed a rough Q2 2025, when $1.6 billion in charges on classified programs drove an 80% drop in earnings and a sharp one-day stock selloff, underscoring how sensitive the name can be to execution on complex defense contracts.[3]
Analysts have generally stayed constructive on the stock. In January 2026, Truist described Lockheed Martin as attractively valued to start the year and maintained a Buy rating, with a cited consensus price target around $605 that reflected an earlier price regime before the latest leg higher.[2] With the shares now trading above that level, investors are watching how quickly the Street refreshes targets against the upgraded 2026 guidance and elevated geopolitical demand backdrop.[2][4]
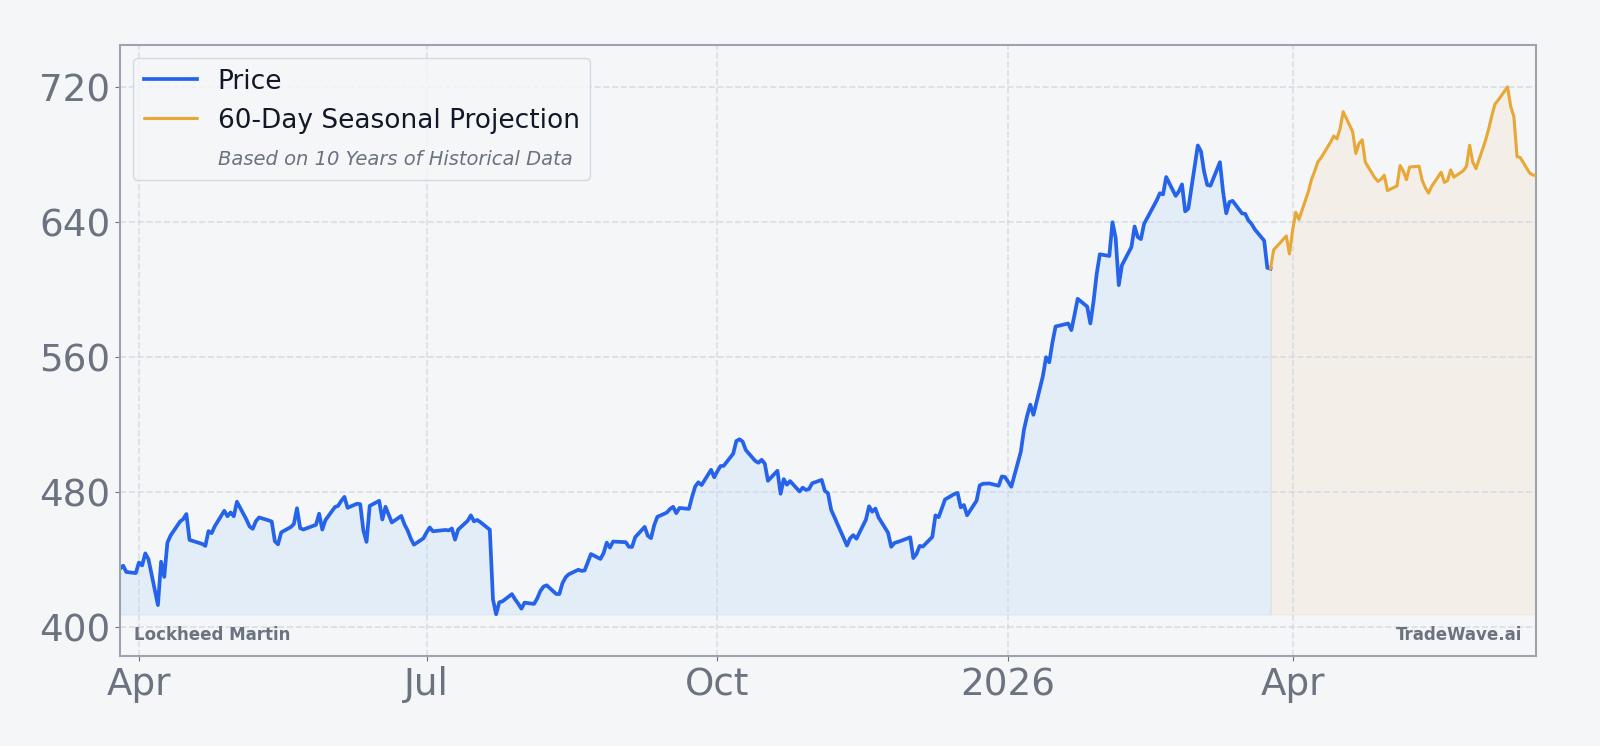
The chart below situates the latest move in its recent multi-month context, alongside a 60-day seasonal projection based on the historical pattern.
Earnings and guidance backdrop
Lockheed Martin’s recent earnings path has been a story of near-term turbulence followed by a reset to higher long-term expectations. Q2 2025 profit fell sharply to $1.46 per share, far below consensus of $6.52, after the company booked $1.6 billion in charges tied to classified aeronautics programs, triggering a steep one-day drop in the stock.[3] By Q3 2025, the narrative had shifted, with adjusted earnings of $6.95 per share on $18.6 billion in sales, both ahead of forecasts, and management lifting its dividend and buyback plans as the backlog swelled to a record level.[1]
The January 2026 outlook update built on that recovery. Management projected 2026 revenue of $77.5 billion to $80 billion and earnings per share of $29.35 to $30.25, above prior expectations, while revising 2025 earnings guidance down to $21.70 to $22.00 per share to reflect the earlier charges.[4] For traders watching the seasonal window, that combination means the stock is entering a historically strong stretch with a clearer earnings runway but a recent reminder that program risk can still bite.
Macro and sector context
Lockheed Martin sits at the center of a defense cycle shaped by elevated geopolitical risk. Ongoing conflicts in the Middle East and the Russia-Ukraine war are driving demand for jets, missiles and other weapons systems, supporting higher order flow and contract opportunities for the company.[4] That demand has helped push the backlog to roughly $179 billion, giving the business multi-year revenue visibility even if individual programs hit bumps.[1]
Across the defense sector, spending from the U.S. and allied governments remains firm, with a focus on replenishing munitions, upgrading air fleets and investing in missile defense.[1][4] For a stock like LMT, that macro backdrop can amplify seasonal tendencies: when the tape is already leaning in favor of defense names, a historically strong calendar window can attract more attention from systematic and discretionary traders alike.
Valuation and positioning
Valuation work on Lockheed Martin has been complicated by the Q2 2025 earnings shock and the subsequent guidance reset. When Truist called the stock attractively valued in early January 2026, the shares were trading below today’s level and below the then-consensus target of about $605, a gap that has since closed as the price moved higher.[2] With the stock now above that prior target and still below its 52-week high, investors are effectively paying up for the upgraded 2026 earnings path and the durability of defense demand.
Positioning-wise, the absence of a clear recent spike in short interest or unusual options activity in the available data suggests the current move is being driven more by fundamental and macro flows than by a single crowded trade. That leaves the seasonal window as a cleaner overlay on top of a story that is still dominated by contract wins, budget decisions and execution on large programs.
What to watch in this window
For the next 24 trading days, the key test is whether Lockheed Martin can extend its 10-for-10 record in this spring window while managing the kind of intraperiod drawdowns that have shown up in past years. Traders will be watching how the stock behaves around the 50-day moving average near 629.81 and whether it can start to close the gap toward the 52-week high at 692 without repeating the mid-window air pockets seen in 2018, 2020 and 2025.
On the fundamental side, any new contract announcements, updates on classified aeronautics programs or shifts in geopolitical headlines could either reinforce or challenge the historical pattern.[3][4] A steady tape with contained downside swings would rhyme with the smoother years in the sample, while another bout of program-related volatility would look more like 2020 or 2025, when the maximum adverse move was large even though the trade finished higher.
Finally, watch how the Street’s view evolves. If analysts begin to lift price targets to reflect the higher 2026 guidance while the stock trades inside a historically strong window, that combination could draw in incremental buyers.[2][4] If, instead, the shares stall below resistance despite the seasonal tailwind and upbeat outlook, it would be an early sign that expectations may already be full and that this year’s iteration of the pattern could end up closer to the low end of the historical gain range.
Sources
- Seeking Alpha: Lockheed Martin tops Q3 estimates, lifts dividend and buyback plans (Oct 21, 2025)
- CNBC: Lockheed Martin is attractively valued to start the year, says Truist (Jan 9, 2026)
- MarketWatch: Lockheed Martin’s stock rocked by big profit miss amid problems in aeronautics (Jul 22, 2025)
- Reuters: Lockheed Martin raises 2026 outlook as sales of jets and weapon systems grow (Jan 29, 2026)